how to forecast sales

How to forecast sales: A pocket guide for sales managers

Lucid Content

Reading time: about 6 min

Topics:

  • Sales

Like weather forecasting, sales forecasting is an imprecise art. But you can still make valuable predictions or narrow the margin of error. Follow our guide and learn how to forecast sales accurately, including factors to consider and common methods to use.

What is sales forecasting?

Sales forecasting is an essential component of business planning and strategy. At the basic level, a sales forecast predicts how much business a person, team, or organization will close within a given timeframe.

Companies use sales forecasts to inform business decisions, including budgets, hiring plans, marketing strategies, and inventory management.

Without a clear picture of sales outcomes, the company’s budgets, expenses, growth strategies, and resource management can fall apart. At its worst, this can mean significant profit losses, cash flow problems, layoffs or even bankruptcy.  

On the other hand, good sales forecasting can help teams and organizations make sound decisions, manage resources appropriately, and even identify potential issues early and course correct.

Factors that can influence your sales forecast

Even the best forecasts are subject to internal and external factors. Take a look at a few variables that could affect your sales projections.

Personnel fluctuations

Changes in team numbers and dynamics can significantly affect sales outcomes. For instance, if a sales rep leaves, your sales will almost certainly fall until you can replace them and get the new rep ramped up.

Economic conditions

When forecasting, it’s important to account for the economic climate. A booming economy tends to deliver prospects who are more confident and willing to invest. However, a slow economy leads to slower sales cycles and prospects who need more encouragement.

Competitor changes

Unexpected changes in the competitive market can make or break a sales forecast. For example, if your competitor reduces rates or adds value to their comparable product offerings, your reps may have a harder time closing opportunities. They might need to offer bigger discounts or sweeten the deal with added services.

Product changes

Usually, product changes translate to better sales by offering improved product features, a more attractive pricing model, or other benefits. These changes can help reps sell more, faster. Just make sure the team is informed on prospective product changes so they can prepare and adjust their selling strategies and hit the ground running at launch.

Common sales forecasting methods

You can project sales in several ways. Here are some of the most common methods and how to forecast sales with each.
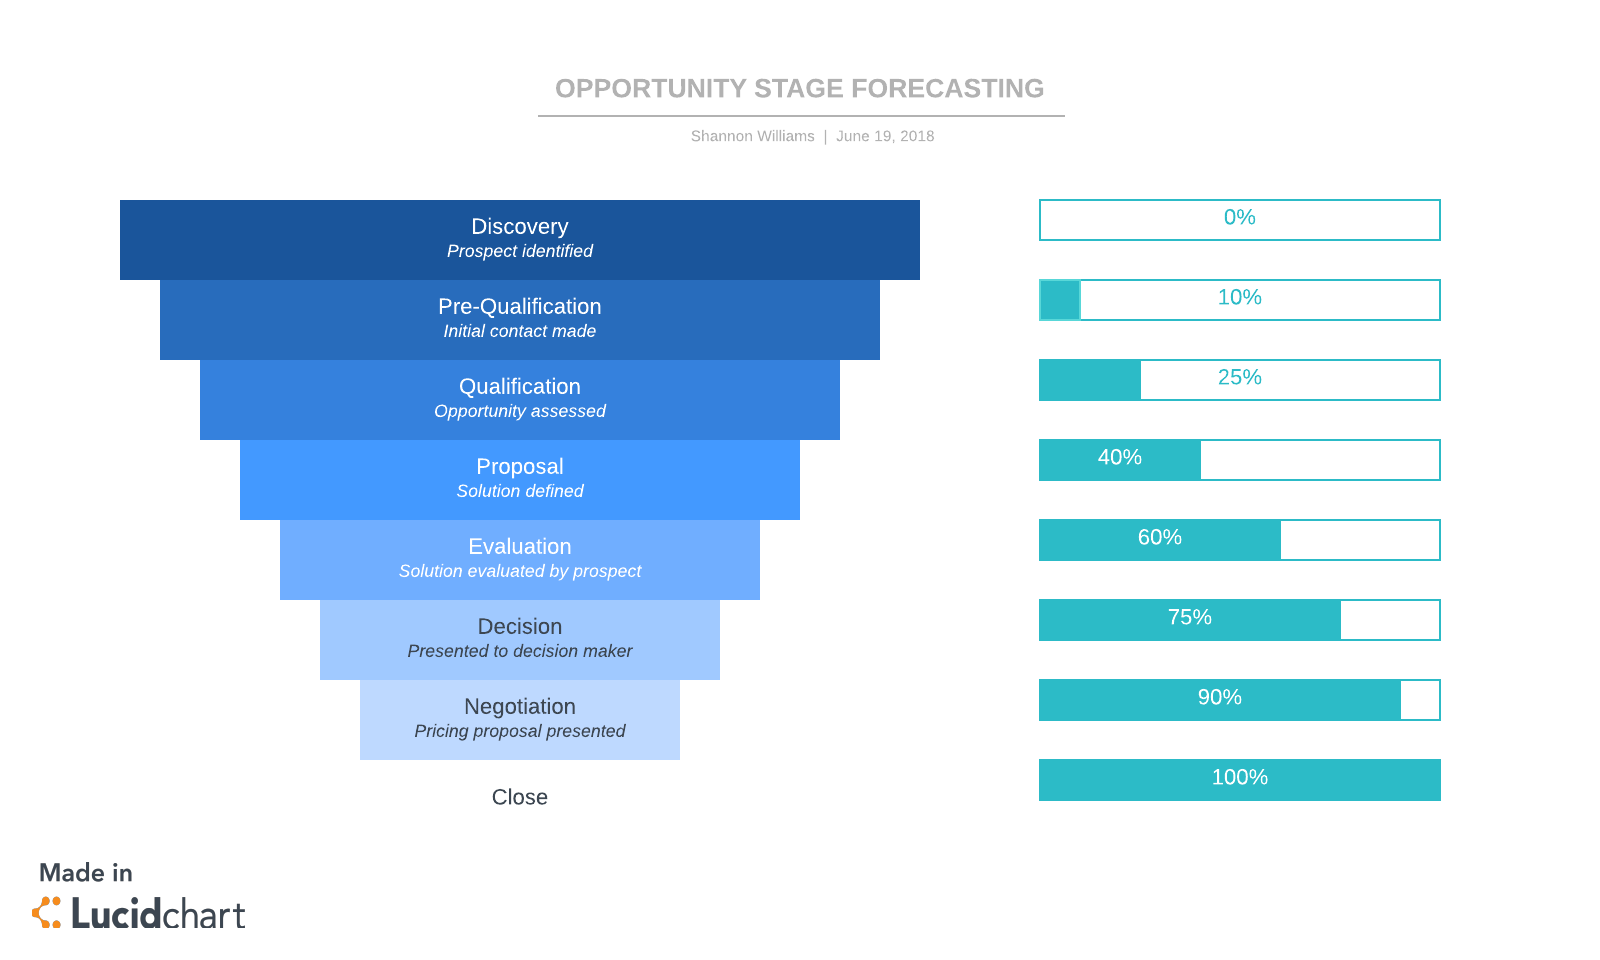
Opportunity stage

This forecasting method predicts the probability that an opportunity will close based on where the prospect is in the sales process.

The further along the prospect is in the funnel, the more likely the deal will close.

When creating a forecast, the salesperson will look at each opportunity and identify:

  • The stage the prospect is in
  • How likely they are to close
  • The value of that opportunity

To be successful, the sales rep needs to understand the average sales cycle and have a clear outline of each stage of the sales process to make a reasonable prediction.

Under this model, you can estimate the expected revenue by multiplying the deal amount (or value of the opportunity) and the probability of closing. For example, if a prospect is being nurtured toward a $100 opportunity and has a 20% probability of closing that deal, the forecasted revenue is $100 x .20 or $20. Whereas, another prospect further down the sales funnel on a $500 opportunity with a probability of 45% would forecast at $225 in expected revenue for the projected timeline.

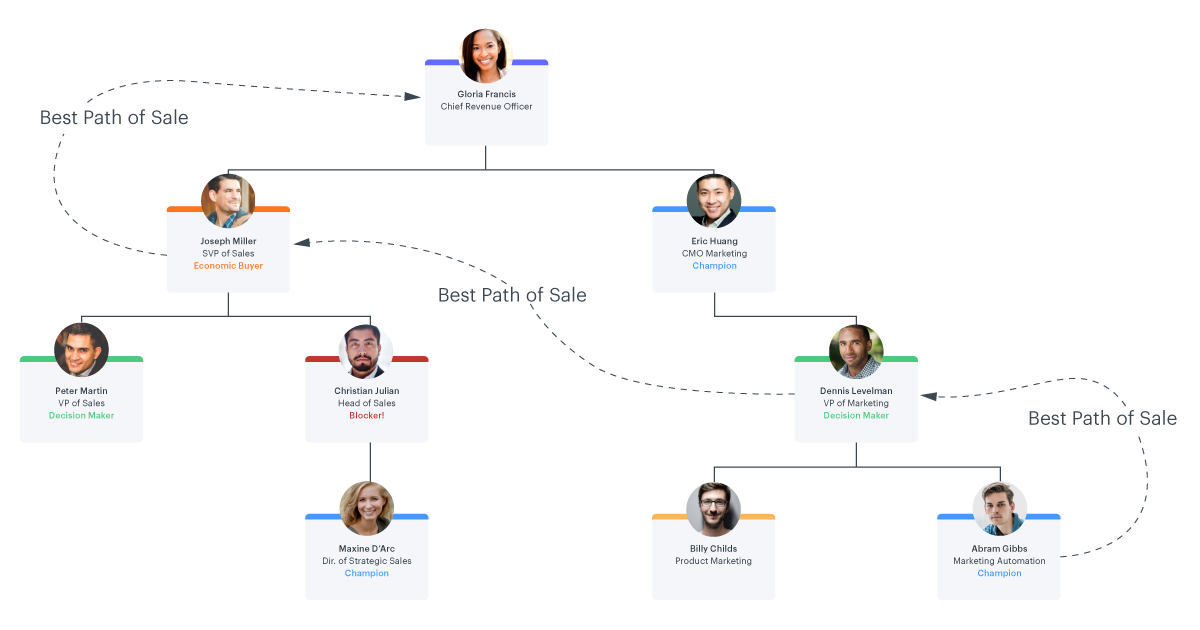
You can use Lucidchart to illustrate this methodology as you train sales reps or to have them visualize the probability of closing on each account.

opportunity stage forecasting
Opportunity Stage Forecasting (Click on image to modify online)

Historical

Historical forecasting is a quick and easy way to get insights based on past performance in a given timeframe.

The idea is to look up performance from a similar timeframe and assume the current period’s results will be equal to or greater than the past. For instance, to predict sales for the quarter, you would look up sales from the previous quarter. If your team sold $100,000 last quarter, you could assume they will sell at least that amount this quarter.

Many businesses also use timeframes in previous years to predict outcomes for the current year. For example, to forecast sales for August, sales managers would look at the numbers from the last August and multiply by inflation to get their forecast.

For a more sophisticated projection, you can also add repeat business from the previous year to the total. To do this, multiply your repeat business revenue by the churn rate, and then subtract the churn from your repeat business revenue. Add the total to your forecast to get a clearer picture of overall revenue for that period.  

Keep in mind that, while this is a useful method for setting a benchmark forecast, historical forecasting doesn’t account for variabilities such as seasonal selling patterns or buyer demand.

Intuitive or forecast stages

As the name implies, intuitive forecasting relies on the sales rep’s knowledge and insights into their prospects. The salesperson uses their experience and intuition to predict the probability that any given opportunity will close. For instance, a rep may have been working with a prospect for several weeks and is confident they will close the deal within the month.

This method is more art than science. For this approach to be useful, you have to have sales reps that are honest (and accurate) about their abilities and realistic in their projections.

However, if you are confident in your reps’ judgments, intuitive forecasting on newer leads can help you get early projections, help managers and execs start forecasting to inform decisions, and help teams set realistic goals.

Regression analysis

Multivariate or regression analysis is probably the most accurate sales forecasting method, but also the most mathematically focused.

The basic premise of this strategy is to use predictive analytics to determine revenue by calculating the relationships between variables that impact sales. This method could involve incorporating factors like length of sales cycle, opportunity type, and individual rep performance metrics.

This method often requires a forecaster trained in mathematics or statistics and a healthy budget to support an advanced analytics solution.

Accurately predict your pipeline

Although there are in-depth and highly technical forecasting methods, you don’t have to have a PhD to complete a useful (and accurate) projection.

And it’s a good thing, too.

Sales forecasting is a valuable tool for managers to set realistic goals, create effective sales strategies, and manage their team and resources wisely. To accurately forecast, sales managers rely on their reps’ projections to estimate the team’s revenue contribution. But this can be difficult if information is spread across platforms and teams. To streamline the forecasting process, sales teams need the right software for the job.

Lucidchart makes forecasting easier and more accurate through its powerful Salesforce integration, shareable reporting, and dynamic visualizations.

Sales reps can import their contacts from Salesforce to build account maps that show the relationships they’ve established and key roles of each contact. Because these account maps are centrally managed in Salesforce, leadership and anyone with access to the Salesforce record can review the account map.

Salesforce account map
Basic account map (Click on image to start your own)

These visuals make it easy for reps and their managers to assess the pipeline, identify where each prospect is in the sales process, and make more accurate predictions on which opportunities will close.

Create better forecasts and find the best path to sale with Lucidchart. Sign up for a free trial today.

Lucidchart

Lucidchart, a cloud-based intelligent diagramming application, is a core component of Lucid Software's Visual Collaboration Suite. This intuitive, cloud-based solution empowers teams to collaborate in real-time to build flowcharts, mockups, UML diagrams, customer journey maps, and more. Lucidchart propels teams forward to build the future faster. Lucid is proud to serve top businesses around the world, including customers such as Google, GE, and NBC Universal, and 99% of the Fortune 500. Lucid partners with industry leaders, including Google, Atlassian, and Microsoft. Since its founding, Lucid has received numerous awards for its products, business, and workplace culture. For more information, visit lucidchart.com.

Bring your bright ideas to life.

Sign up free

or continue with

Sign in with GoogleSign inSign in with MicrosoftSign inSign in with SlackSign in

Get started

  • Pricing
  • Individual
  • Team
  • Enterprise
  • Contact sales
PrivacyLegal
  • linkedin
  • twitter
  • instagram
  • facebook
  • youtube
  • glassdoor
  • tiktok

© 2024 Lucid Software Inc.