
How to Simplify Your PPC Processes (and How Lucidchart Can Help)
Mallory Reese
Reading time: about 5 min
I was only a few days into my summer internship at Lucid, and I had hit a wall. I was working with the PPC marketing team, and I’d spent the last few days buried in Excel spreadsheets, trying to do keyword research, but I didn’t feel like I was getting anywhere. Although Excel was great for running formulas and making forecasts, it was hard to see the big picture of the project I was working on. If only there was a way to visualize it…
I quickly opened up my Lucidchart account on my browser and started mapping out the steps I needed to follow to come up with a new list of keywords to implement. After visualizing the keyword implementation process with Lucidchart, everything became clear.
Since that first week, Lucidchart has been my go-to. As I’ve worked on our PPC marketing team, Lucidchart has provided the visual element that is absent from the tools I use everyday. From mapping out our AdWords account structure to documenting our revenue reporting process, Lucidchart has made our most complicated PPC processes simple.
1. Use Lucidchart to map out your account structure
When I started working at Lucid, I was tasked with working on an AdWords account with over 100 different campaigns, some containing upwards of 5,000 single keyword ad groups. The account became even more complicated because we were advertising in 60 countries. Trying to get a holistic view of our account from the AdWords platform would have been impossible, seeing as AdWords has no visualization capabilities for account structure. Mapping the account in Lucidchart made it easy to get a bird’s eye view of our account.
Every account map will look different depending on the size and structure of your account. In our case, we needed a way to easily see how our campaigns were mapped out across the countries we were advertising in and which general categories our keywords fell into.


I created one chart that showed how all of our campaigns were organized by campaign type (search, display, etc.) and segmented by region. For our keyword map, I broke down our 5,000 keywords into general categories—those related to specific diagram types, keywords related to product functionality, with everything else falling under a miscellaneous category. Under each major category, I mapped the most common keyword stems that would encompass all of that category’s keywords.
Whether your account is large or small, having a visual document of your paid advertising accounts can be helpful for many reasons:
- After mapping out our account, I was able to quickly identify areas where we could target additional keywords.
- As we’ve ramped up our international marketing efforts, I’ve frequently referenced this document to make sure any changes we make in our account are scaled across the appropriate countries.
- As our paid advertising team grows, this document makes it easy for newcomers to become familiar with our account.
2. Use Lucidchart for landing page optimization
After I got familiar with our AdWords account, the next step was looking for ways we could improve our advertising performance—specifically with our landing page design. Although I had ideas for landing page optimization, I didn’t have the resources to actually make changes to our landing pages. For that, I would need to be able to communicate my ideas for testing to both our website testing team and our web development team.

Lucidchart’s wireframing functionality provided the perfect platform to brainstorm ideas for our existing landing pages and suggest ideas for new designs. After laying out all the possibilities in Lucidchart, I was able to work with the website and development teams to prioritize our efforts. We were able to create a clear plan and test the designs that had the biggest potential for impact.
3. Use Lucidchart to document your processes
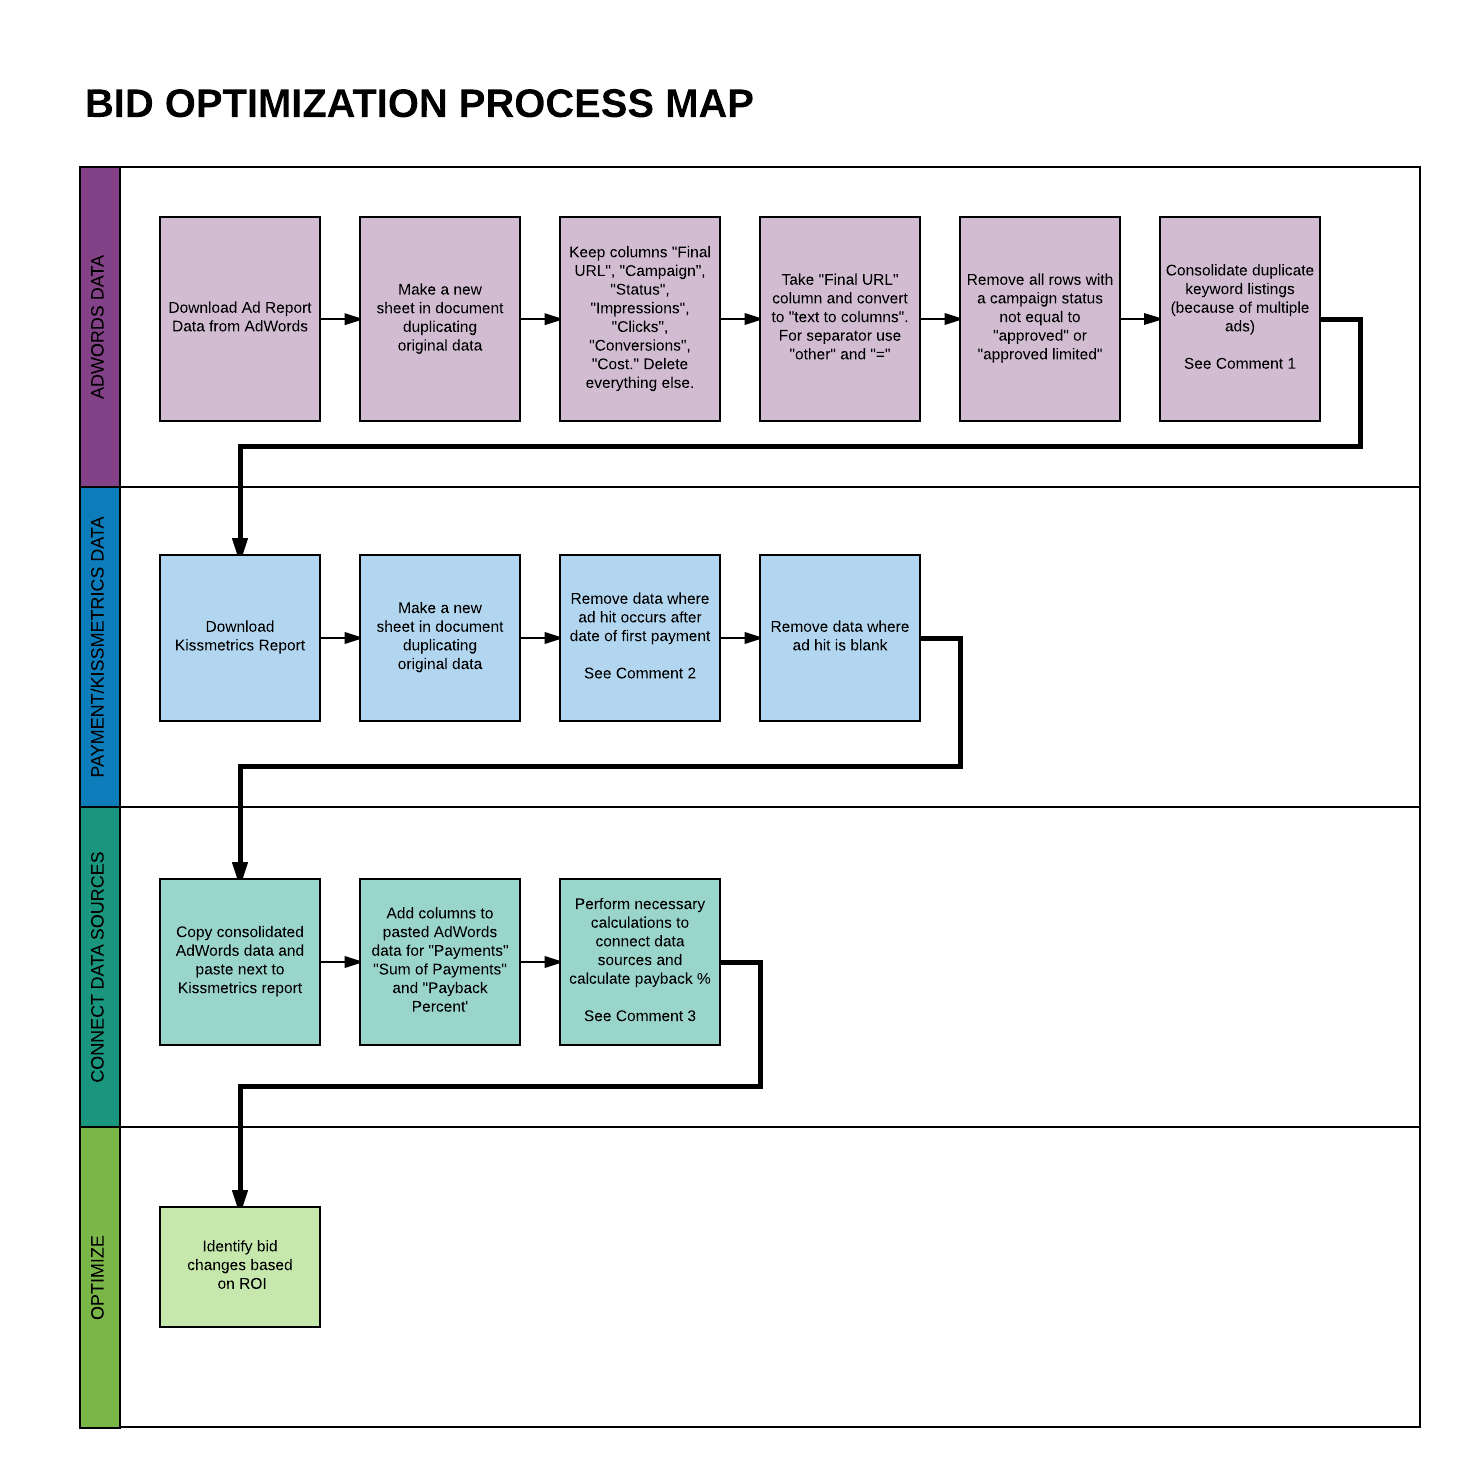
As I gained experience working on our PPC marketing team, my responsibilities increased and I was tasked with reporting on our account performance as well as exploring new avenues like remarketing. Many of these processes required running reports with specific parameters, aggregating data from multiple sources, and utilizing the resources of other teams in the company. It was critical for me to find a way to map these processes from start to finish and clearly communicate these processes with others.
Our PPC team created a master document of all of the key processes our team was involved in, including keyword research, bid optimization, reporting, and remarketing. By breaking down these processes step by step, we could identify areas where we could automate processes. We were able to link to external documents like our reporting templates in Excel, preventing redundant work. And we used the Lucidchart commenting feature to make notes of especially detailed steps, like noting the specific parameters for reports.

As we documented our processes visually, the diagrams proved to be far more effective way of communicating with external teams and management than a bulleted list in a word document. In these processes, we were able to show what pieces external teams were responsible for.
We were also able to easily share nuanced processes to management who are not as familiar with the day-to-day activities of our PPC team. Sharing these processes with management made it easy for us to evaluate our current processes and see how they aligned with the overall marketing teams goals. We could then use these documents to identify where process changes were necessary to drive better alignment.
Lucidchart is an invaluable tool for our PPC marketing team. In PPC marketing, it’s easy to get buried in lists of keywords, stacks of data, and complicated processes. And that’s where Lucidchart steps in, making sense of that dense information by organizing it visually. Creating visual representations of our advertising account structures, landing page designs, and key processes in Lucidchart has allowed us to make improvements to our own strategies as well as communicate those strategies with other team members. Try applying Lucidchart’s simple, visual approach to your PPC marketing and reap the results.
Sign up for your Lucidchart account, and watch the video below to learn how you can create your own diagrams to simplify your role.
About the author

Mallory Reese is a soon-to-be graduate of Brigham Young University with a B.S. in Marketing. She works as Digital Marketing Specialist focusing on our PPC marketing channels. She’s an avid road biker, skier, rock climber, podcast listener, and aspiring chef.
About Lucidchart
Lucidchart, a cloud-based intelligent diagramming application, is a core component of Lucid Software's Visual Collaboration Suite. This intuitive, cloud-based solution empowers teams to collaborate in real-time to build flowcharts, mockups, UML diagrams, customer journey maps, and more. Lucidchart propels teams forward to build the future faster. Lucid is proud to serve top businesses around the world, including customers such as Google, GE, and NBC Universal, and 99% of the Fortune 500. Lucid partners with industry leaders, including Google, Atlassian, and Microsoft. Since its founding, Lucid has received numerous awards for its products, business, and workplace culture. For more information, visit lucidchart.com.
Related articles
Master the 5-Step Email Marketing Funnel
A well-thought-out email marketing funnel and campaign have the power to turn browsers into shoppers and one-time fans into lifelong brand ambassadors.
How Lucidites Use Lucidchart: Diagrams for Marketing
At Lucid Software, we truly believe that our products will make work better for you and your colleagues. Why? Because we use them ourselves. See how Lucid Software employees (known as Lucidities) use Lucidchart and how our diagramming software could help employees in various roles at your company. First up: Lucidchart’s marketing team.
Bring your bright ideas to life.


By registering, you agree to our Terms of Service and you acknowledge that you have read and understand our Privacy Policy.