Reliability
Reliability ensures that your cloud systems can meet their operational threshold, workload demands, and can quickly recover from failures and downtime.
The key to setting up a reliable cloud environment is establishing KPIs that monitor and alert you when something in your architecture fails, immediately triggering the appropriate recovery response. It’s also important to monitor your system utilization, allocating resources based on demand so that your systems continue running at an optimal level. Well-maintained, up-to-date diagrams ensure teams are communicating accurate information to get systems back up and running if a failure were to occur.
Lucidscale makes it easy to validate that systems are built the way the architect designed it. Think about it like comparing what is in your head vs. reality. Visualizing your cloud architecture helps teams build well-architected environments by identifying and flagging elements that have been designed in unreliable ways, potentially avoiding outages or problems before they happen. Having a visual representation of the current and future states of your infrastructure gives you the necessary visibility into existing architecture, while also providing an opportunity to understand scenarios that lead to downtime and failures, ultimately informing future state changes and iterations.
Operational excellence
This pillar aims to drive business value through a combination of continuous improvement, system monitoring, and processes.
One of the key principles of operational excellence is to plan your architecture accordingly and build in space for your network to grow and make adjustments as your organization’s vision and goals change.
To maintain operational excellence, stay agile and make small, continuous improvements to your infrastructure. With Lucidchart Cloud Insights, you can convert your data-backed "live" diagram into an editable version that allows you to manually make changes to the diagram, helping you plan and visualize future deployments. With both the current and future state of your cloud infrastructure, share the diagrams via Slack, @mention other users, or use Presentation Mode in meetings to get input from others on the proposed changes.
Traditional architecture diagrams are difficult to digest. That's why it's important to have a few different versions of your diagram customized to specific scenarios , such as:
-
Planning architecture designs: Communicate with engineers, architects, and coders to ensure that all pieces of information are accurate to avoid mistakes during implementation so you can avoid costly downtime.
-
Presenting to non-technical stakeholders and leadership: Show specific parts of your diagram in Presentation Mode as a simple overview of the architecture or network to any stakeholder, so you can get the buy-in you need.
-
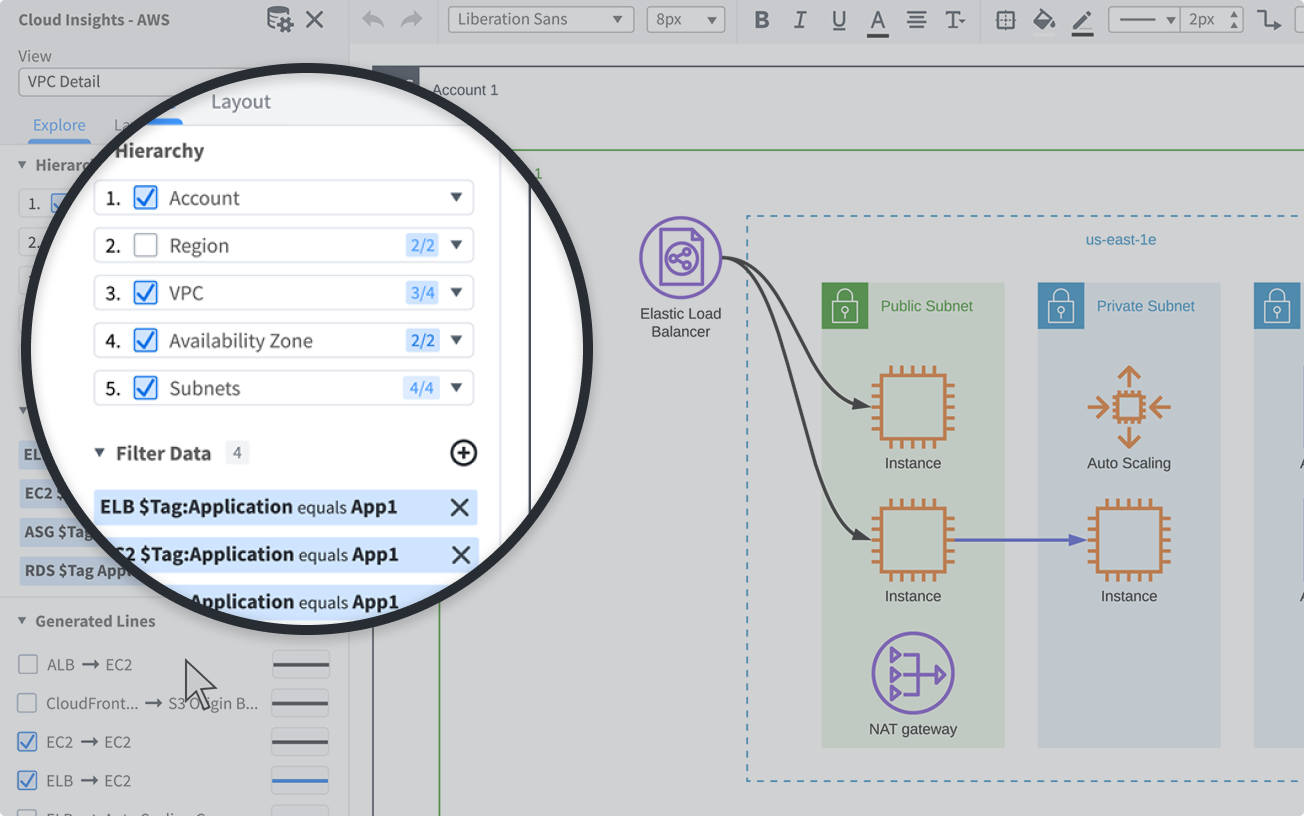
Drill into the right information: Customize what you see in Lucidscale through filters, lines, and additional layout changes. Check out some of our standard views to see an overview of accounts, regions, VPCs, VPC peering connections, and more, or create your own custom views to troubleshoot specific parts of your architecture
-
Communicate clearly with your teams: Annotate documentation and leave specific notes and comments to help clarify information about the infrastructure. Tags help draw attention to a particular part of the diagram so problems can be resolved faster maintaining excellence.

Performance efficiency
Ensure your system functions at peak performance and can adapt to changes in workload to meet the demands of your organization.
Consider the many different elements that impact performance, such as components existing in different locations, latency, load, instance size, and monitoring (just to name a few). When staring at several thousand lines of code, it can be challenging to analyze or anticipate cloud performance.
For example, you may have systems located around the world to increase performance—or if servers in one region go down, your company is still operational and can avoid costly downtime and service disruption.
Part of this performance strategy likely requires your organization to examine horizontal or vertical scaling structures.
Lucidscale helps you better understand how all the components of your architecture work together (or lack thereof). Visualize your auto-scaling groups, compute instance sizes, availability zones, relationships between resources, and all. Then, as you continue to experiment to find the right set up for your organization, map out different options, providing teams and stakeholders with accurate and up-to-date cloud visuals in the context of your metadata to facilitate the right discussions to make more informed decisions to improve performance.
Security
Finally, security is the last piece of the CROPS acronym. Your architecture needs to be built to protect the confidentiality and integrity of your information, systems, and assets.
Your company is responsible for protecting all sensitive data. A strong approach to security ensures you maintain compliance with all regulations and cloud security standards such as GDPR, SOC 2, PCI, and HIPAA, in case of an audit.
First, plan ahead. Figure out how to implement security even before you’ve architected the system. It will be harder to patch, approach, and implement security after the system is architected and deployed.
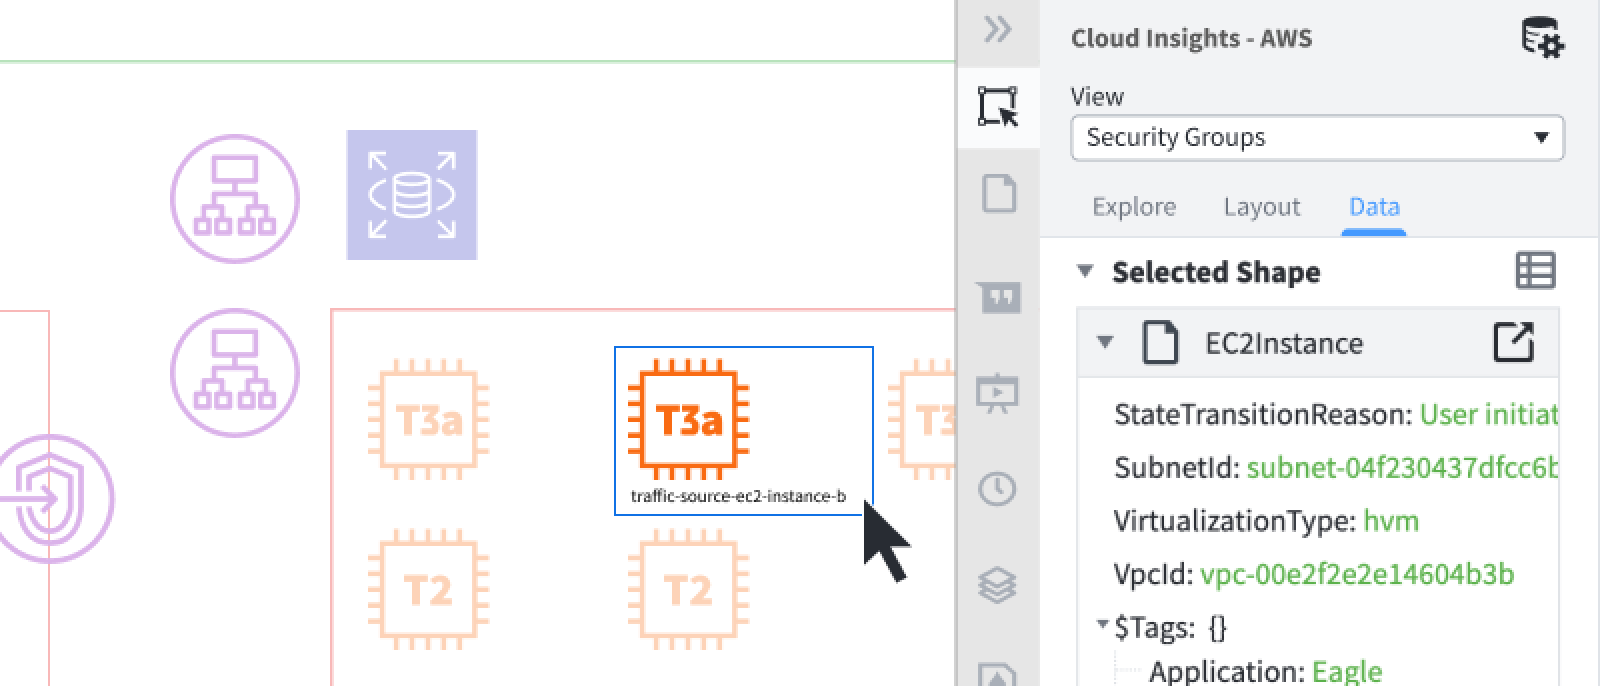
Once it’s ready to go, visualize your cloud governance data with Lucidscale. Stay on top of your cloud security, cloud compliance, and internal best practices by visualizing and overlaying your metadata, such as instance name, security groups, IP address, and more, in the context of your diagram.
For example, create categories based on sensitivity levels and mechanisms such as encryption, tokenization, and access control to safeguard your data and reduce or eliminate the possibility for human error.
Use cloud infrastructure diagrams and documentation to visualize where your data is stored and transmitted. These visuals help your organization stay on top of compliance audit documentation to maintain and prove security compliance—you can even use your Lucidscale architecture diagrams as security and compliance evidence during reviews or audits.
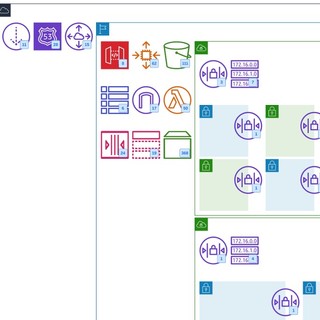
Lucidscale has a standard security group view that organizes resources by the security group they belong to. It also features lines to show how the security groups are connected. This can help security leads quickly view VPC peering connections to ensure they are set up correctly, and if not, they can easily make changes by quickly seeing where the change needs to be made, rather than sifting through lines of code.
Set up conditional formatting rules to easily identify security problems, such as unencrypted databases, rather than spending hours digging around in the cloud consoles and portals to uncover the issue. Comment or @mention users so your team can get to solving potential risks and threats faster.
Visualize CROPS with Lucidscale
CROPS makes it possible to build a well-architected cloud framework and continue to monitor and iterate upon deployments. Lucidscale adds a visual component to help you manage the complexity of all of these moving parts without compromising collaboration, speed, or agility. Visualizing all of these cloud pieces (rather than relying on text-heavy documentation) helps your teams gain clarity in a complex system and communicate what is needed to build and maintain a strong cloud environment. By following the CROPS framework and using Lucidscale, you can help everybody understand their roles and areas of responsibility within the cloud, making it easier to plan for—and pursue—future growth.