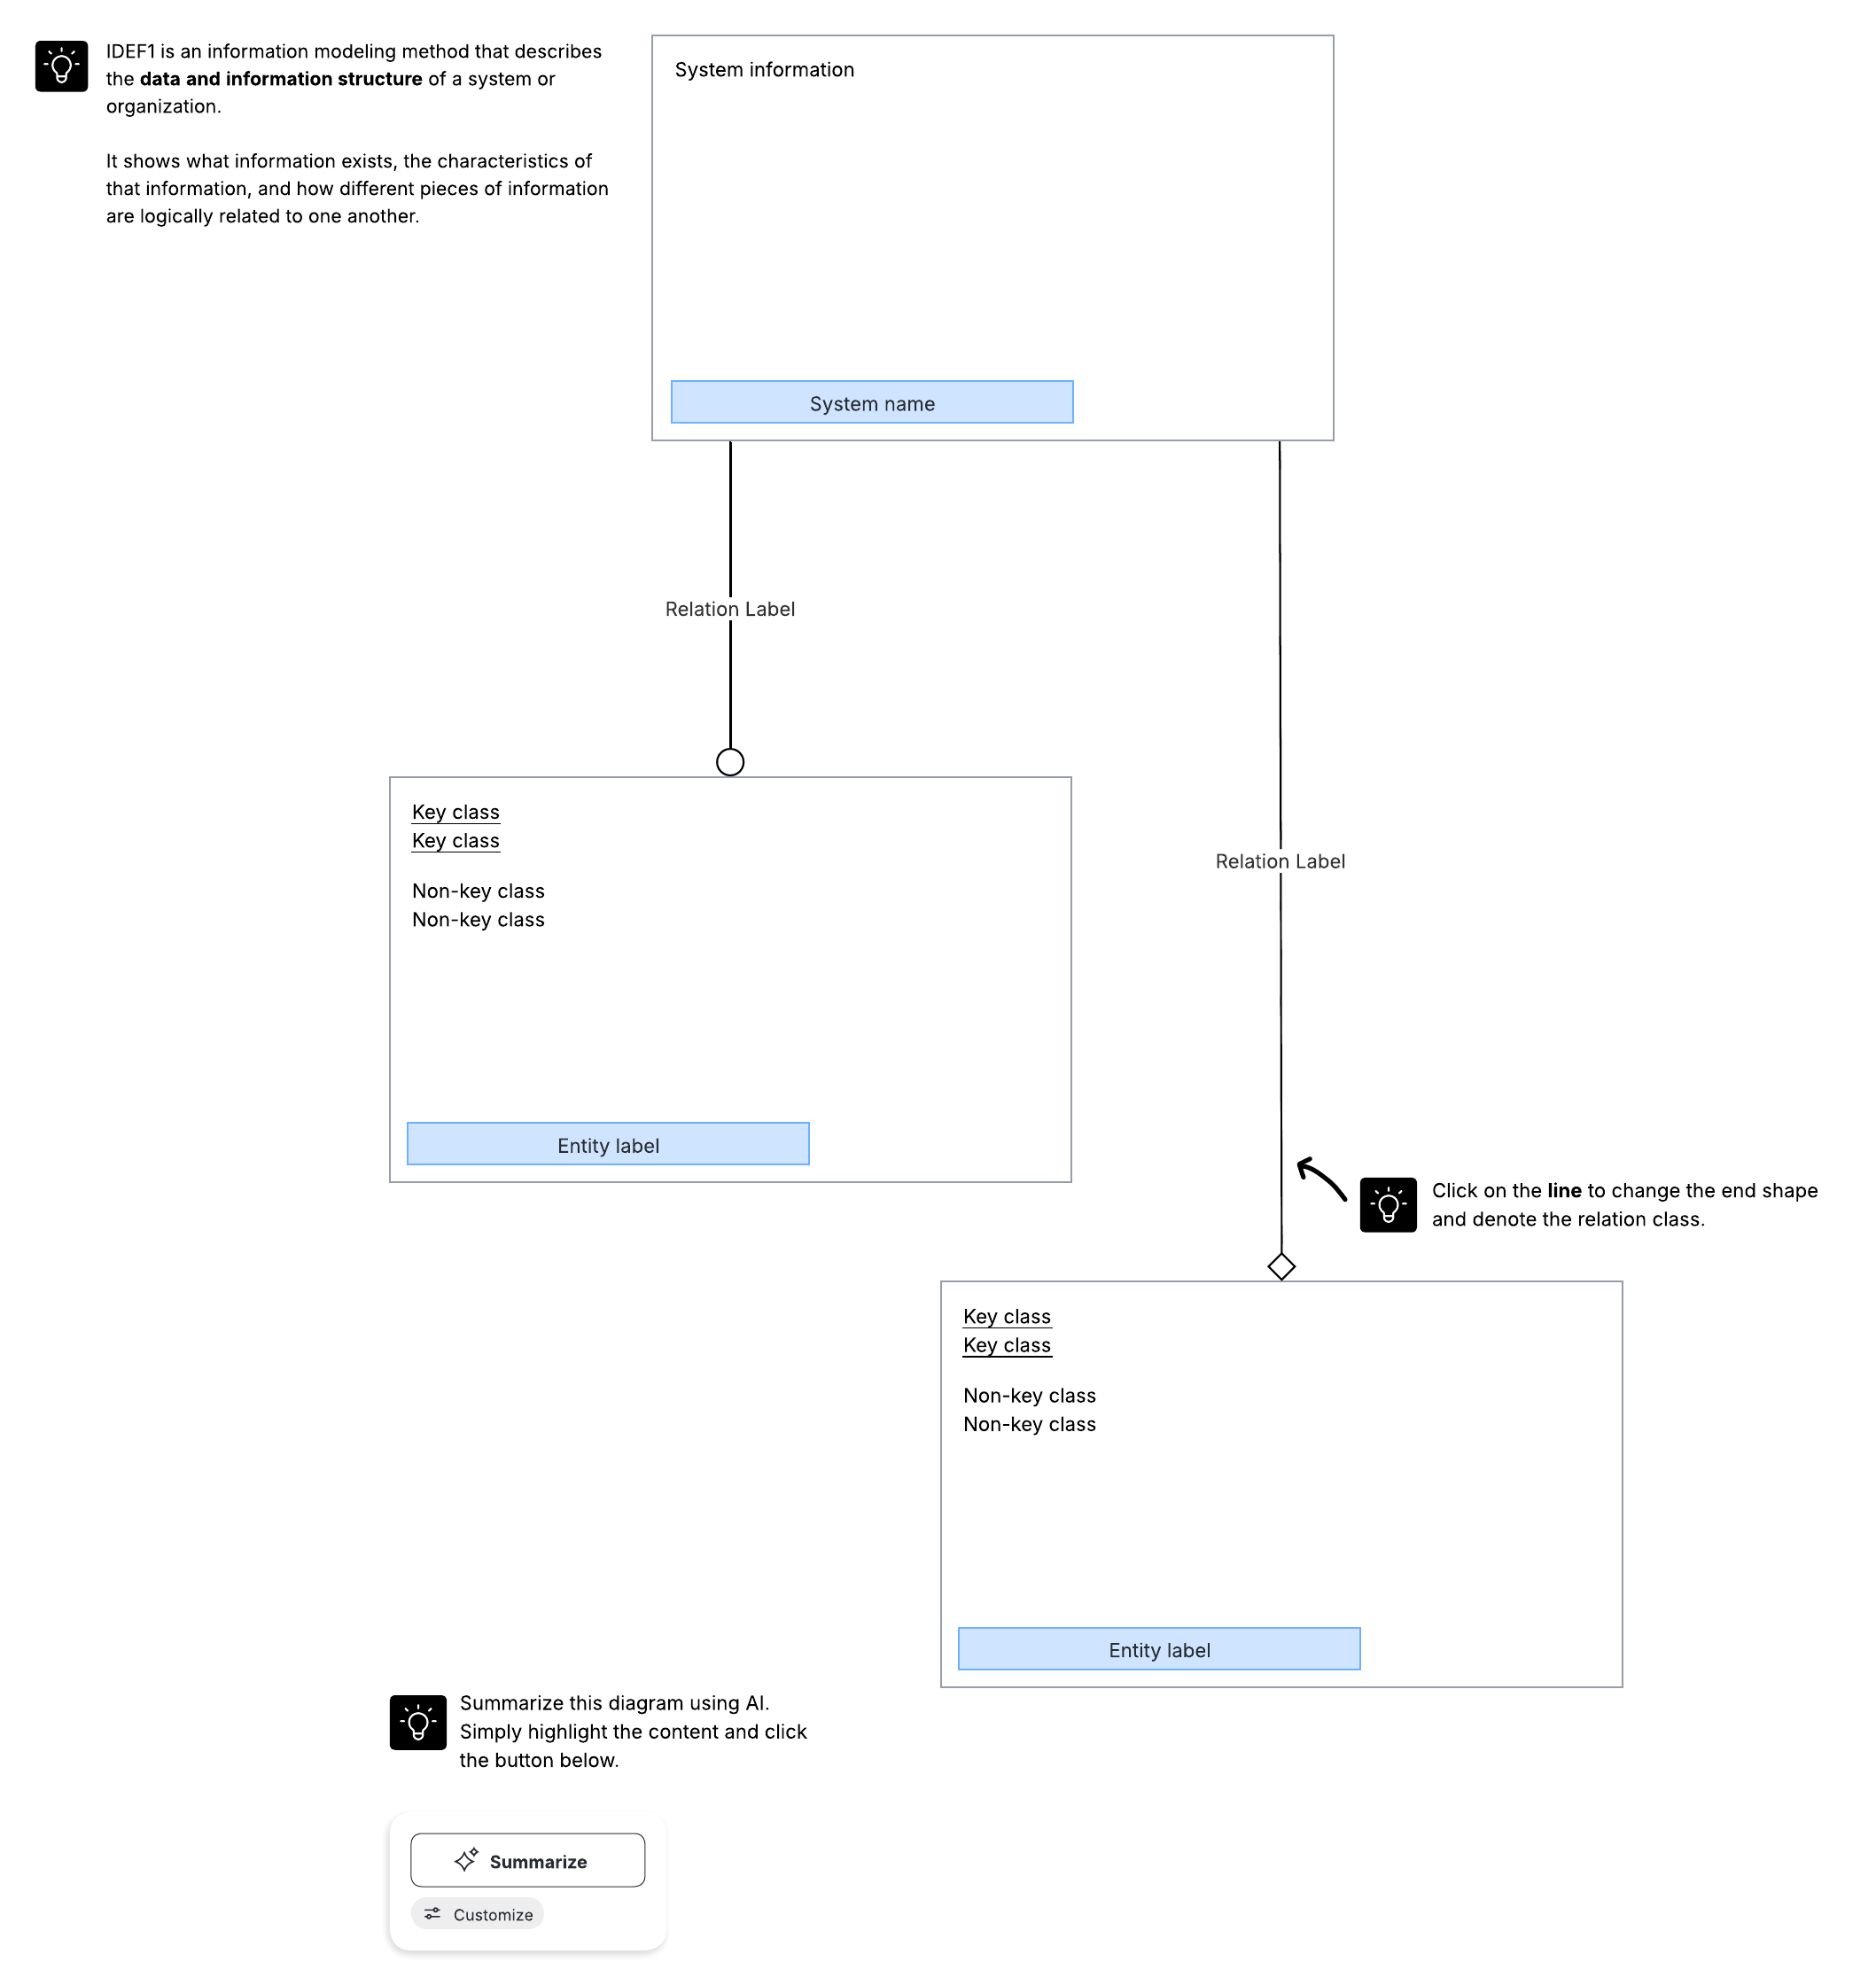
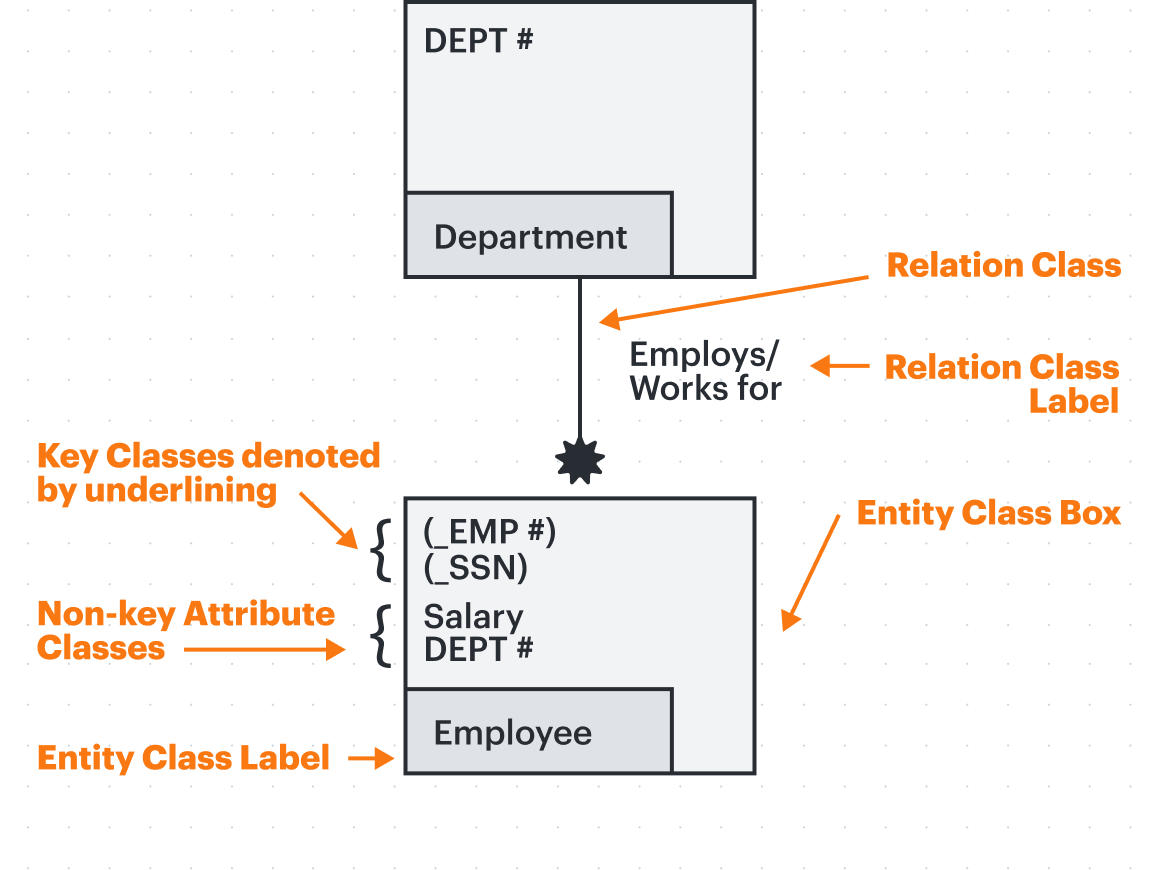
IDEF1: This type of diagram is used for data modeling. It visually defines a system's entities, attributes, and the relationships between them. It helps teams proactively design a structured database that maintains data integrity.
The IDEF family of methods
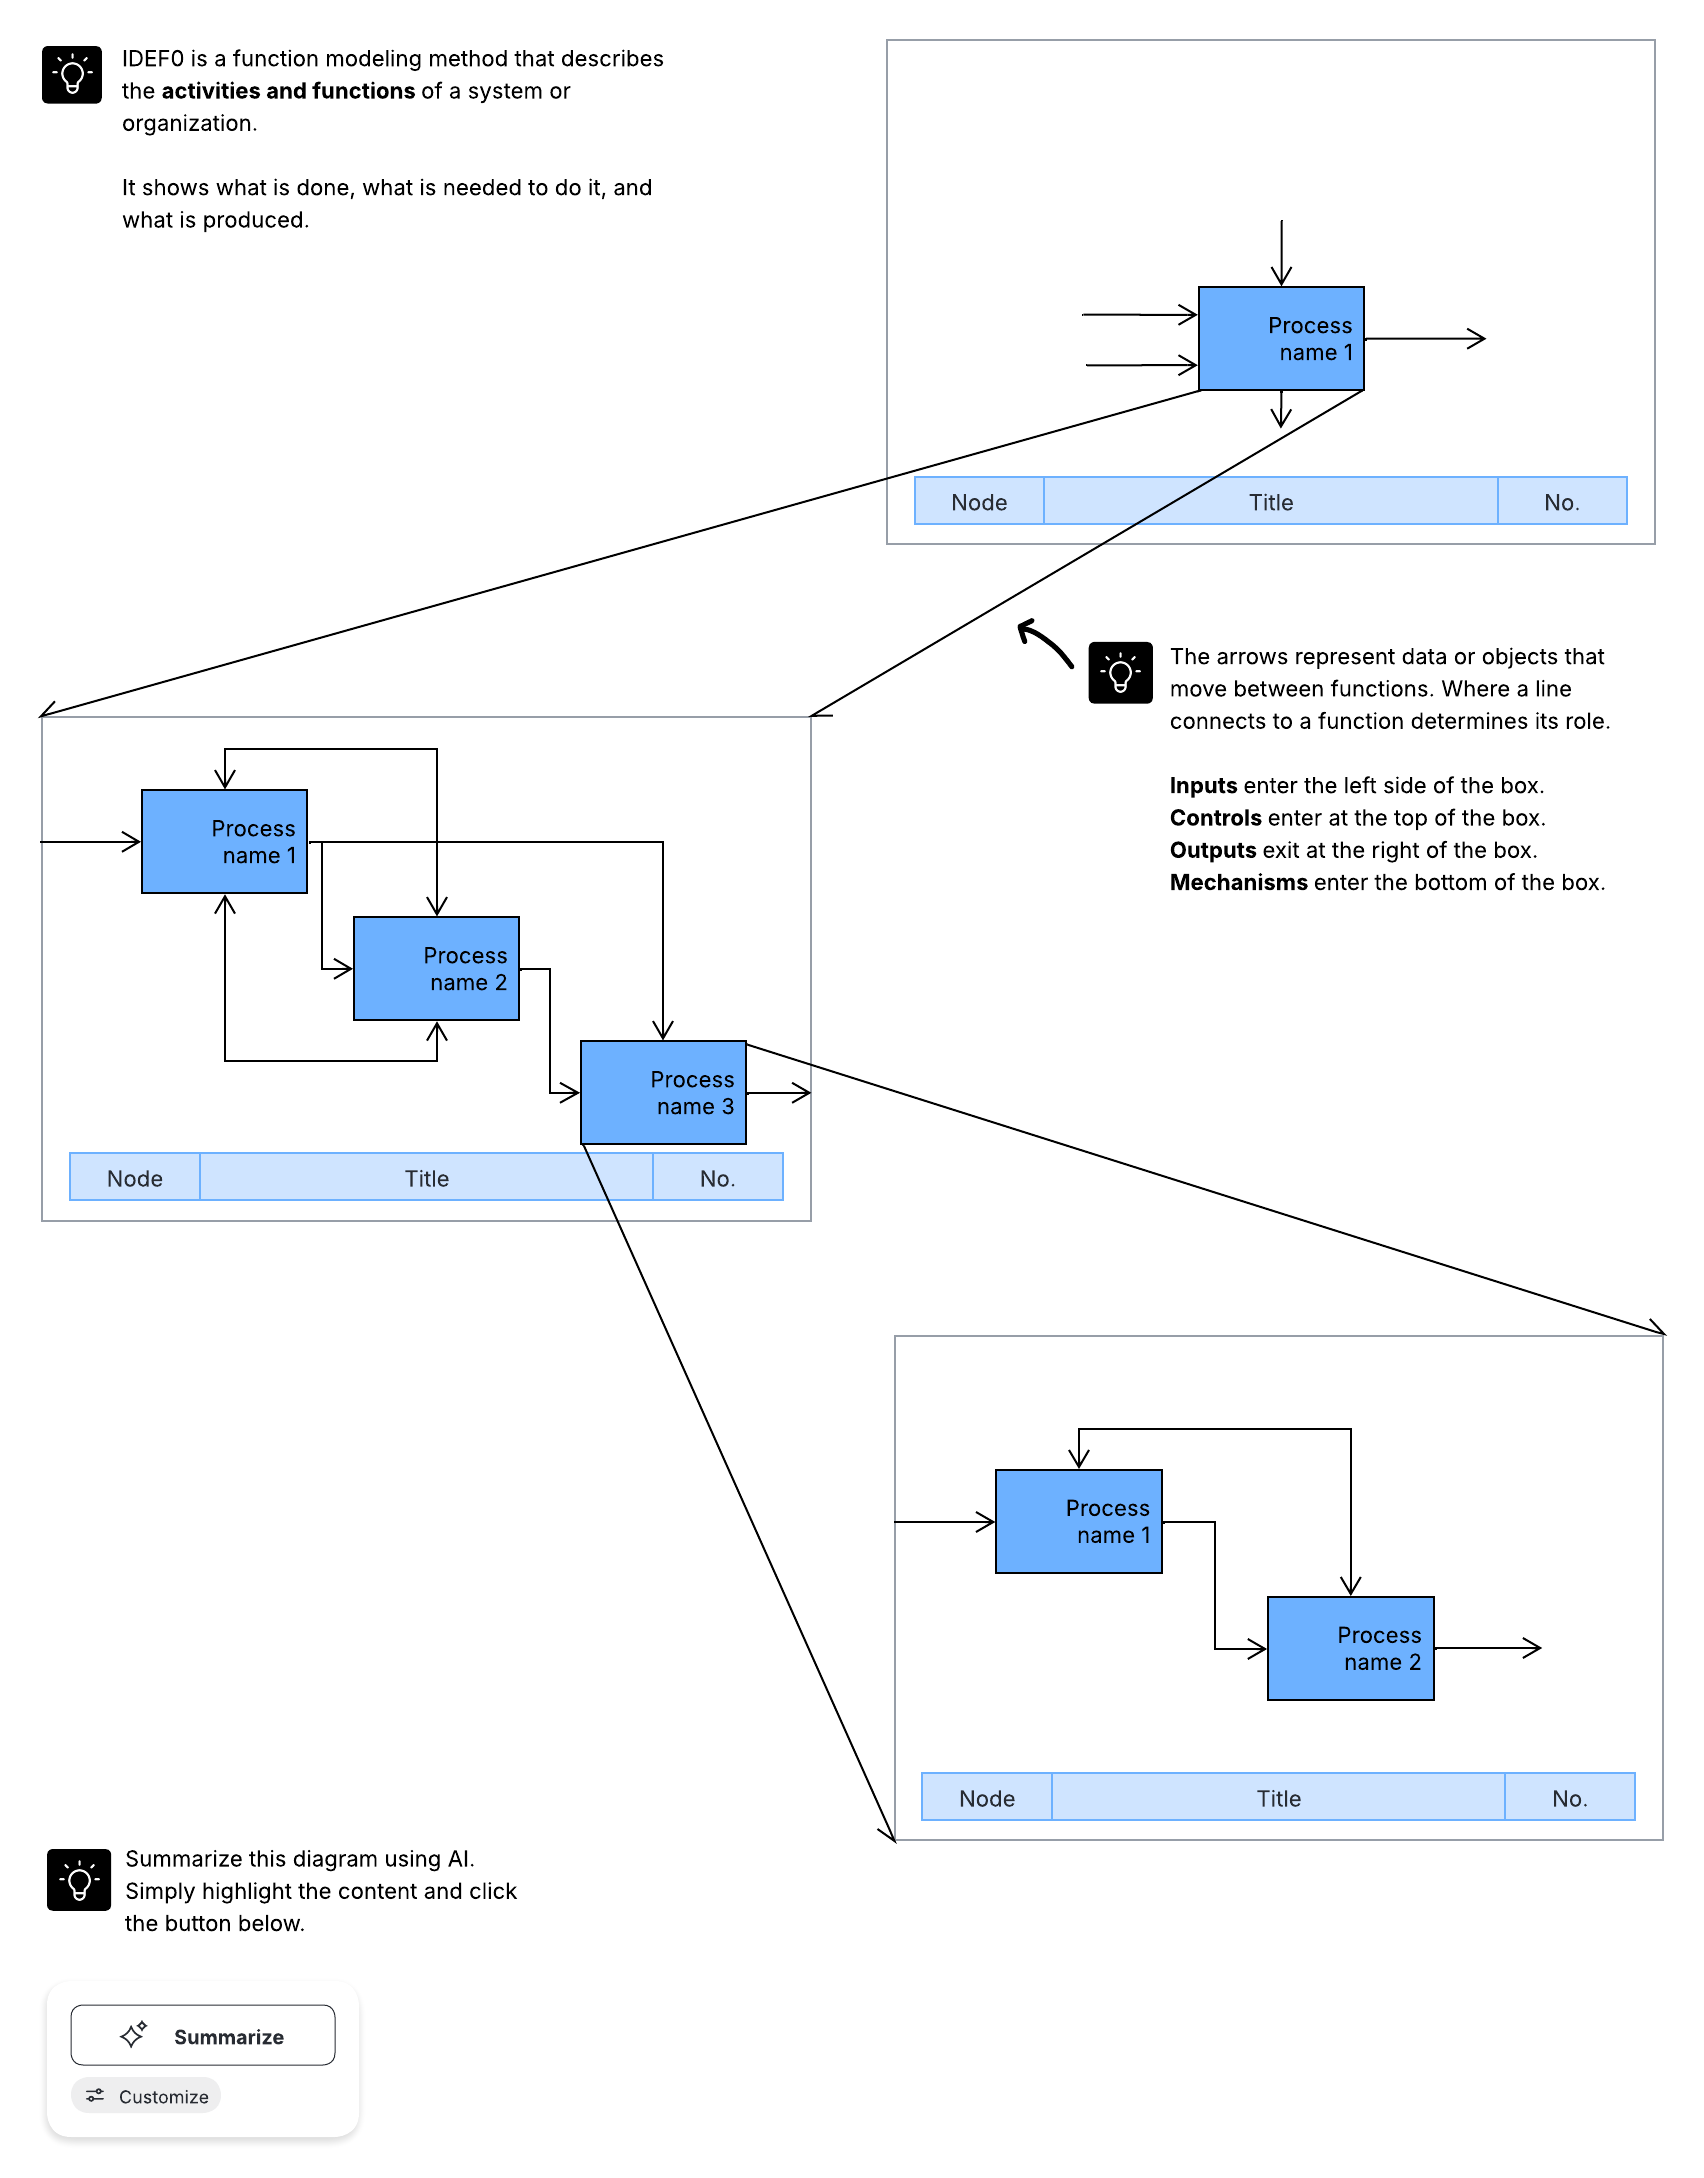
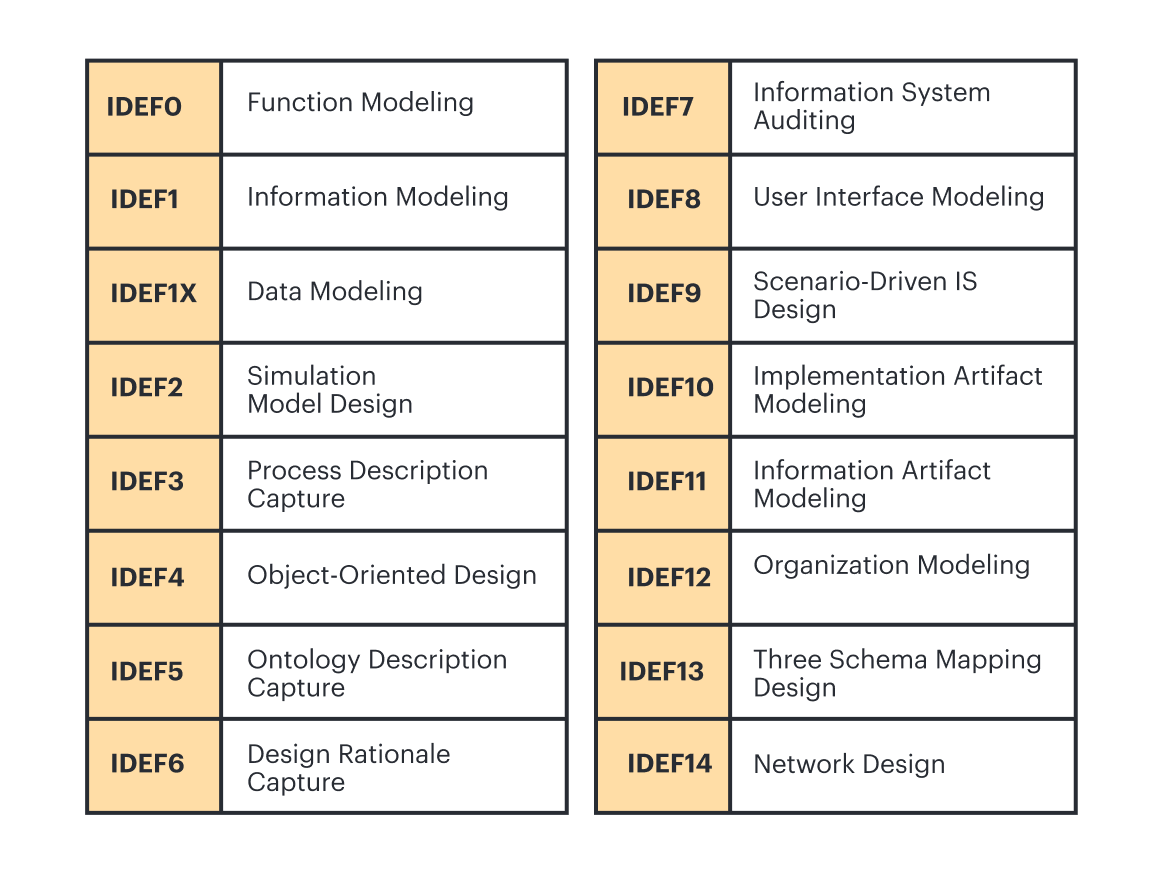
Beyond the two IDEF models we’ve mentioned, IDEF0 and IDEF1, an entire family of methods is used for mapping, analyzing, and designing systems and processes. Each method addresses different aspects of a system. Take a look at the various methods below:
About Lucidchart
Lucidchart, a cloud-based intelligent diagramming application, is a core component of Lucid Software's Visual Collaboration Suite. This intuitive, cloud-based solution empowers teams to collaborate in real-time to build flowcharts, mockups, UML diagrams, customer journey maps, and more. Lucidchart propels teams forward to build the future faster. Lucid is proud to serve top businesses around the world, including customers such as Google, GE, and NBC Universal, and 99% of the Fortune 500. Lucid partners with industry leaders, including Google, Atlassian, and Microsoft. Since its founding, Lucid has received numerous awards for its products, business, and workplace culture. For more information, visit lucidchart.com.
Related articles
The 411 on Business Process Modeling
Business process modeling helps companies document and assess their business processes and workflows so they can adapt and improve with precision and effectiveness. Learn how BPM can support your company’s initiatives for long-term growth and success.
Diagramming basics: A BPMN tutorial
Learning to diagram with BPMN will increase your professional value and facilitate communication. Check out this easy BPMN tutorial to get started.
Create diagrams faster using automation features in Lucidchart
Working visually shouldn’t mean more work for you. Find out how to automate your diagramming with Lucidchart to help your teams do more faster.
Bring your bright ideas to life.


By registering, you agree to our Terms of Service and you acknowledge that you have read and understand our Privacy Policy.