sales kpi

What’s in your pipeline? The 13 most important KPIs for sales success

Lucid Content

Reading time: about 7 min

Topics:

  • Sales

Do you know how your sales team is performing? As a sales leader, tracking and measuring performance is key to driving (and proving) success.

But not all metrics are created equal. You need the right key performance indicators (KPIs) to help you achieve your goals.

So what KPIs should you track?

It’s an important question. What you track is what your team will focus on. Make sure they focus on the most effective sales activities.

Key performance indicators, or KPIs, are leading indicators or signposts that help sales reps and their leaders gauge how effective their efforts are. Sales KPIs are the metrics by which you will evaluate your team’s performance against your sales and organizational goals.

By measuring the right sales KPIs, you can optimize your sales process and ensure you and your team are prioritizing the right activities for greatest success.

top sales KPIs
Top Sales KPIs (Click on image to modify online)

Sales managers: Tracking sales funnel performance

One of the best ways to drive sales performance is to track the quality of your leads through each stage of your sales funnel. This process is especially important for sales leaders who need a high-level understanding of the team’s sales process.

Detailed sales process
Sales Process Template (Click on image to view in Lucidchart)

Measuring performance metrics at each stage of the sales funnel helps you pinpoint blocks in the pipeline and focus on the stages and activities that are most effective.

Conversion rates

Understanding your leads’ conversion rates is critical to understanding how your sales funnel is performing and which stages and activities have the highest return on investment. For a basic overview of your sales funnel performance, you should track the following conversion metrics:

Visitor-to-lead conversion rate

This is the ratio of the number of visitors (traffic) to your site and how many of them become leads.

You may have to further define what a lead is for your team, but generally, a lead is a person or business who has shown interest in your product or service by taking a specific action (e.g., filling out a contact form, subscribing to your email list, or downloading marketing content).

This KPI is a good way to measure your website’s conversion rate optimization (in other words, how well your site attracts visitors and entices them to take action).

Lead-to-MQL conversion rate

Once you have a list of leads, the marketing team evaluates each prospect to determine which ones are most likely to become customers. The leads who make the cut are considered qualified and passed on to the sales team for further nurturing.

The lead-to-MQL conversion rate is the percentage of leads who meet the marketing team’s basic qualifications.

It can tell you how well your business website attracts the right audience. If you have a subpar conversion rate, you may need to work with marketing to reevaluate your target buyer personas and update the copy and content offerings to match.

MQL-to-SQL conversion rate

This is the percentage of leads from marketing that become sales qualified. Sales qualified leads (SQLs) are those marketing leads who are rated most likely to convert to customers.

This is an important metric because it provides insights into how well the marketing and sales team are aligned. If the conversion rate is low, that’s an opportunity to communicate with marketing to better define your ideal customers and map a strategy to move them through the funnel.

Opportunity-to-customer conversion rate

Finally, you’ll want to measure the percentage of qualified leads (or opportunities) that ultimately convert into customers.

Together with the other conversion metrics, you can evaluate how and when leads are converting and take steps to improve each step of the process.

Sales cycle length

The sales cycle length is the average amount of time between the first touch with a prospect to closing the deal. This is an important metric to track because it can tell you how efficient your sales process is and help you forecast sales more accurately.

For instance, if you know your average sales cycle length, you can estimate the number of won deals you’ll have in a given time period based on how many leads are currently in your pipeline.

However, because sales cycle length can vary depending on the type or source of lead (e.g., outbound vs. inbound), you may want to segment this metric for more pinpointed insights.  

sales pipeline management template
Sales Pipeline (Click on image to modify online)

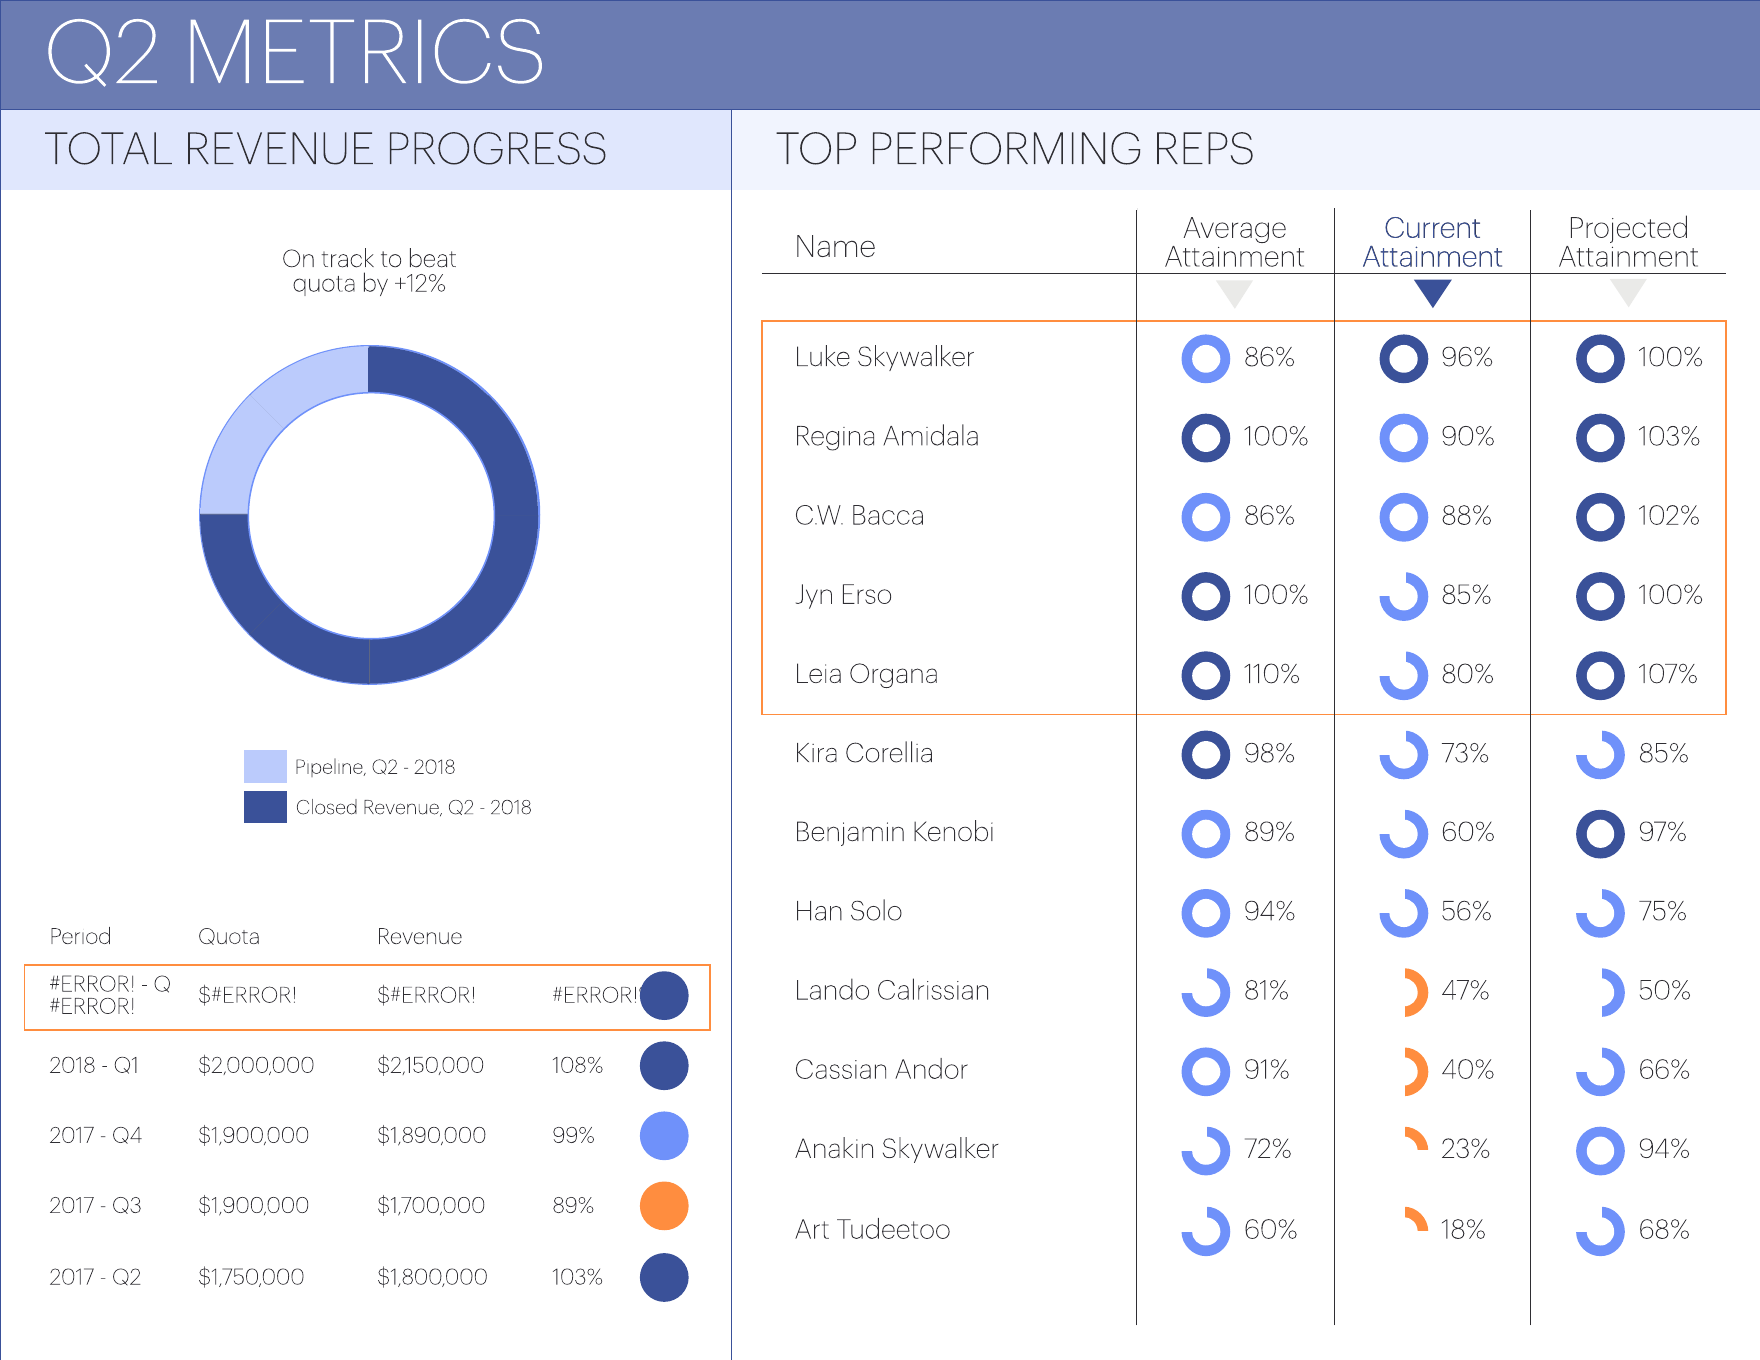
Number of deals in your pipeline

As a sales manager, you need to know how many active deals are currently in the sales pipeline. This metric will help you gauge how healthy your pipeline is (e.g., do you have enough leads to meet your sales quota?) and more accurately forecast sales.

Pipeline value

Similar to the number of deals, you’ll also want to track the total value of your pipeline, or the total value of all the qualified leads in the pipeline).

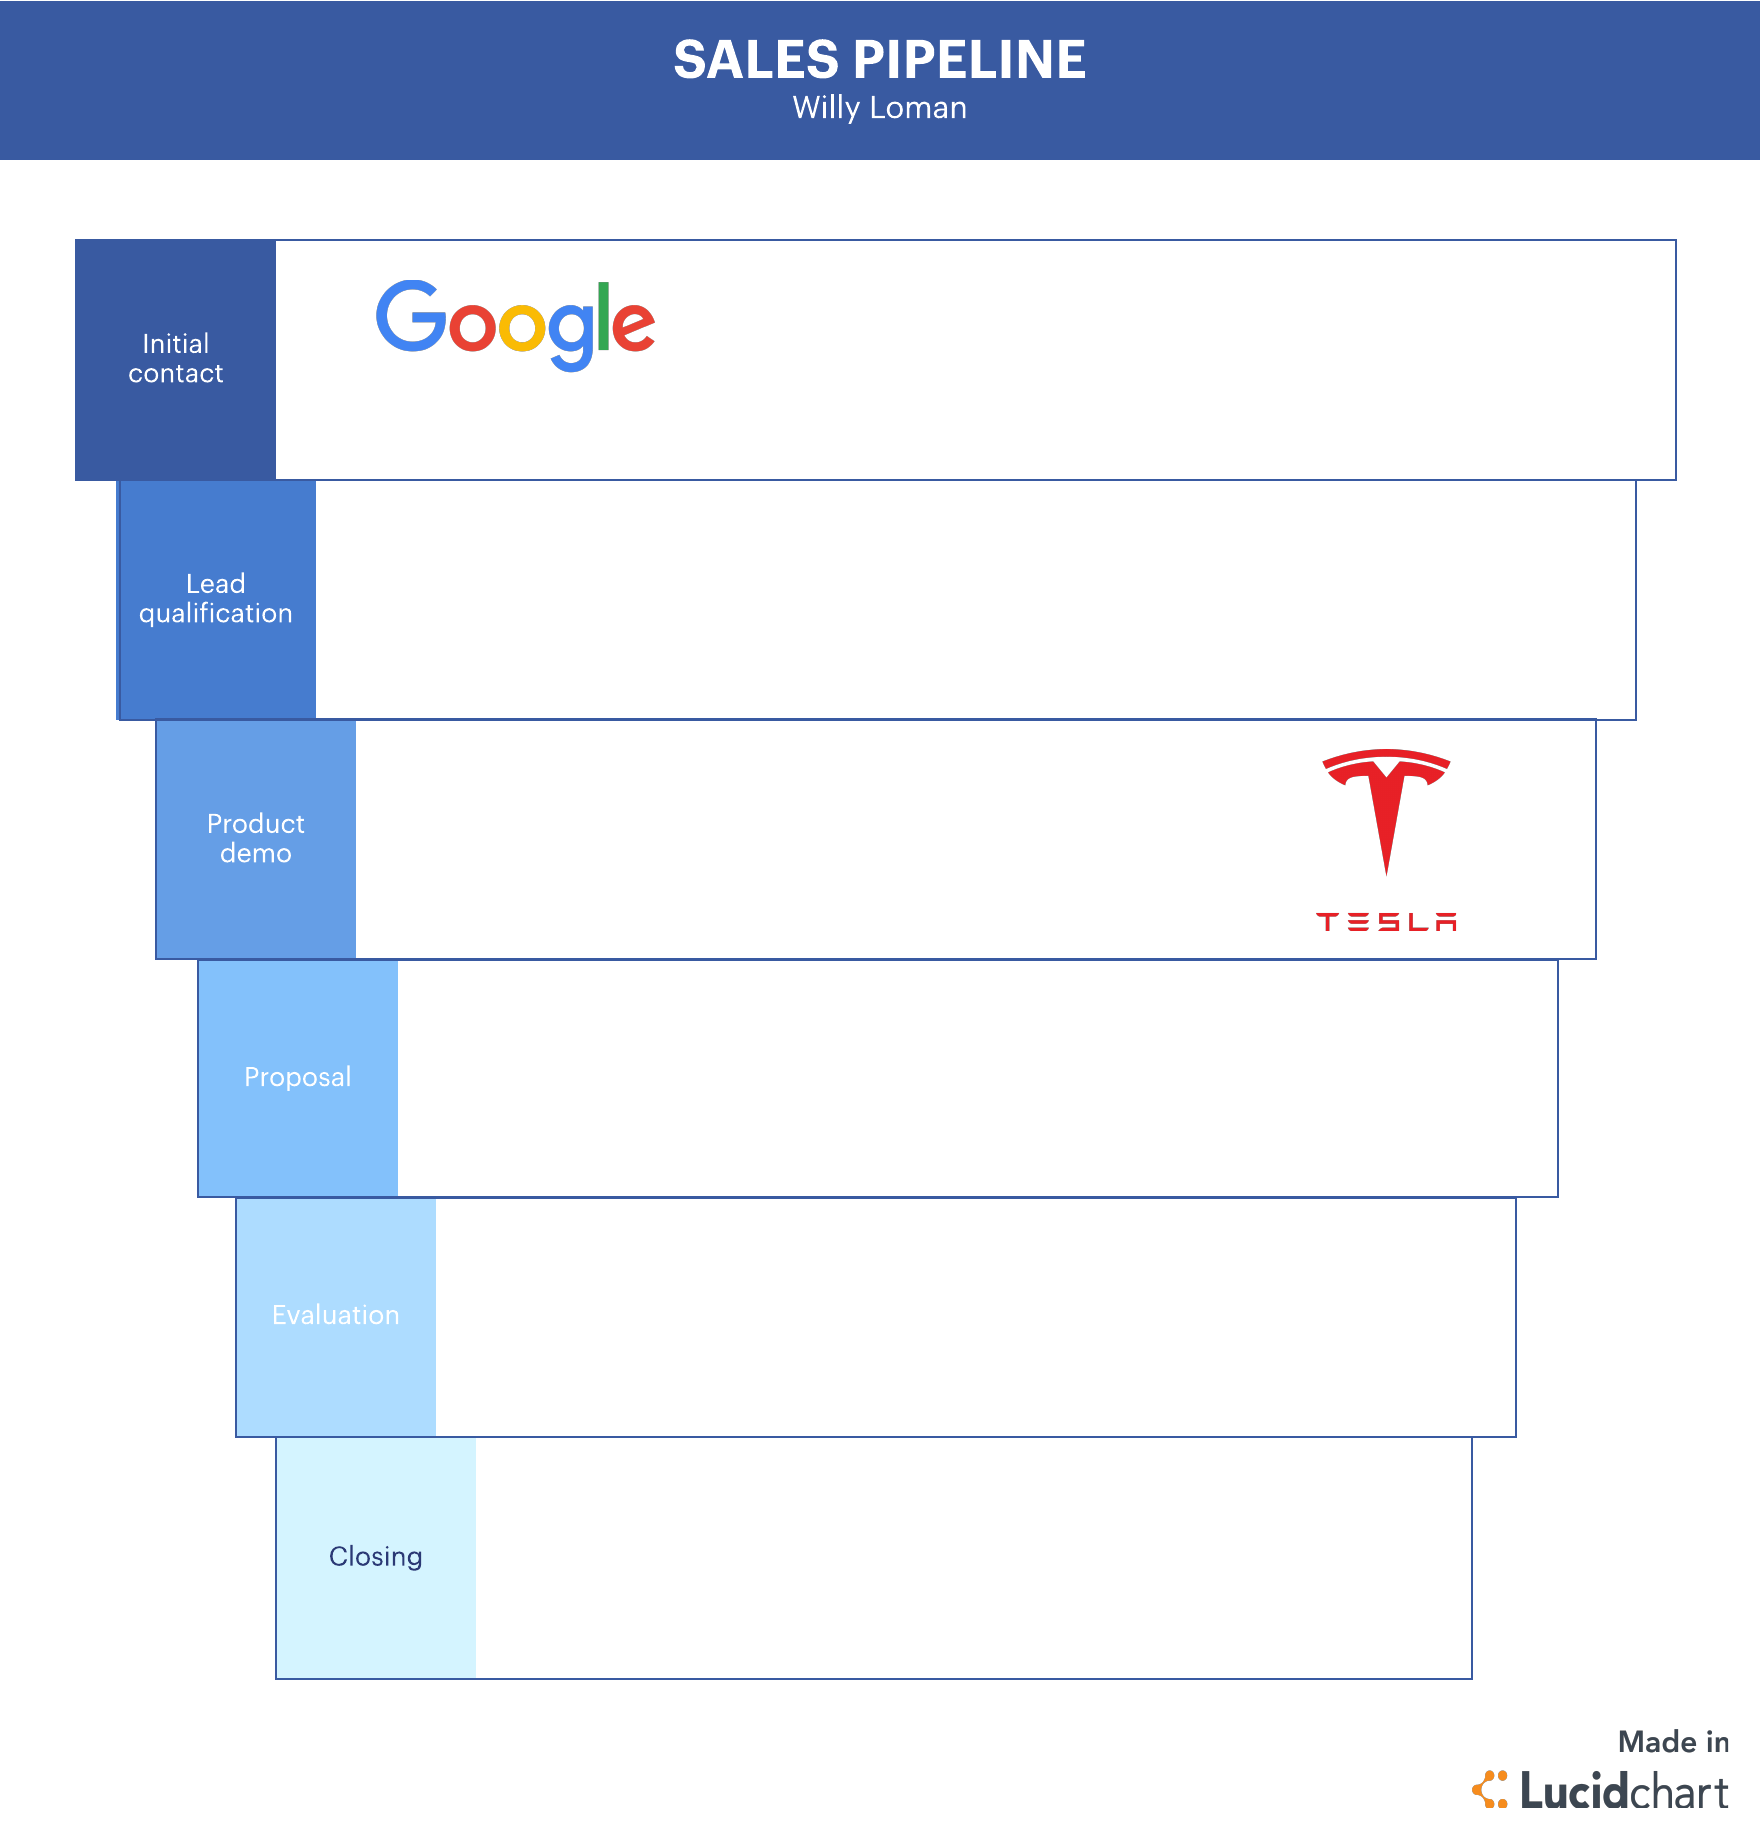
In order to accelerate sales, you need to grow your pipeline value and number of deals while shortening the sales cycle. By tracking these metrics, along with your conversion rates, you can optimize your pipeline and strategically manage your sales team activities.  

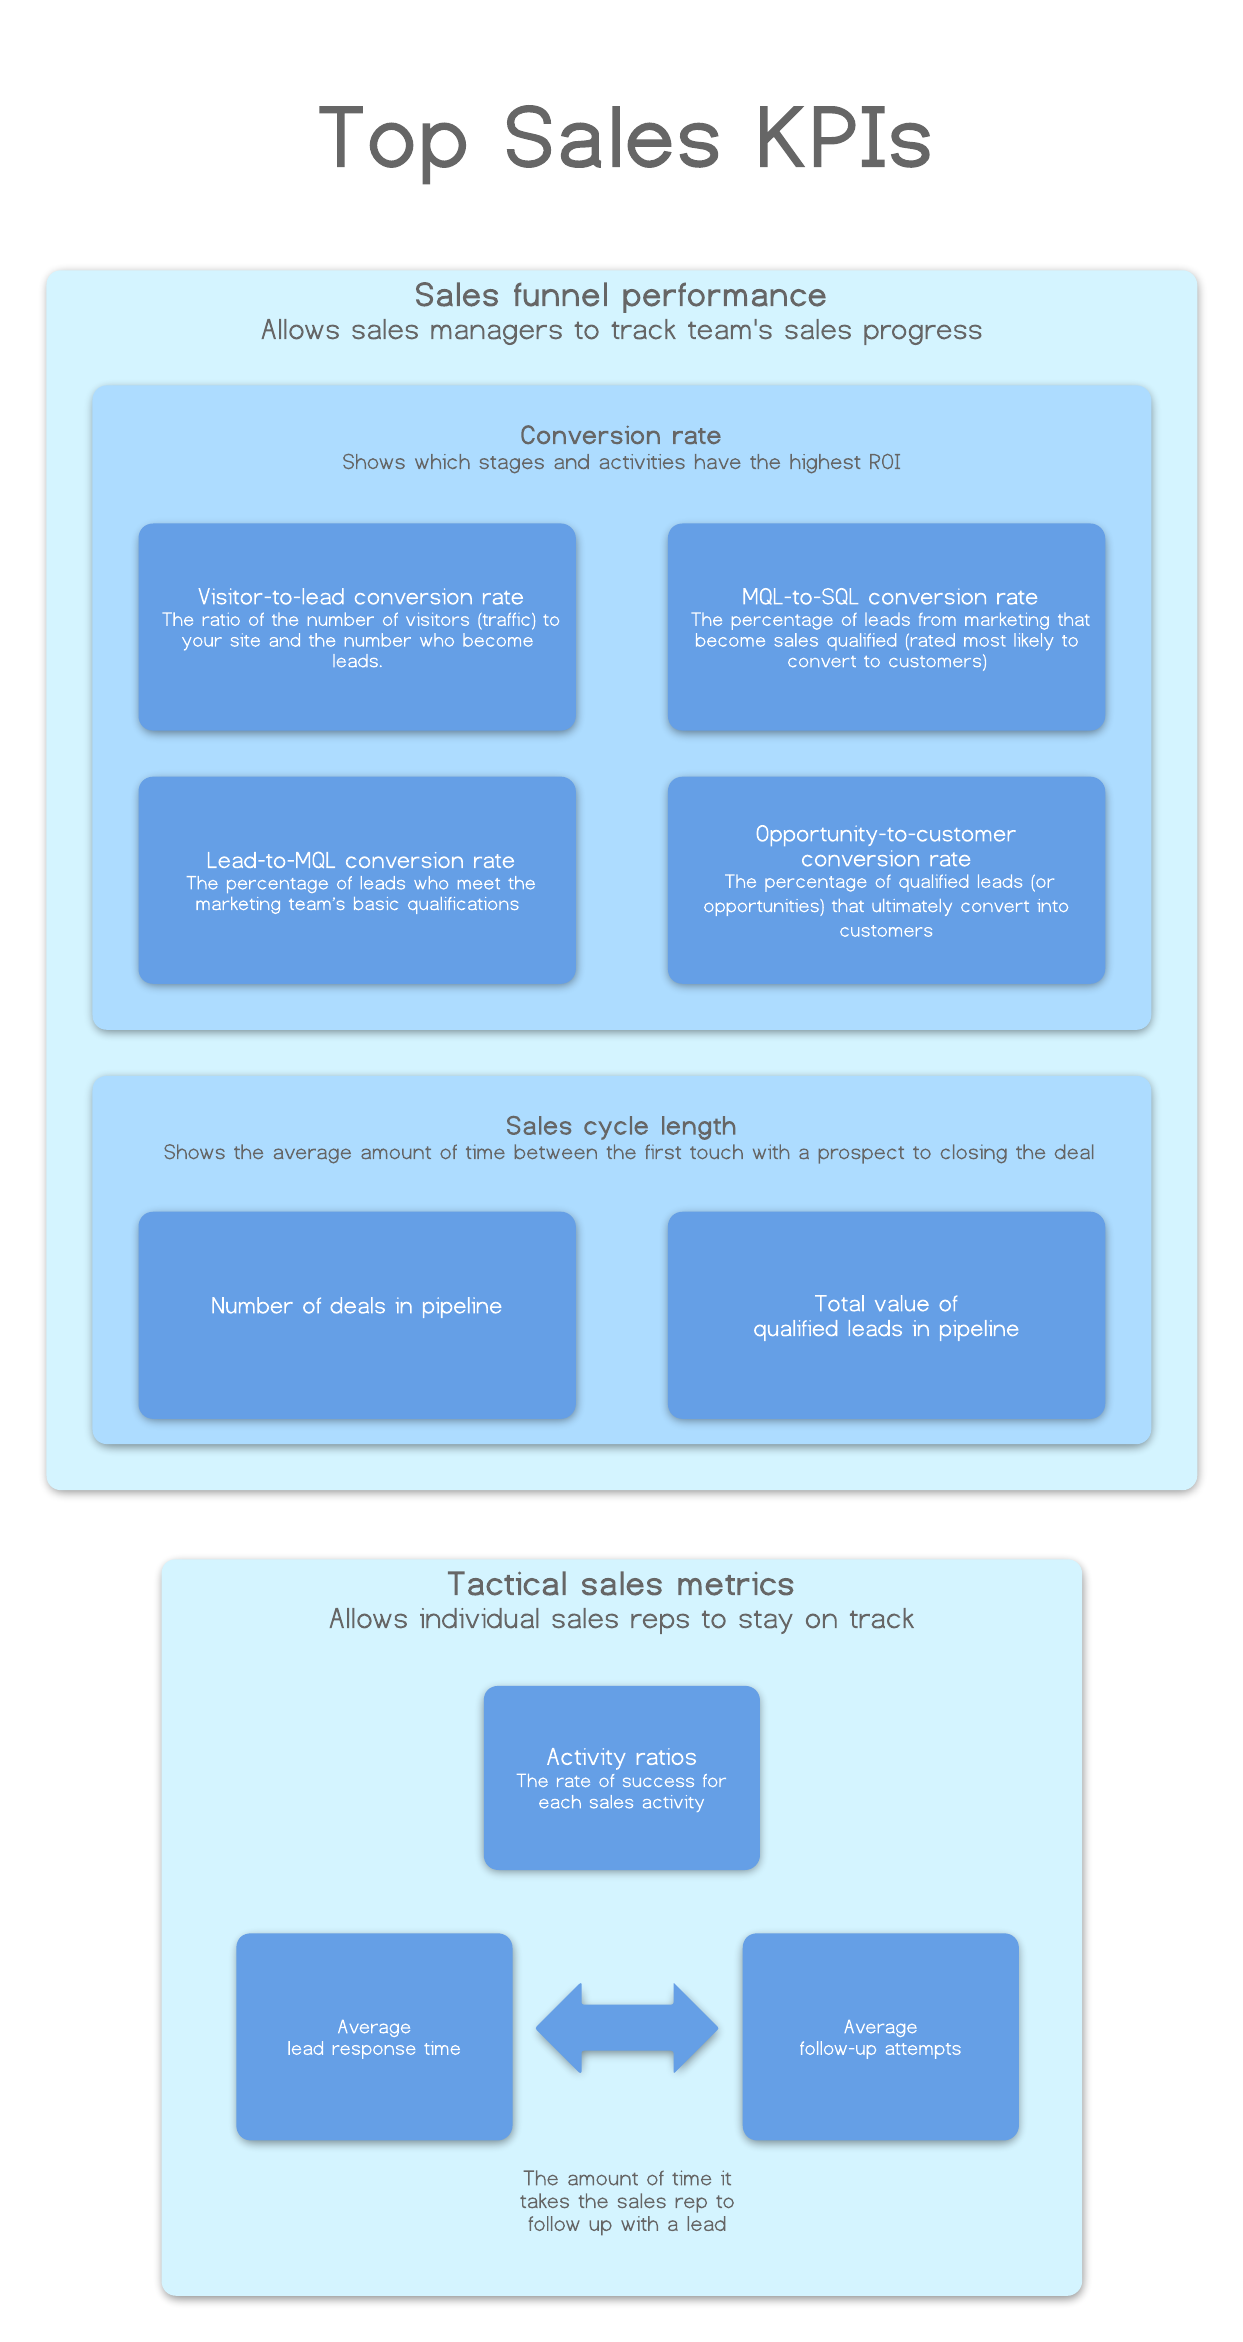
Sales reps: Tracking tactical sales metrics

A high-level, holistic view of the sales team’s performance is necessary for managers to nurture a healthy pipeline.

But teams shouldn’t ignore smaller, tactical sales KPIs.

These are the activities that show daily individual performance on the ground. Tactical sales activities include phone calls, emails, follow-ups, etc. These sales KPIs help sales reps stay on track and focus on the right tasks at the right time.

Activity ratios

One of the best ways to drive sales and optimize your sales efforts is to measure activity ratios, which means tracking each sales activity and measuring their rate of success.

For example, you could measure the following activity ratios:

  • Dials to connected calls
  • Connected calls to scheduled events
  • Scheduled events to SQLs

In other words, track how many phone calls you make, how many of those dials connected to a lead, how many connections resulted in a scheduled event (e.g., a meeting), and how many events resulted in a sales qualified lead.

One sales development rep used Lucidchart to track these activity ratios and nearly doubled his numbers in one quarter. By simply measuring his activity day to day, he was able to pinpoint which tasks to focus on to hit quotas and stay on track.

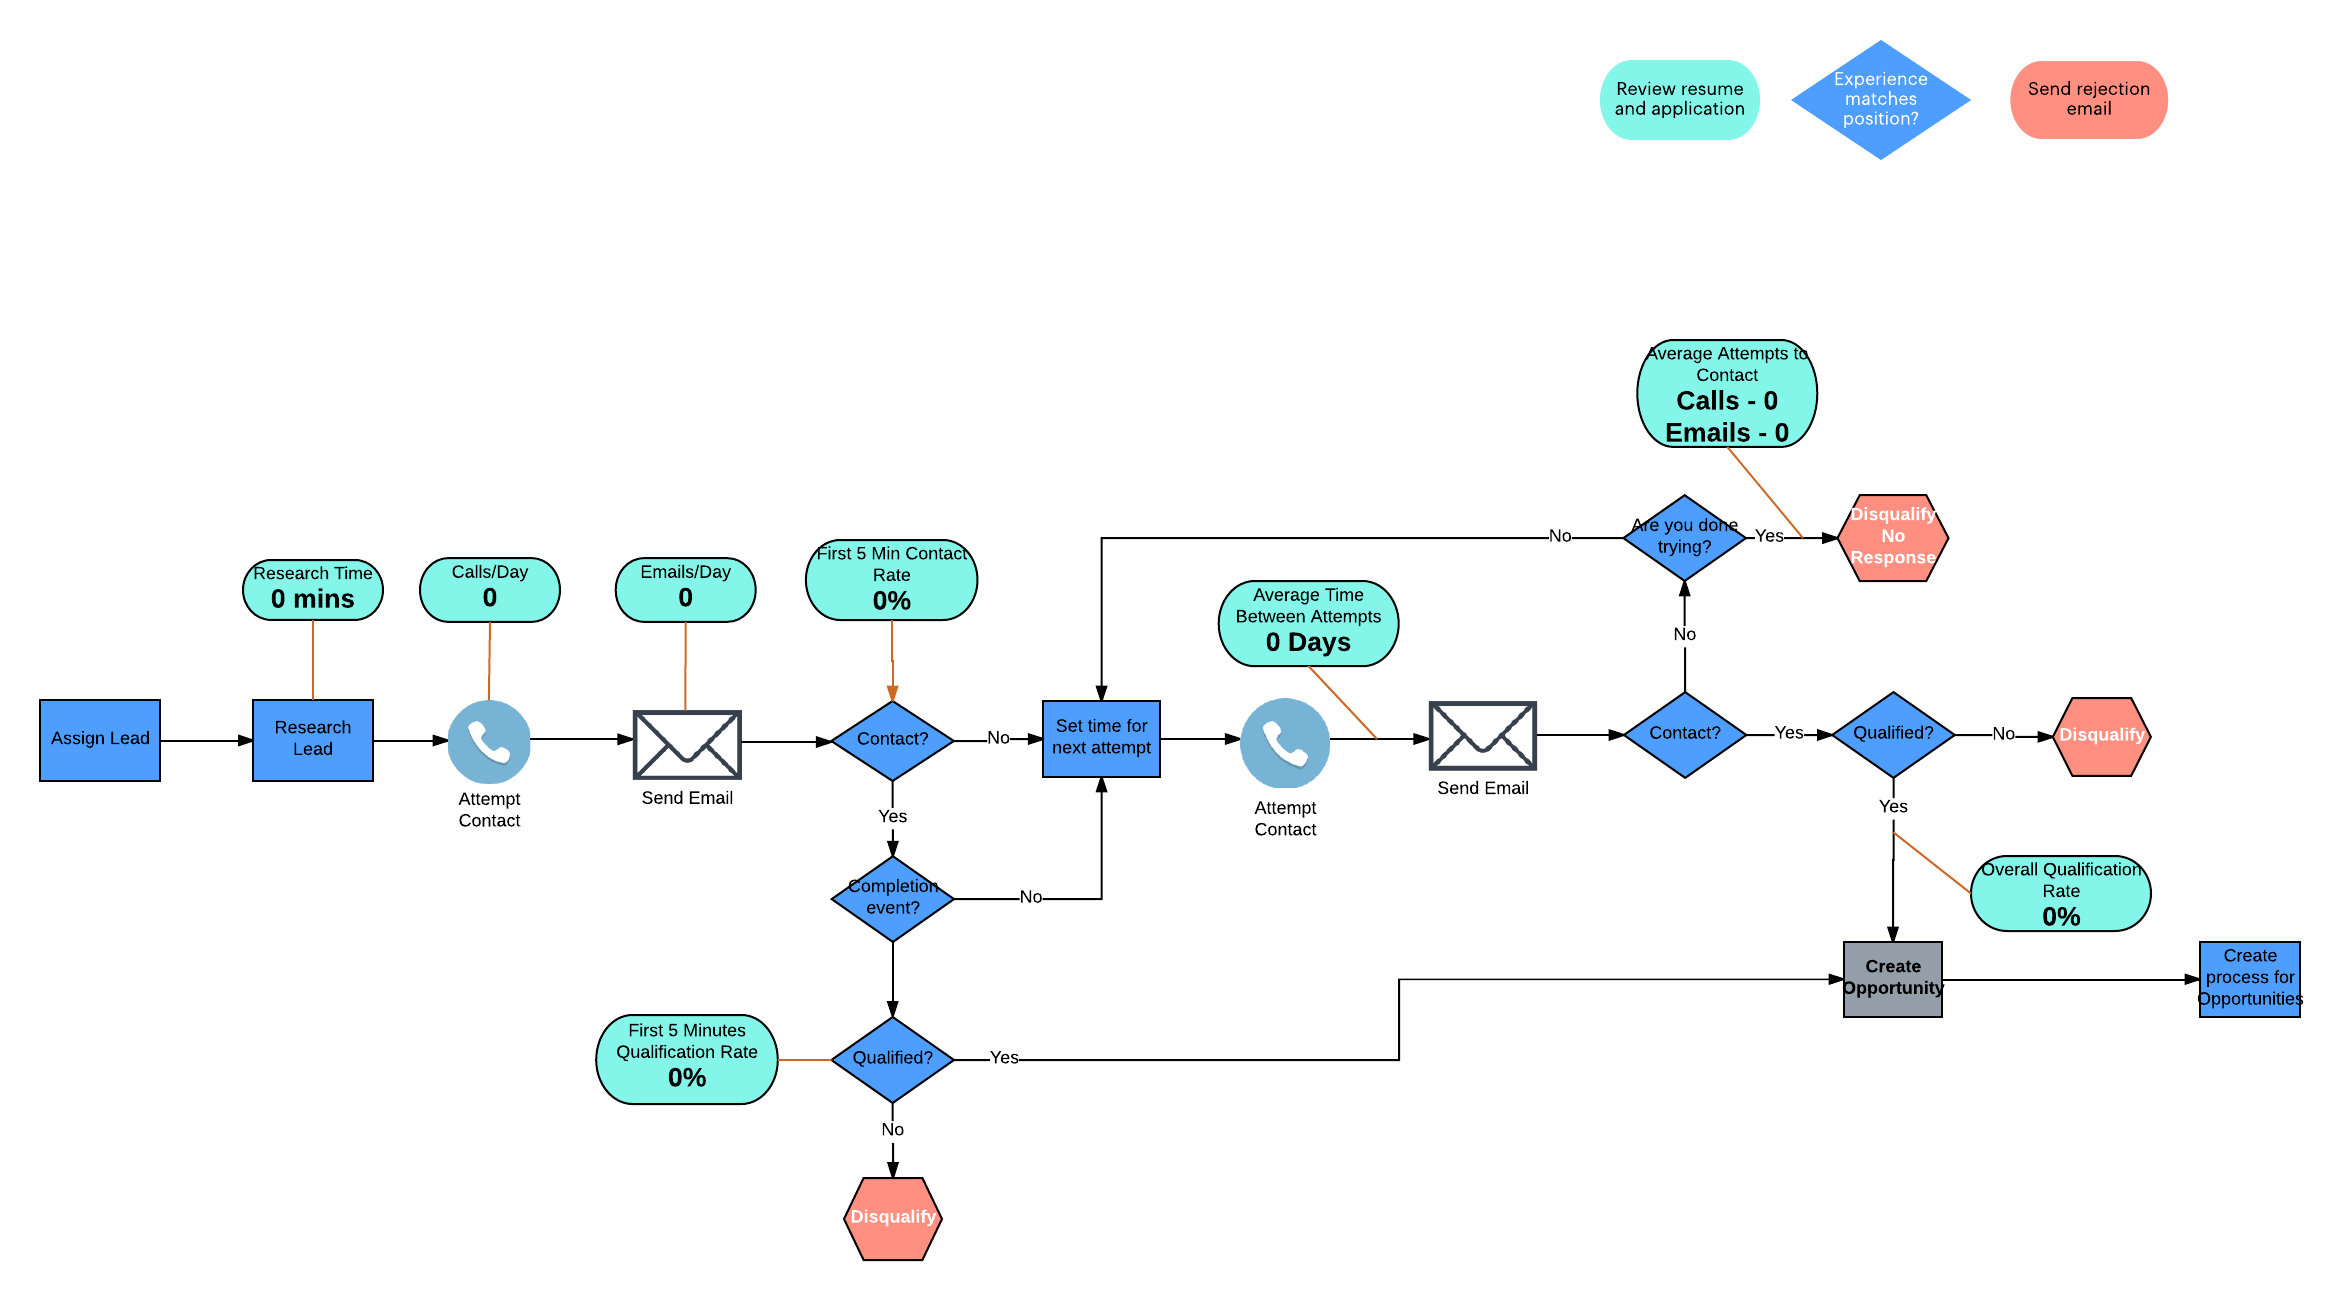
Average lead response time + average follow-up attempts

These two sales KPI metrics go hand in hand to help reps track leads and improve conversion rates. The average lead response time tells you how long it takes the sales rep to follow up with a lead. This is a crucial metric of success because response time can mean the difference between conversion and a lost lead.

In fact, one Harvard study found that businesses who responded to leads within an hour of the first touch were seven times more likely to qualify the lead than those who waited longer to reach out.

Additionally, the number of follow-up attempts can make or break a sale. In today’s busy world, persistence pays off. High-growth companies report an average of 16 touchpoints per prospect within two to four weeks.

However, though 50% of sales happen after the fifth follow-up, a whopping 44% of salespeople give up after just one follow-up.

By tracking follow-up and response metrics, both sales managers and reps can drill down on the most effective activities and make sure sales reps aren’t missing opportunities to close.

Using Lucidchart to create sales KPI dashboards

Sales managers are busy and often juggle multiple tech platforms and reporting systems, and their hectic schedules make it difficult to keep the most important information front of mind.

sales performance dashboard
Sales Performance Dashboard

Lucidchart cuts out the clutter and helps you focus on your most important sales metrics with powerful sales dashboards and visuals. In our visual workspace, you can easily connect and organize your team’s data in one place.

Use data linking—available through Lucidchart Enterprise accounts—to pull reports directly to your dashboard with real-time updates so you always have the most accurate information. Conditional formatting lets you customize your dashboard and set visual cues to help you pinpoint high-priority activities and focus on optimizing your pipeline where it needs it most. 

TUTORIAL

Push your sales team further. Learn how to create a dynamic, shareable dashboard within Lucidchart.

Learn more

Lucidchart

Lucidchart, a cloud-based intelligent diagramming application, is a core component of Lucid Software's Visual Collaboration Suite. This intuitive, cloud-based solution empowers teams to collaborate in real-time to build flowcharts, mockups, UML diagrams, customer journey maps, and more. Lucidchart propels teams forward to build the future faster. Lucid is proud to serve top businesses around the world, including customers such as Google, GE, and NBC Universal, and 99% of the Fortune 500. Lucid partners with industry leaders, including Google, Atlassian, and Microsoft. Since its founding, Lucid has received numerous awards for its products, business, and workplace culture. For more information, visit lucidchart.com.

Bring your bright ideas to life.

Sign up free

or continue with

Sign in with GoogleSign inSign in with MicrosoftSign inSign in with SlackSign in

Get started

  • Pricing
  • Individual
  • Team
  • Enterprise
  • Contact sales
PrivacyLegal

© 2024 Lucid Software Inc.