Context diagram software
Lucidchart is a visual workspace that combines diagramming, data visualization, and collaboration to accelerate understanding and drive innovation.
Simplify systems design and analysis with a context diagram
Create a context diagram as a visual reference for engineers and other team members
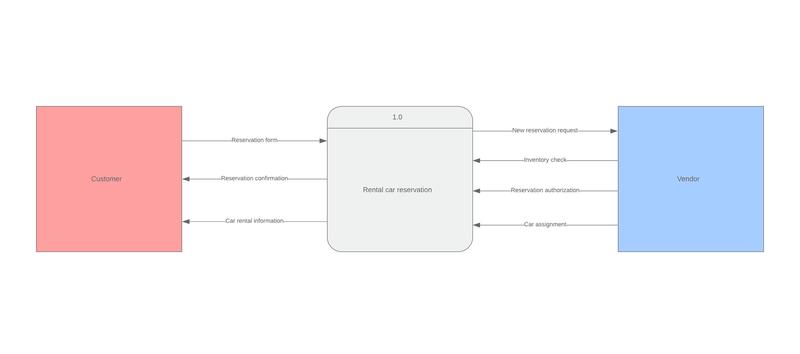
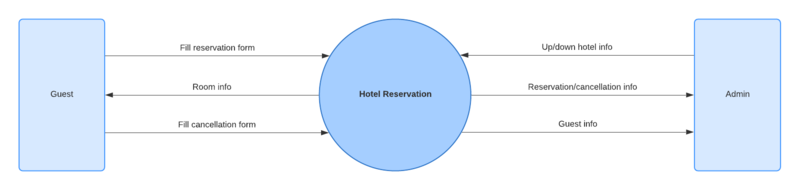
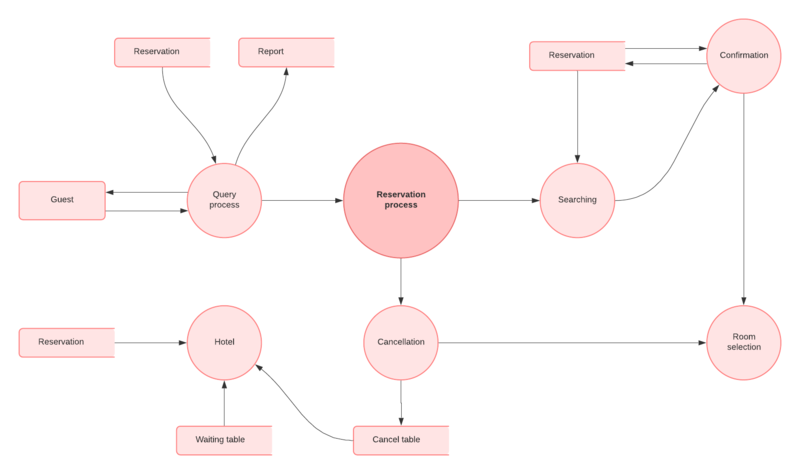
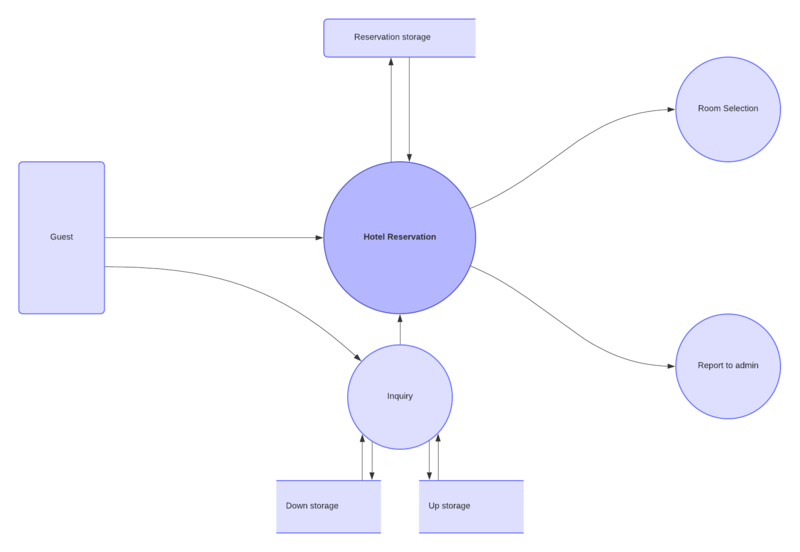
A context diagram, also known as a system context diagram or level-0 DFD, communicates a high-level overview of the flow of data within a technical system. With virtually no technical knowledge required to understand this type of system diagram, engineers, analysts, developers, and stakeholders can easily use it as a visual reference for systems analysis and design. Use Lucidchart as your context diagram software to effectively focus attention on the external factors and events that interact with your system and determine the extent of your process’s scope.
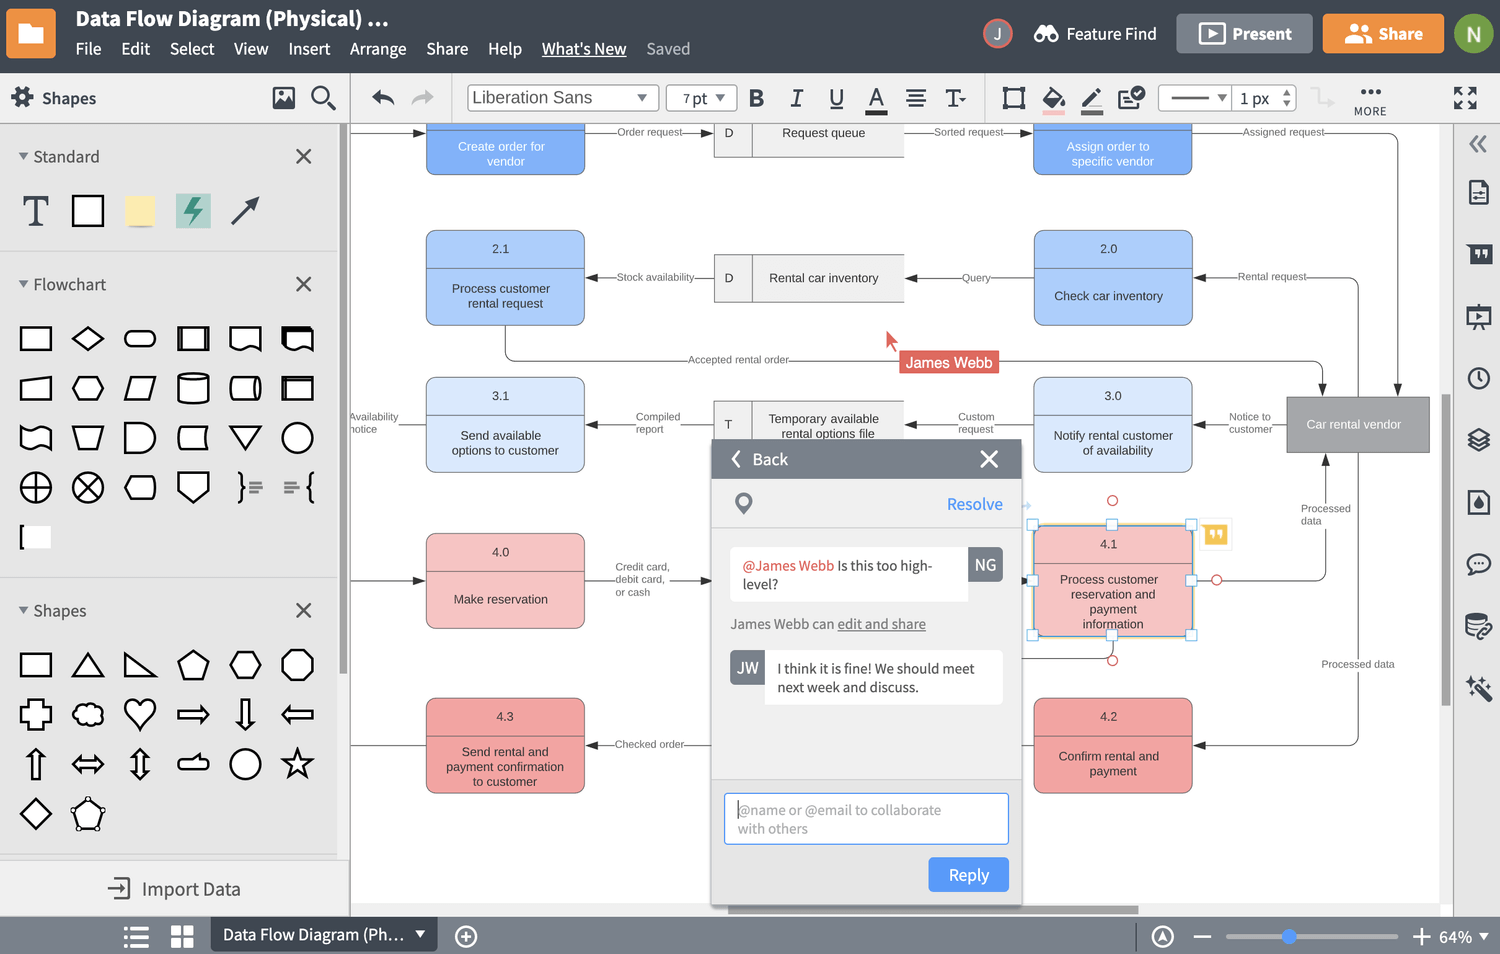
Enable easy comprehension with intuitive collaborative features
Best practices dictate that project stakeholders review, comprehend, and maintain access to your system context diagram. Our context diagram maker keeps collaboration simple, letting you publish and share your visuals with stakeholders instantly, manage access levels amongst your team, and collect feedback via shape-specific comments, @mention notifications, and in-editor chat. Real-time collaboration in Lucidchart lets you and your collaborators edit and update context diagrams simultaneously on the same canvas, so your team can accurately map data flows at any level.
Use intuitive diagramming features to create technical diagrams in minutes
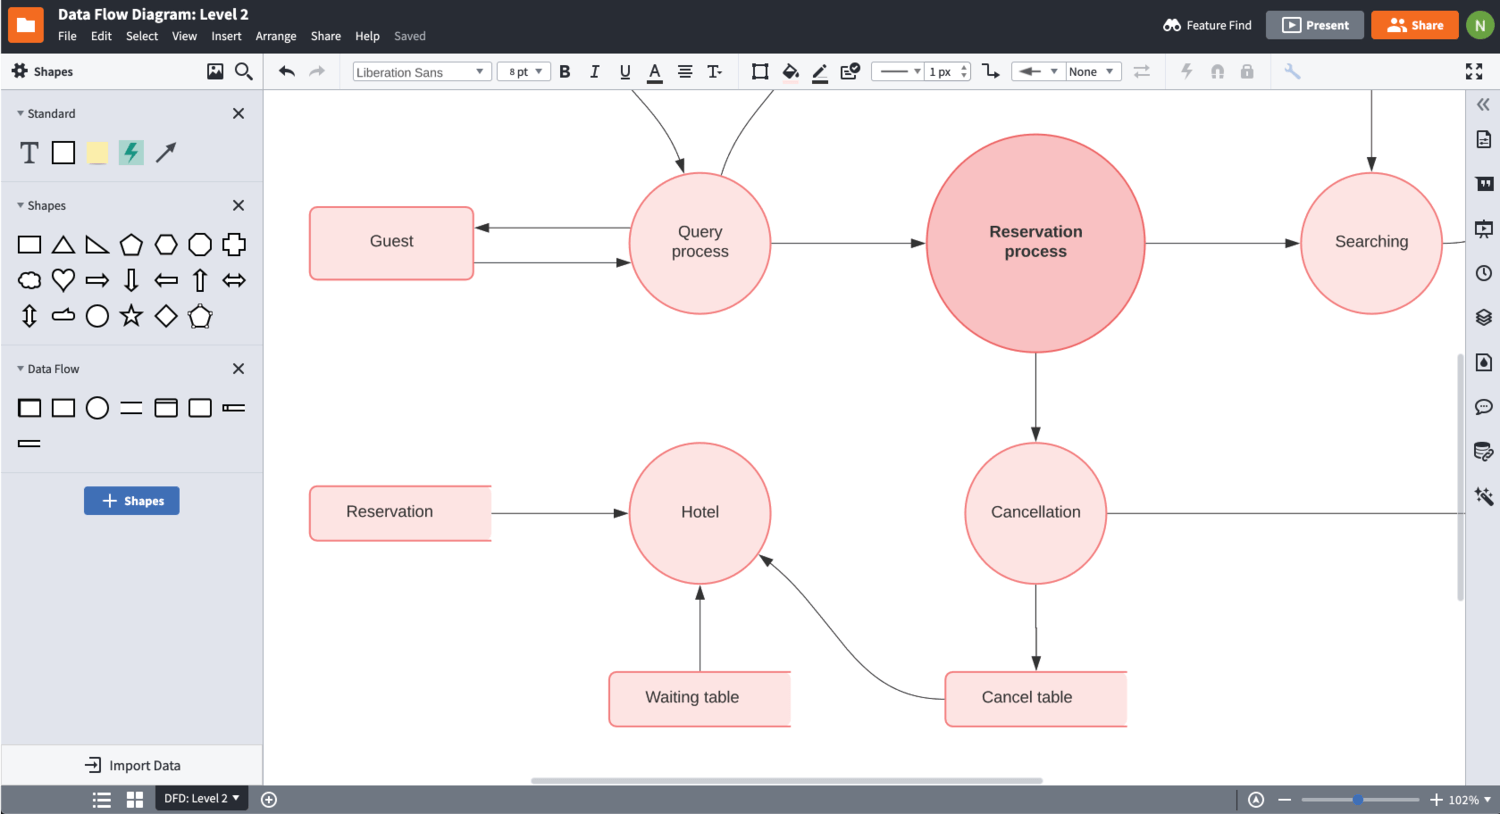
Creating a context diagram is simple—and Lucidchart’s intuitive features keep it that way. Whether you’re building a simple Level-0 DFD or mapping deeper levels of data flows, you can create a professional depiction of any system or process with our context diagram tool that offers access to hundreds of engineering templates and dedicated shape libraries containing industry-standard symbols. Premium features in Lucidchart also help teams automate other technical diagrams: Generate UML sequence diagrams from text markup, import your database structure to build an ERD, and visualize your cloud architecture with Lucidscale.
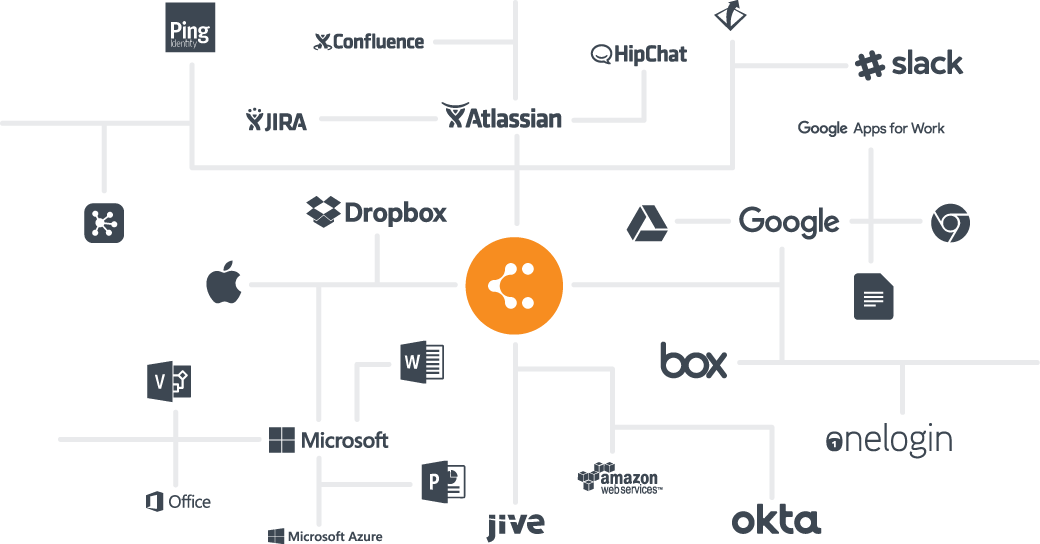
Implement and share visuals using the apps your team’s already invested in
Lucidchart is fully integrated with today’s most popular collaborative and technical apps, making sharing and publishing your diagrams an effortless process. Take your visuals created in our context diagram maker and insert them directly into technical platforms, including Confluence wikis or Jira issues. Lucidchart also works seamlessly with platforms like G Suite, Microsoft Office, Microsoft Teams, Slack, Github, and more, so you can publish and share your visuals within text documents, spreadsheets, slideshow presentations, or chat.
How to make a context diagram
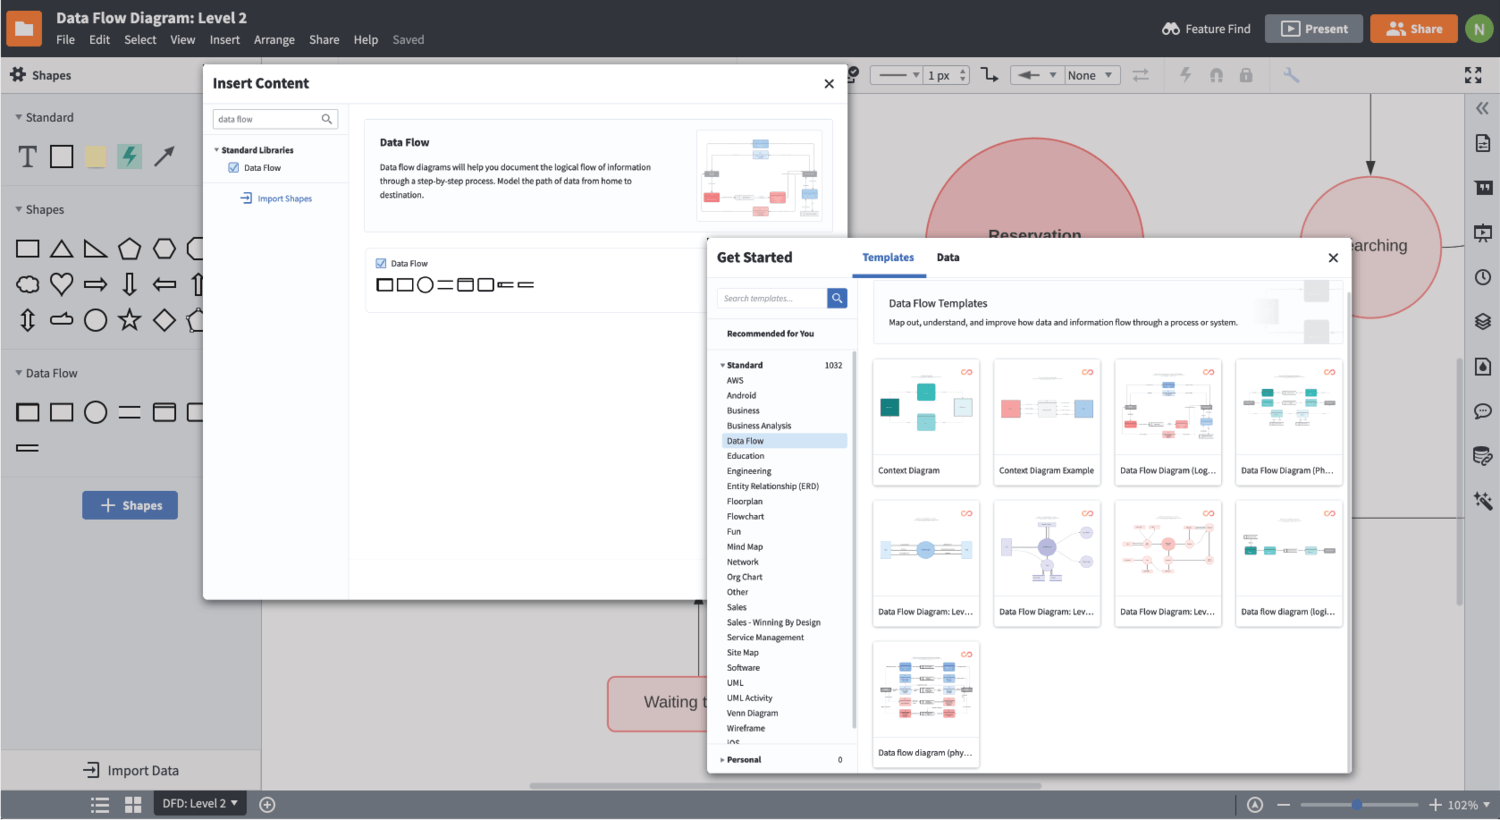
Select the “Data Flow” shape library or choose a template
Open the Shape Manager and select the “Data Flow” symbols to start from scratch, or select a template to customize from the template gallery using our context diagram tool.
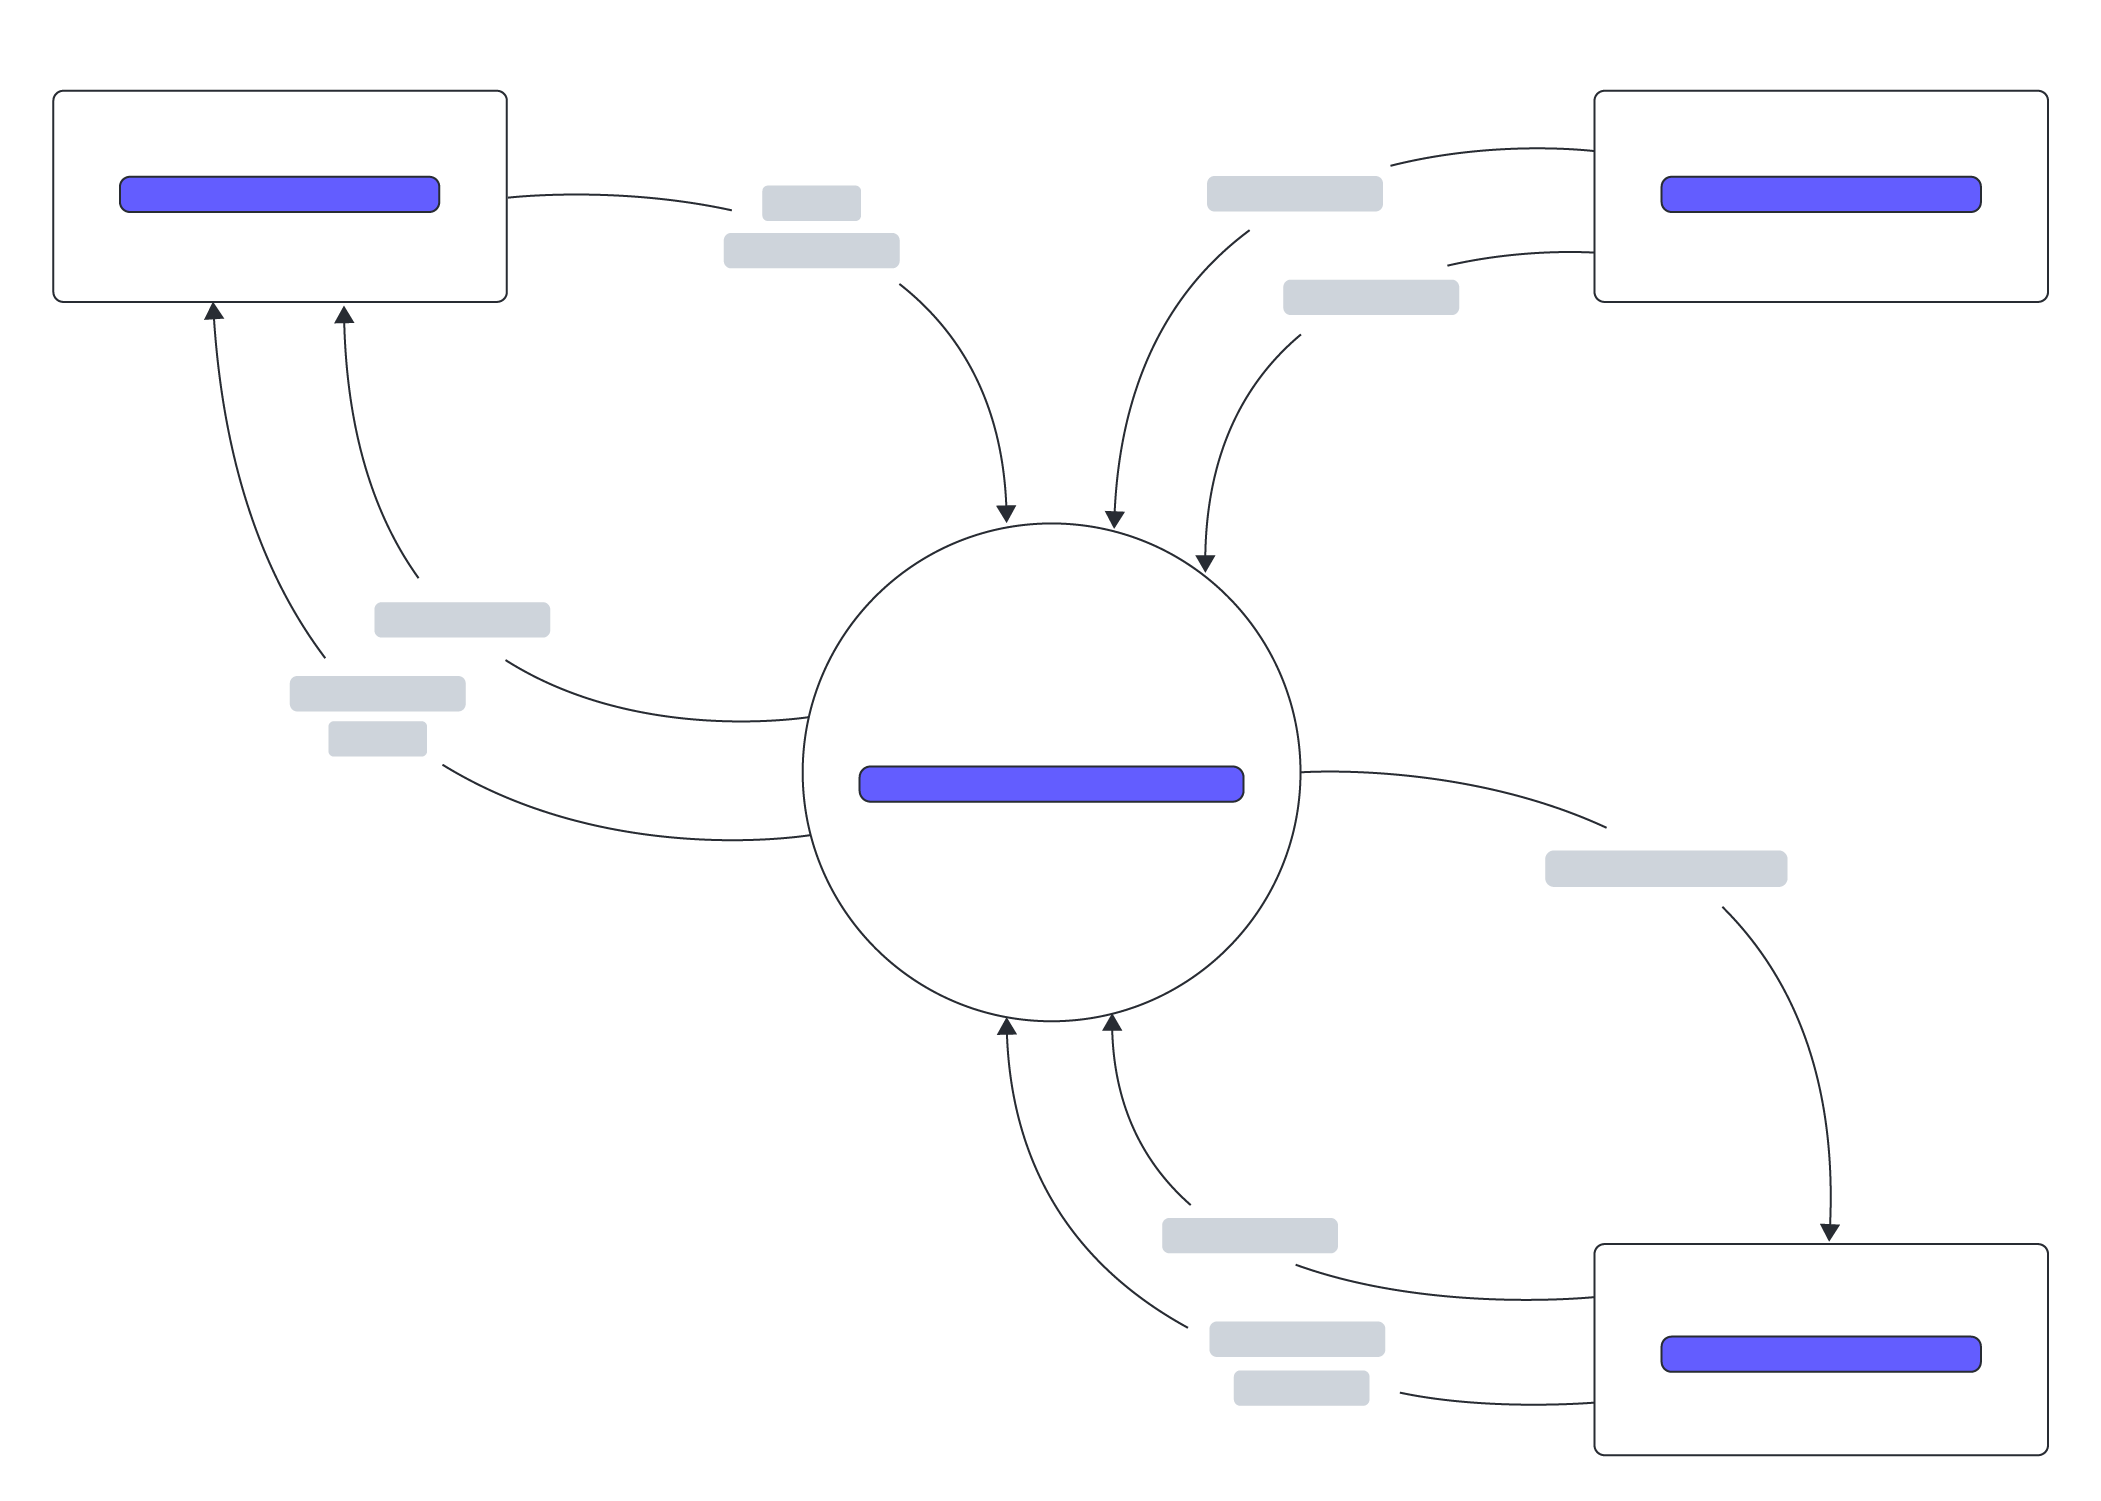
Place your system in the center of your context diagram
Put your system in a shape in the center of your canvas and label it accordingly. No further information about the interior operations of your system is required.
Add all external entities around your system
Add entity shapes to represent events that may interact with and influence your system. Entities can include other systems, users, data stores, and more.
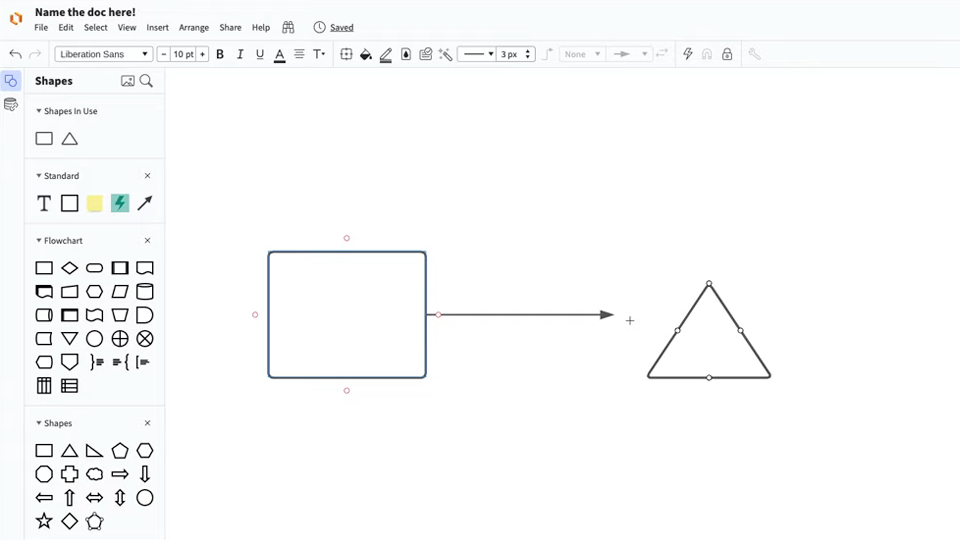
Add and specify data flows between your system and external entities
Use lines and arrows to indicate the flow of data between your system and each external entity. Specify how data interacts with your system by adding arrows in the direction of the flow of data.
Share your system diagram with team members and stakeholders
Your finished system diagram should be straightforward and simple to understand. Share your diagram with project stakeholders to ensure accurate systems analysis and determine what’s needed to see your project through to completion.
Frequently asked questions about our context diagram software
Do you have templates for system context diagrams?
How can I share my context diagram?
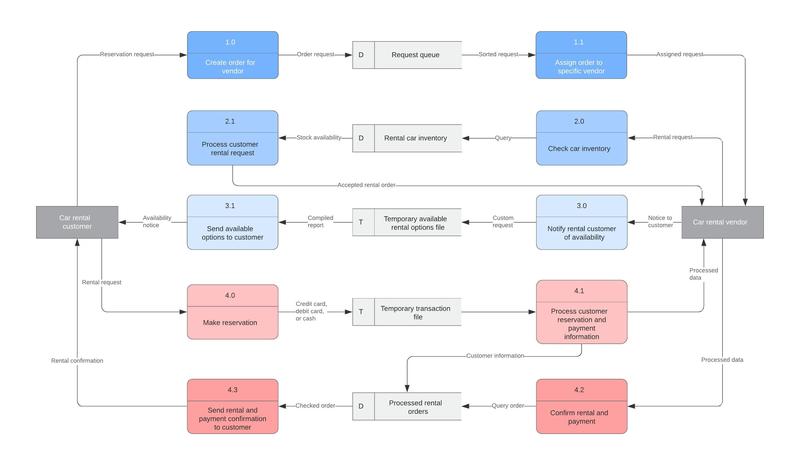
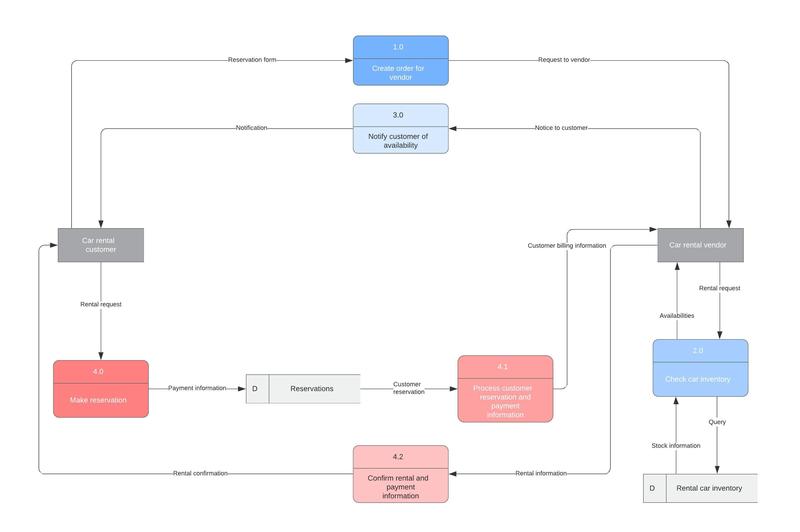
How can I show different levels of data flow within my system separately in the same document?
Master the basics of Lucidchart in 3 minutes
master the basics of Lucidchart in 5 minutes
Used by millions across the globe
"Lucidchart is a powerhouse tool in software engineering for conventional diagrams such as ERD, flowcharts, context, and data flow diagrams that are used system analysis and database designs."

4.5/5 stars 650+ reviews