
Gantt chart maker
Lucidchart is an intelligent diagramming application that takes Gantt charts to the next level. Drag and drop shapes, import data, access templates, and so much more.


By registering, you agree to our Terms of Service and you acknowledge that you have read and understand our Privacy Policy.


Simplify project management
Get started in just a few clicks with our simple, intuitive Gantt chart software.
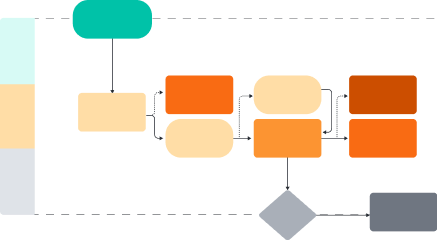
Manage project timelines effectively

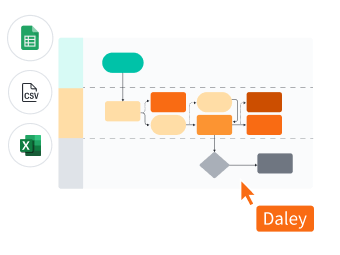
Add a screen recording or video

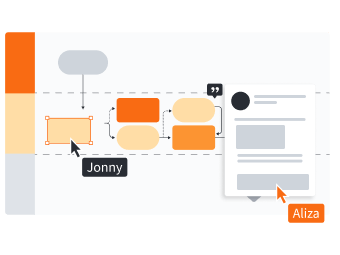
Share with your team

Real-time visual collaboration from anywhere
Customizable Gantt chart templates

Highly rated
Master the basics in 3 minutes
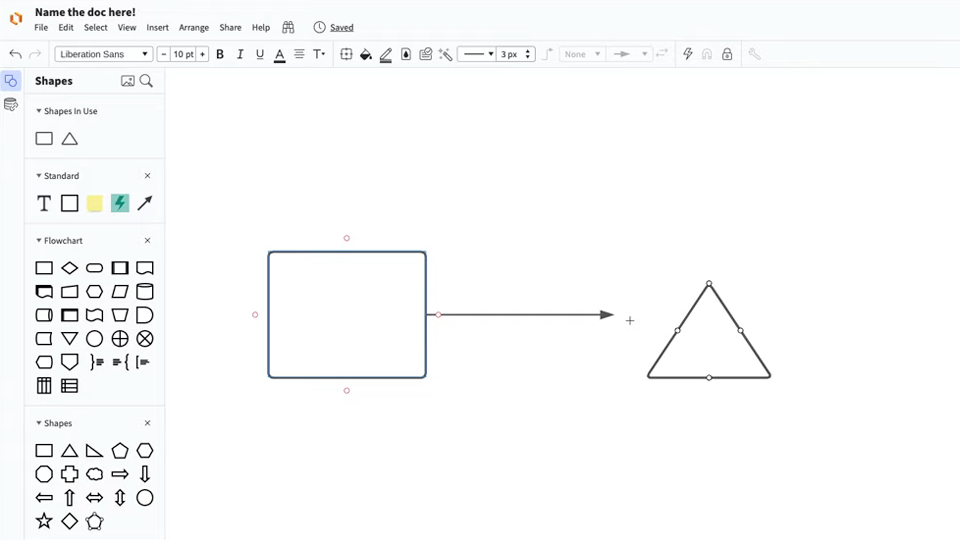
master the basics of Lucidchart in 5 minutes
- Create your first Gantt chart from a template, blank canvas, or imported document.
- Add shapes, connect lines, and write text.
- Adjust styling and formatting within your diagram.
- Use Feature Find to locate anything you need.
- Share your Gantt chart with your team and start collaborating.
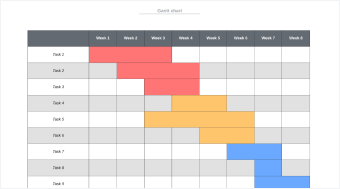
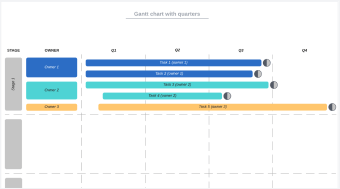
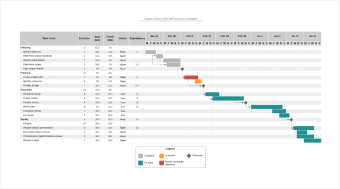
Gantt chart templates
Get started building out your own Gantt chart with these templates from our gallery.
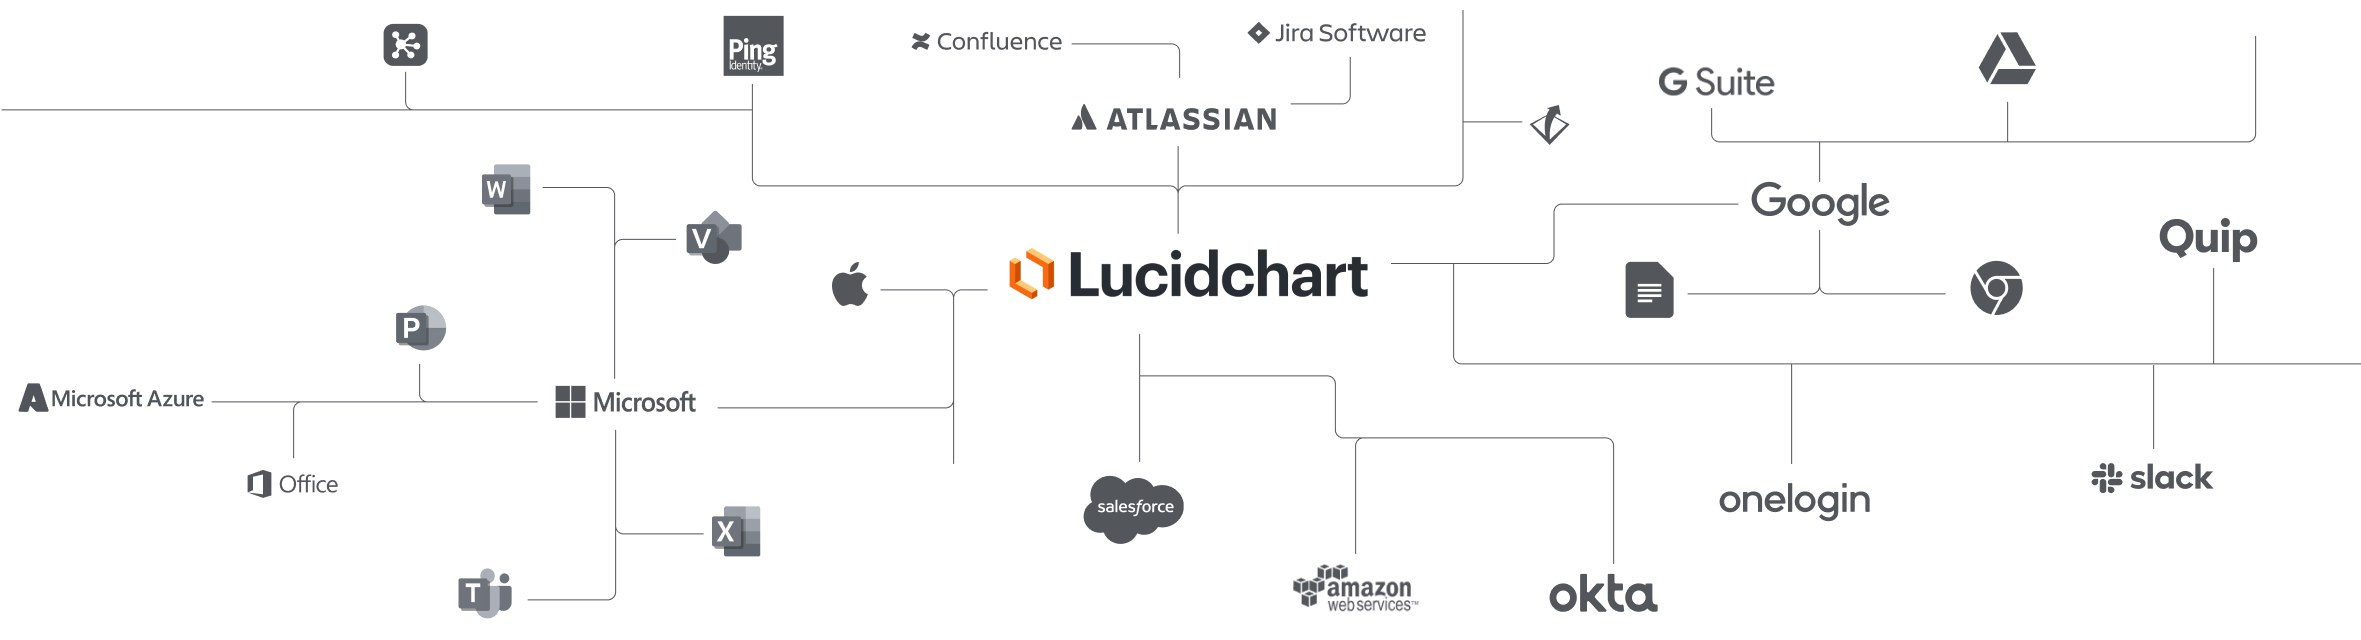
Lucidchart integrations
Connect Lucidchart to your favorite industry-leading apps.
See why teams use Lucidchart as their Gantt chart creator
Diagram, visualize data, and collaborate all in one platform.

Collaboration
Clarity
Alignment

Better together
What is a Gantt chart?
A Gantt chart is used for project management to visualize all tasks from the beginning of a project to its completion. A Gantt chart lays out individual tasks and their dependencies, ownership, duration, and the expected duration of the project as a whole. With each task mapped out and assigned, your team can easily meet deadlines and ensure accountability.
How to make a Gantt chart
Gather the information needed for your project
Compile a list of project timeline information, stakeholders, tasks, and resources to ensure that your Gantt chart is as thorough as possible.
Select a Gantt chart template or start from scratch
Create a Gantt chart by selecting a template from our template gallery or by starting with a blank canvas.
Customize a template to fit your project needs
Input your project milestones and deadlines, and adjust each bar to visually correspond with the expected duration for each.
Collaborate and improve your Gantt chart
Share the most up-to-date version of your Gantt chart with stakeholders to analyze potential pain points, make updates, and recognize progress as your projects move forward.
Print, share, or present
Once your Gantt chart is ready, you can share it with your team via email, link, Slack, or Join ID. Or if you’d prefer a hard copy, print the chart. You can also use Presentation Mode to create presentation slides right in Lucidchart.