About Lucidchart
Lucidchart, a cloud-based intelligent diagramming application, is a core component of Lucid Software's Visual Collaboration Suite. This intuitive, cloud-based solution empowers teams to collaborate in real-time to build flowcharts, mockups, UML diagrams, customer journey maps, and more. Lucidchart propels teams forward to build the future faster. Lucid is proud to serve top businesses around the world, including customers such as Google, GE, and NBC Universal, and 99% of the Fortune 500. Lucid partners with industry leaders, including Google, Atlassian, and Microsoft. Since its founding, Lucid has received numerous awards for its products, business, and workplace culture. For more information, visit lucidchart.com.
Related articles
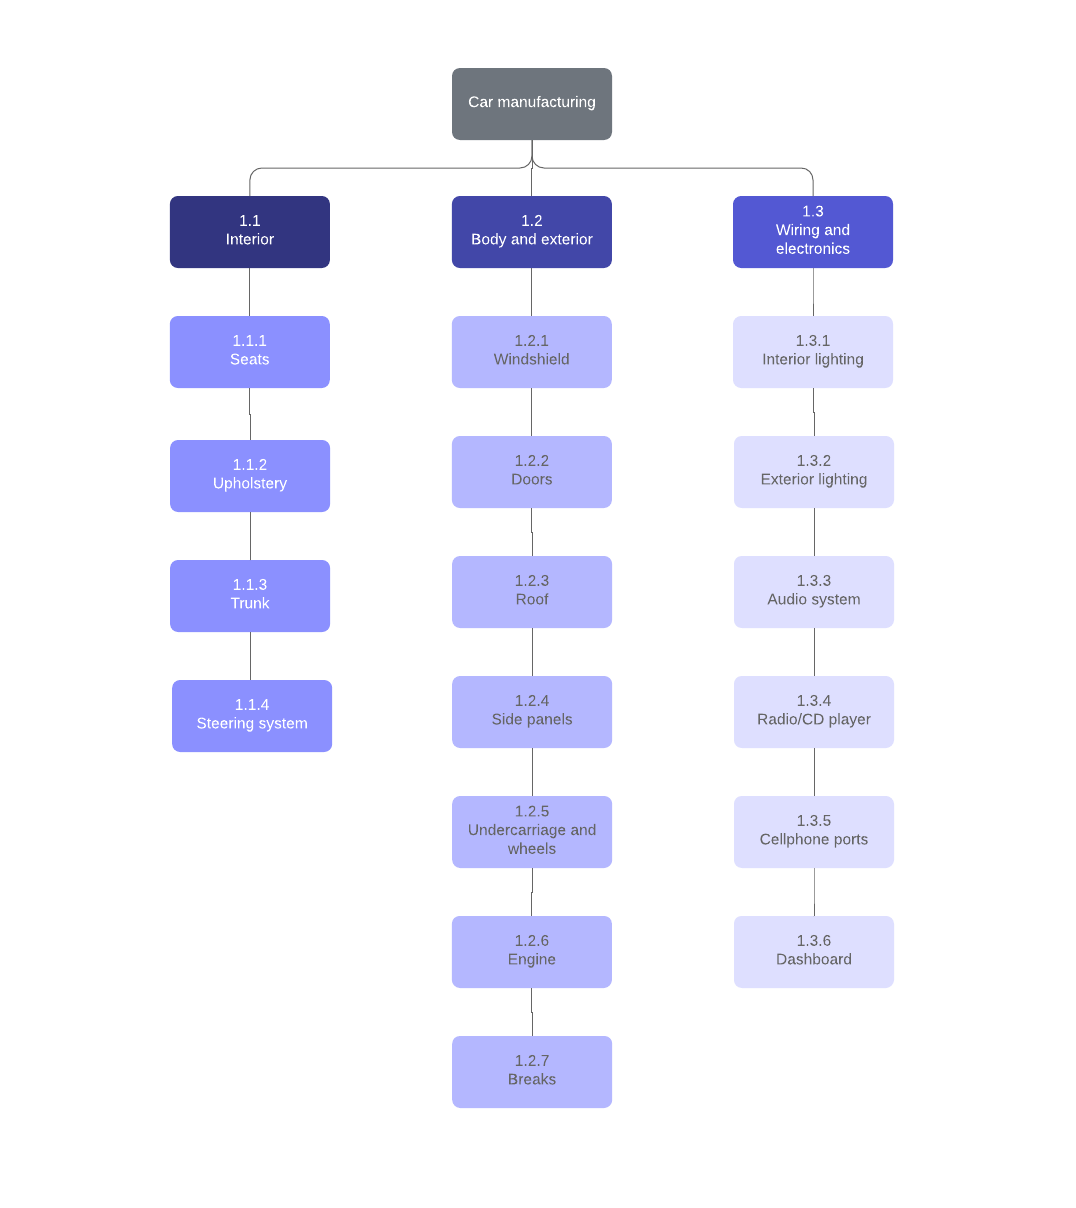
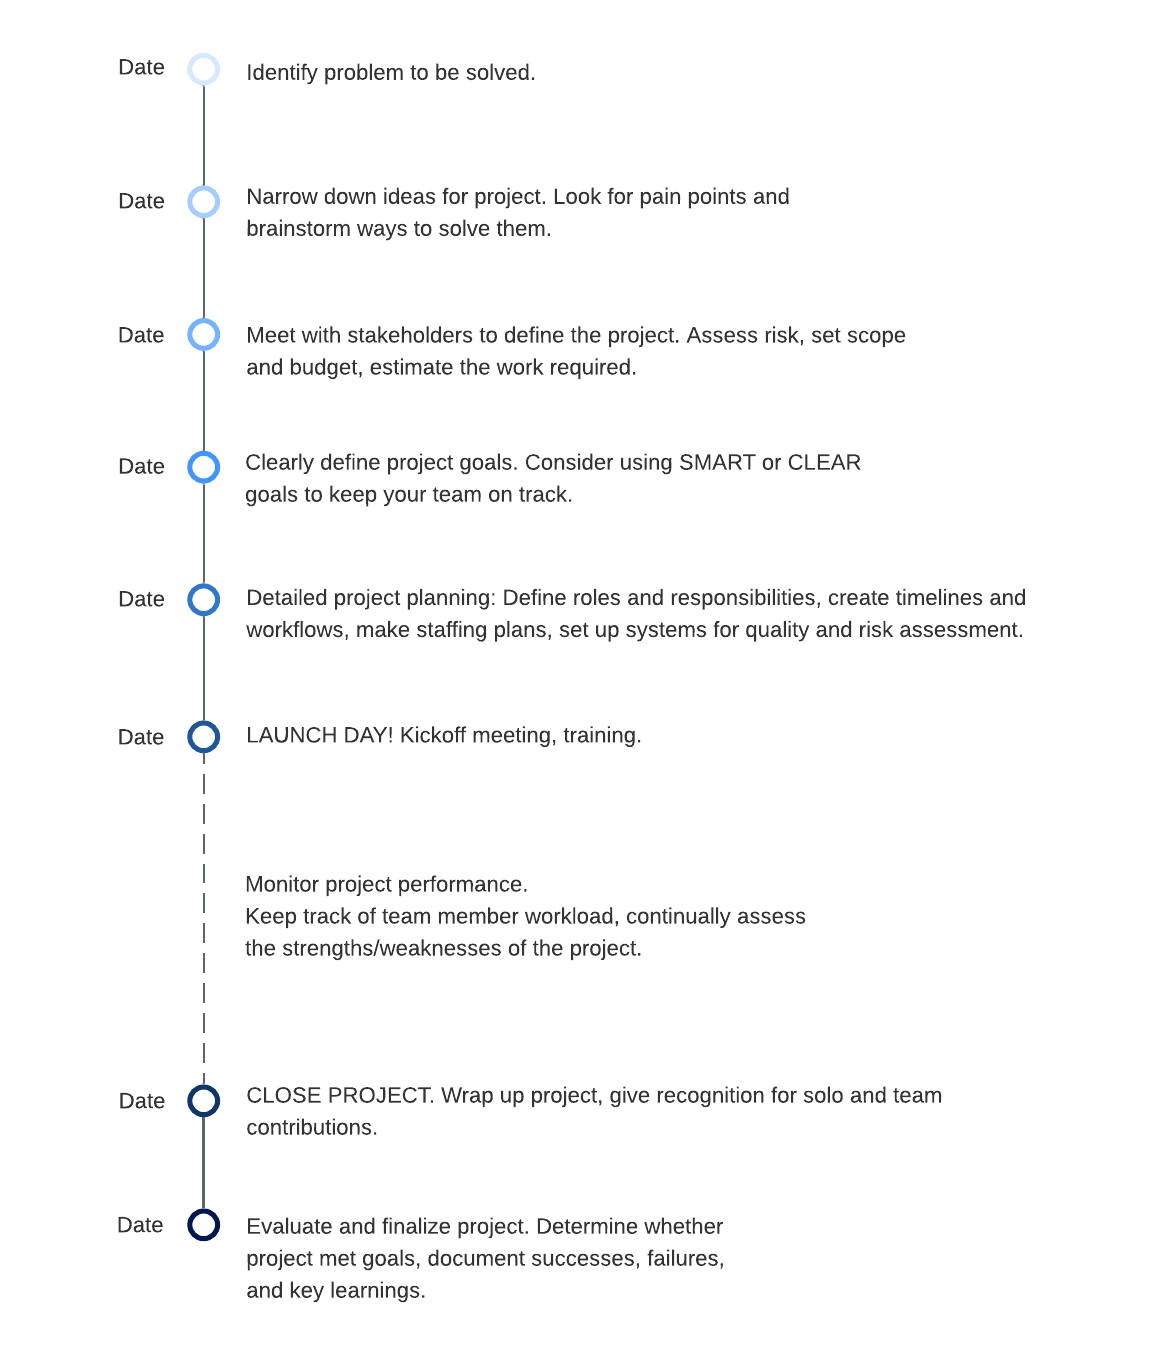
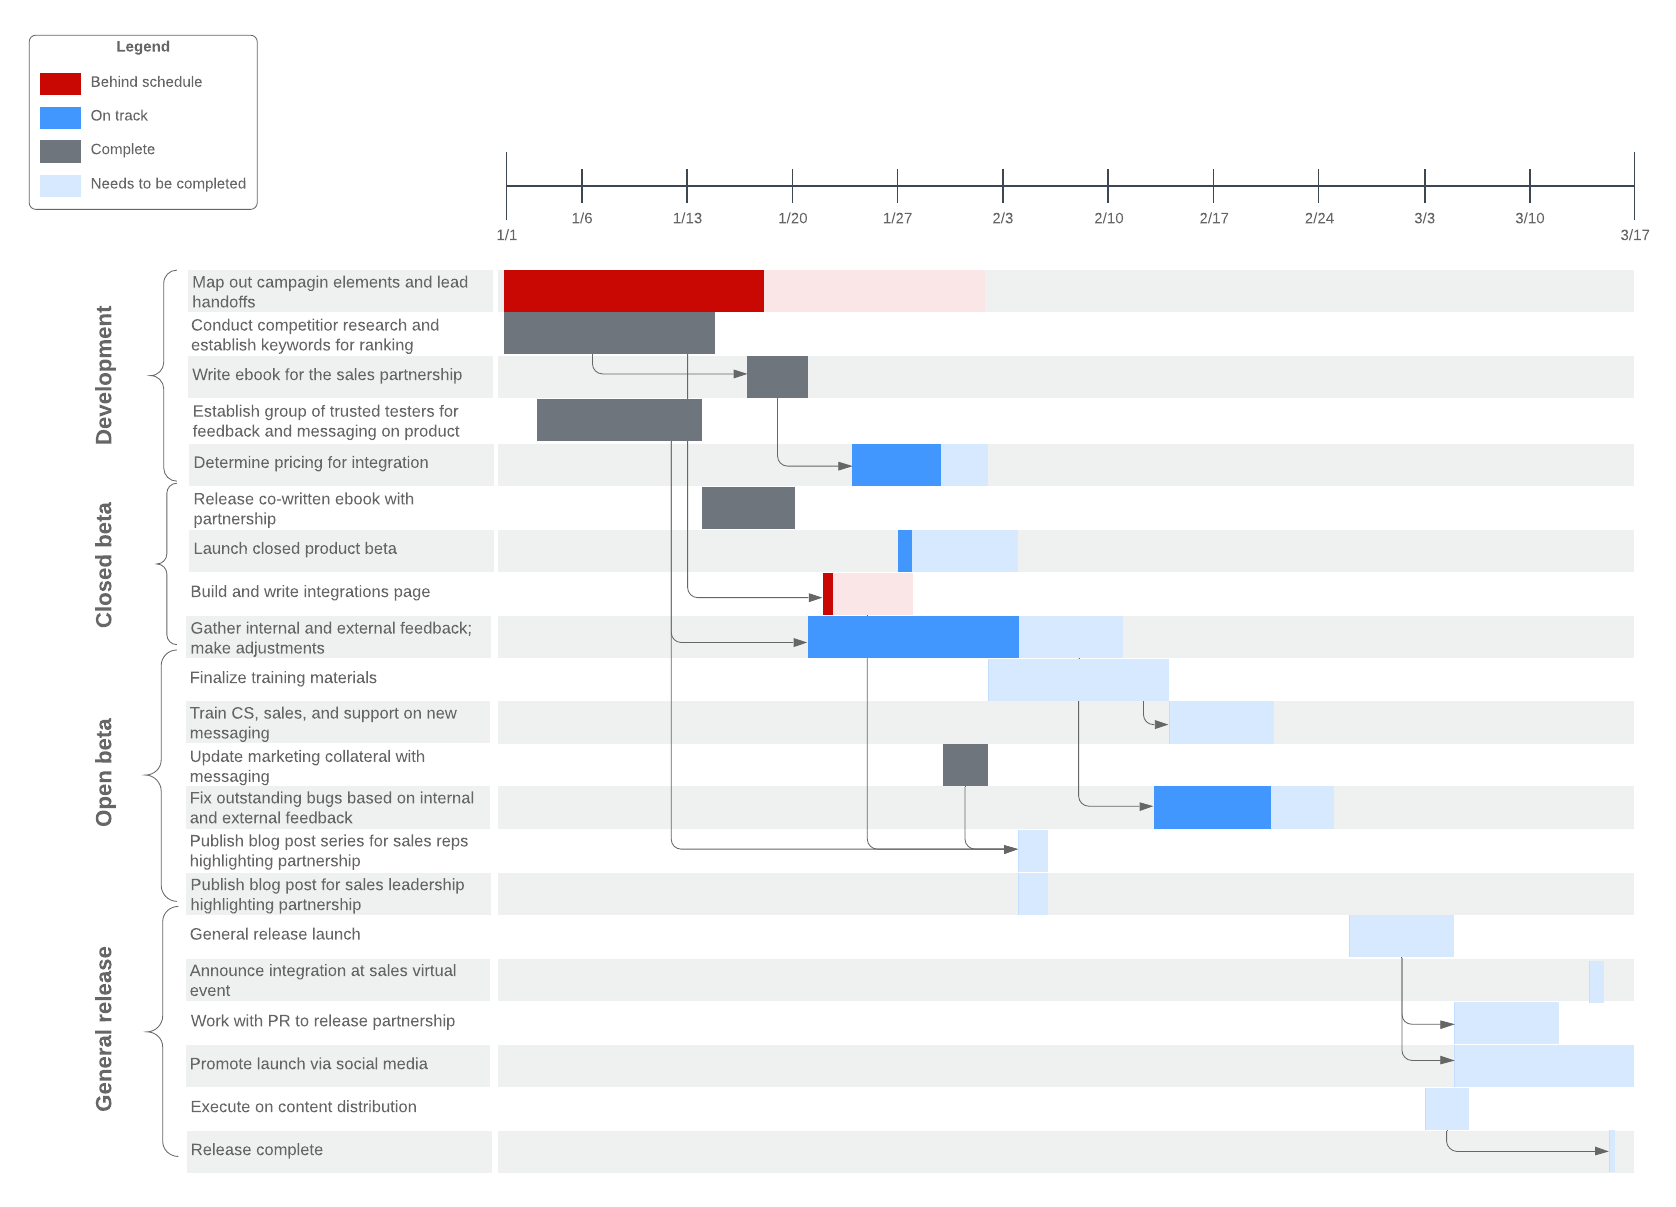
8 templates for project managers
In this blog post, we will share eight templates that project managers can use right now.
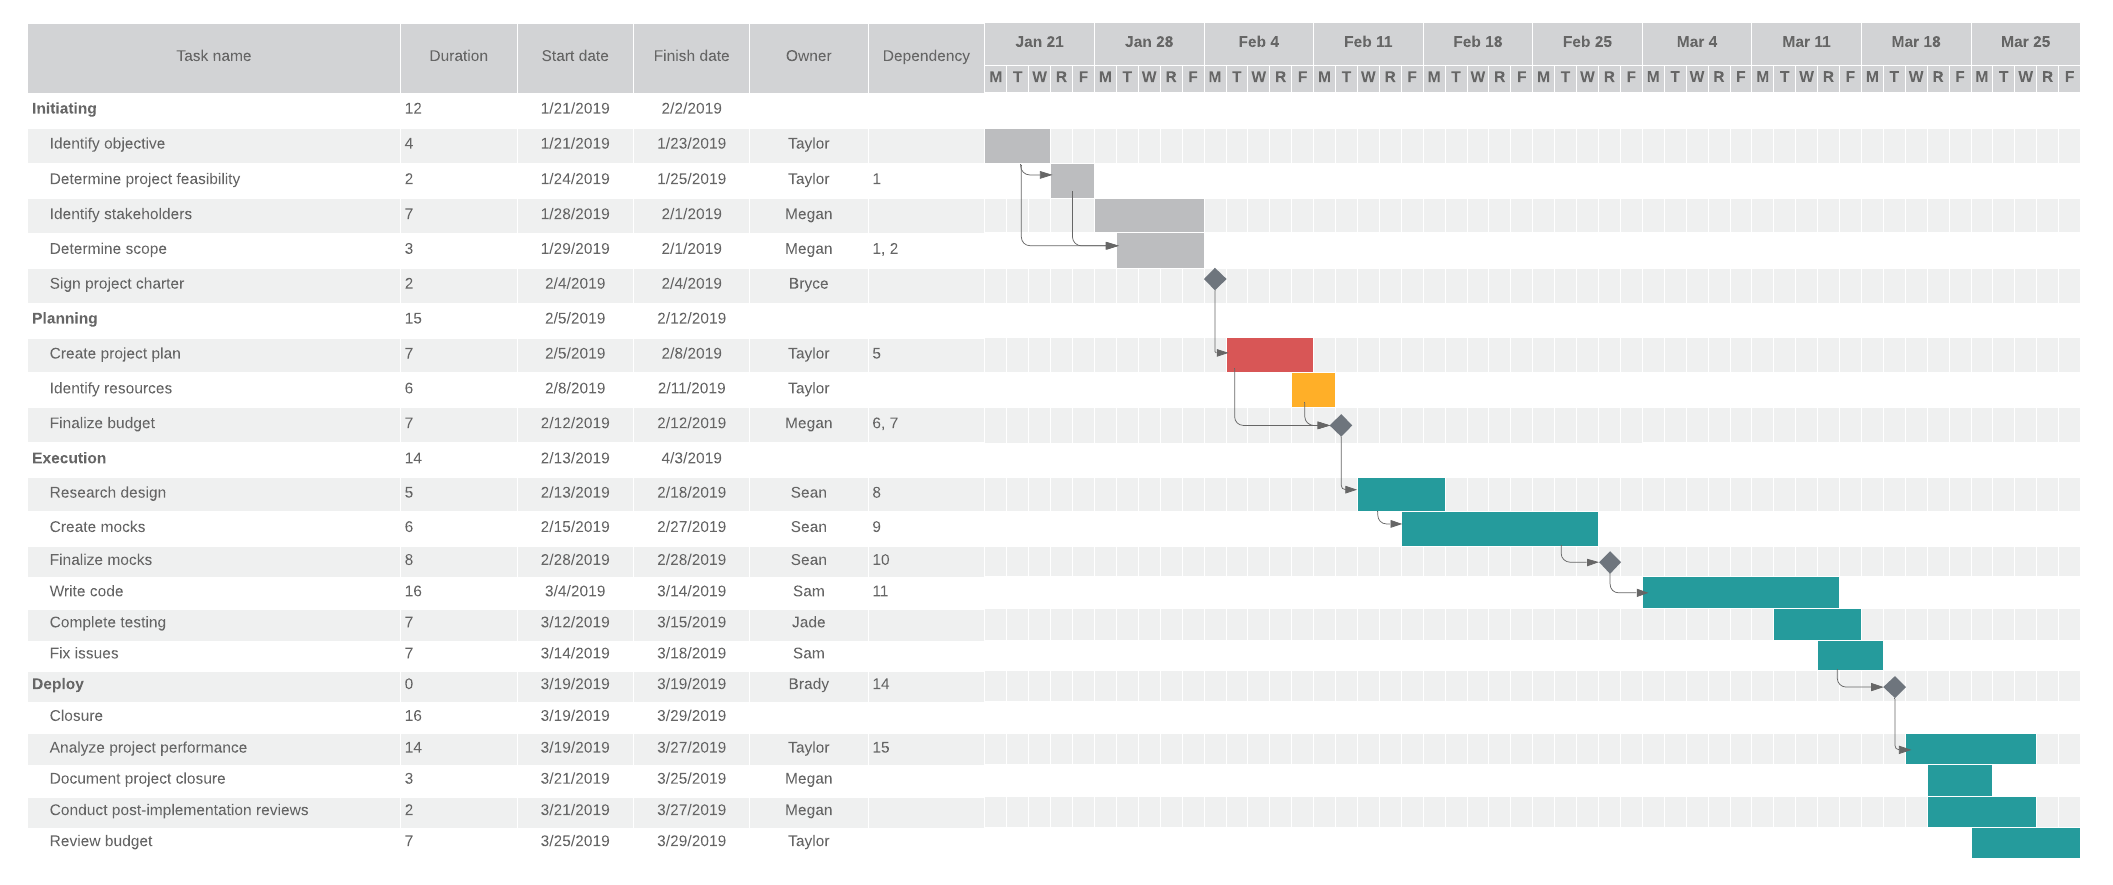
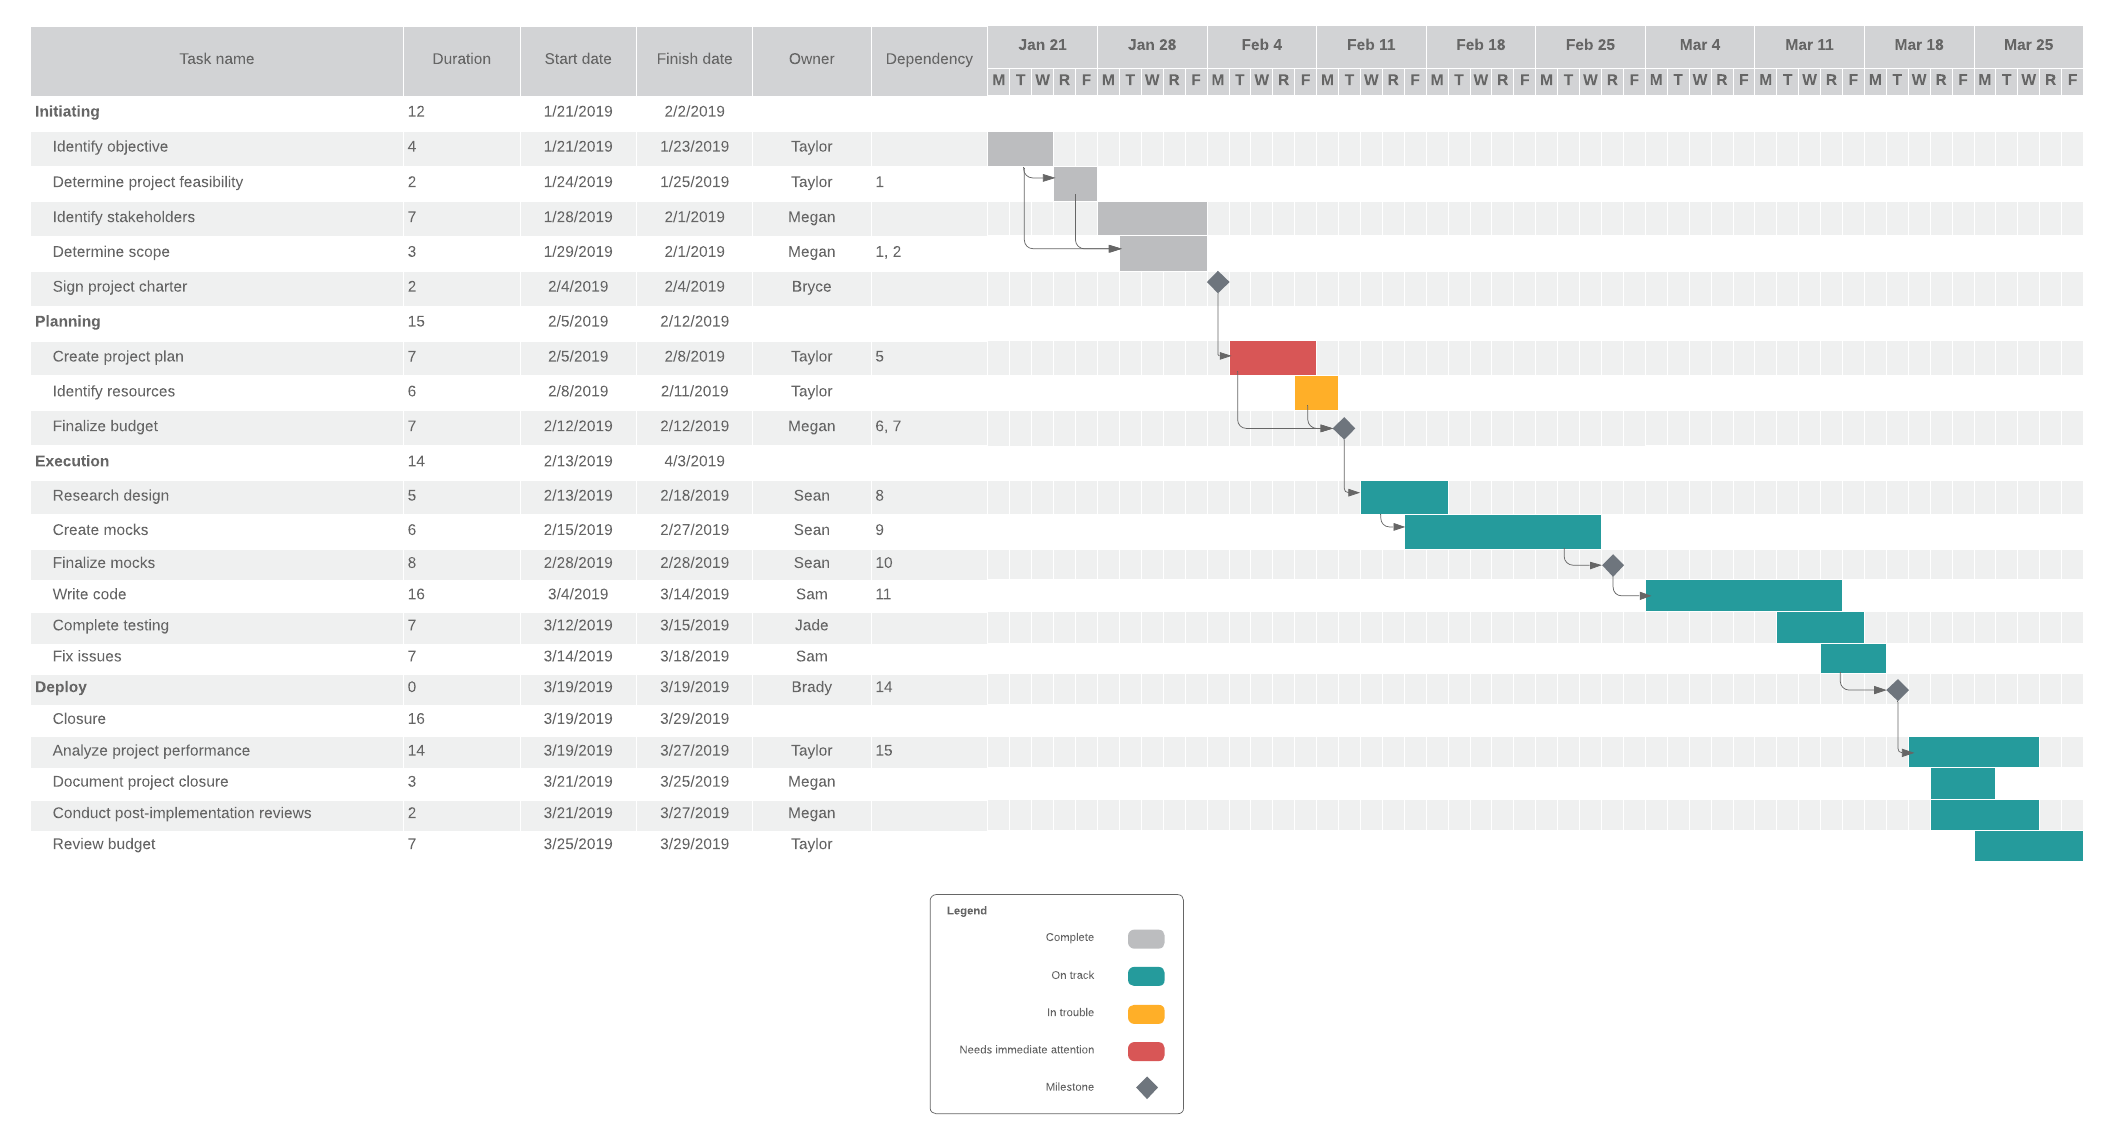
How to Make a Gantt Chart in Excel
Learn two approaches on how to make a Gantt chart in Excel with this complete step-by-step guide. Free templates included!
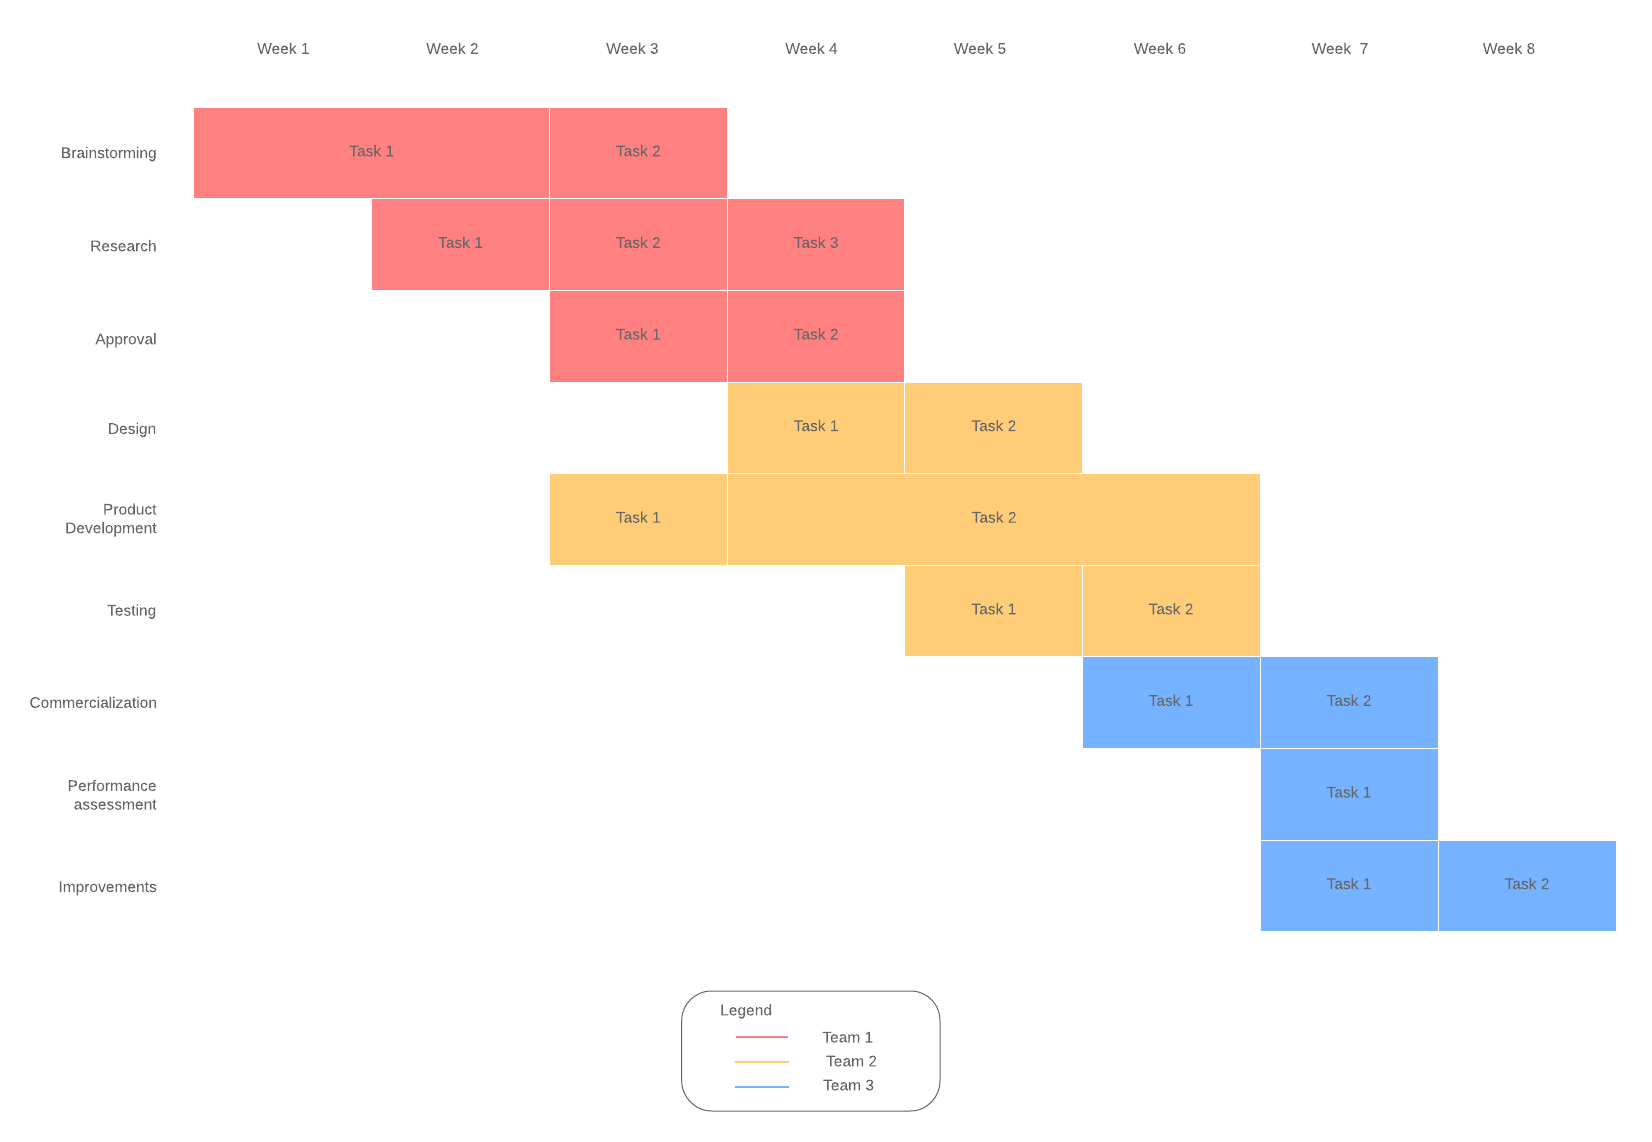
7 alternatives to Gantt charts
Gantt charts come with a series of fatal flaws that leave many managers looking for Gantt chart alternatives to meet their needs. Try these alternatives in Lucidchart. Templates included!
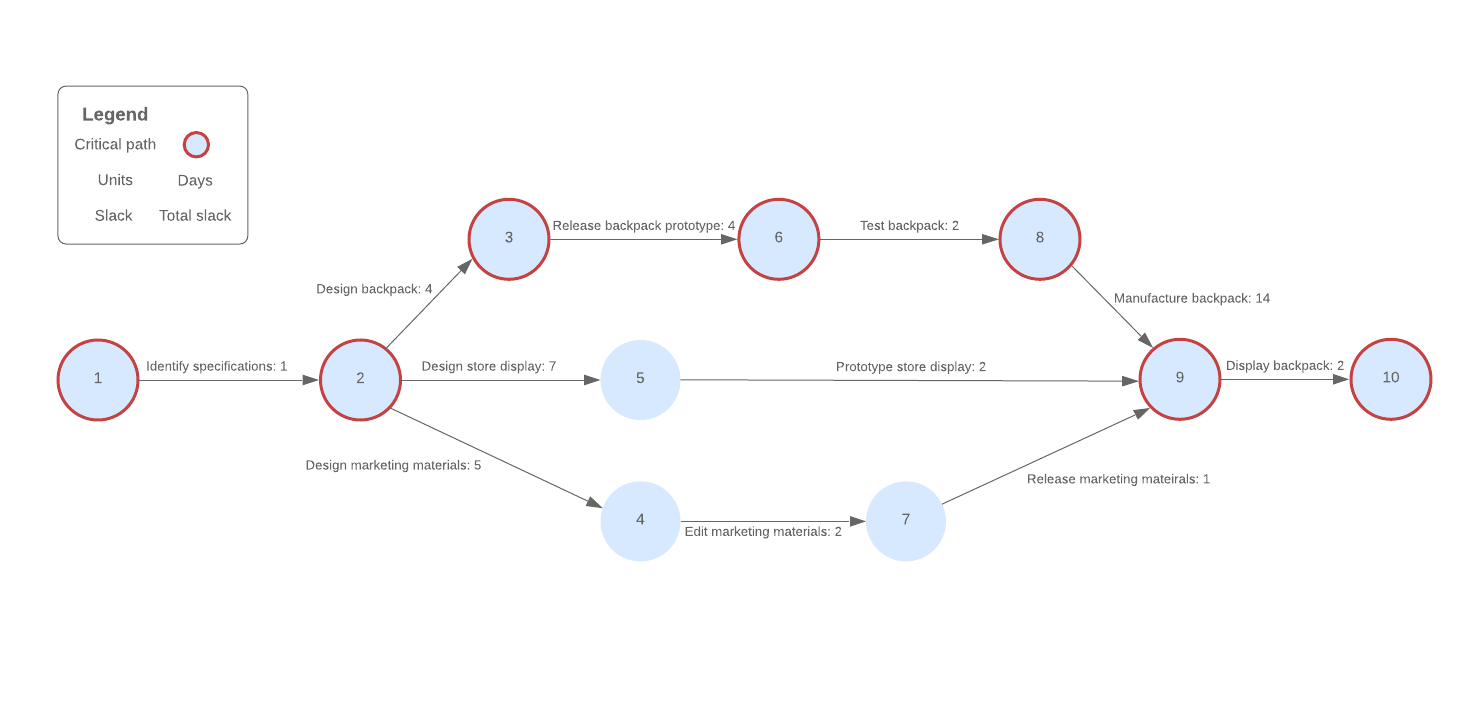
Advantages of PERT charts vs. Gantt charts
What's the difference between a PERT chart and a Gantt chart? Both of these tools can improve your project management processes. Learn when to use PERT and Gantt charts and how to create them.
Bring your bright ideas to life.


By registering, you agree to our Terms of Service and you acknowledge that you have read and understand our Privacy Policy.