
3 diagrams to make your processes more visual
Reading time: about 5 min
Process visualization helps provide another perspective of how your workflows, processes, and systems work across your team. By objectively seeing the details behind your process, your team can troubleshoot and plan changes more effectively. You can keep stakeholders in the loop and make changes that are informed by your real circumstances.
To help you visualize processes, there are different types of visuals that are particularly helpful—in this blog post we talk about three. You can adapt these diagrams to fit your organization, use cases, and teams.
Flowchart with swimlanes
Swimlane flowcharts help to visualize the interactions and connections between various aspects of a process including hand-offs from one team or department to another. With the visuals depicted in a swimlane flowchart, your team can identify inefficiencies and redundancies, bringing clarity and focus to operations and process structures.
Sometimes referred to as cross-functional diagrams, these diagrams resemble a swimming pool with marked lanes that are used to designate different sections of a process.
When would you use a flowchart with swimlanes?
Using symbols and both vertical and horizontal lines, a flowchart with swimlanes helps teams see how processes are constrained, where there are potential bottlenecks, and where processes should be cleaned up or clarified.
- Visualize complex processes: Flowchart with swimlanes are great for showing processes with multiple parties, moving parts, and contributions. You can see at-a-glance connections among different aspects of your organization while also understanding flow, transitions, and chronology.
- Depict actors or characters: Activity within your process is driven by different actors within and outside your organization. With a swimlanes chart, you can show the impact of each actor and how they keep the process moving along.
- Link events together: You can break your process down into distinct events within your diagram, yet link them together so your team understands what happens as you move from one event to the next.
Examples
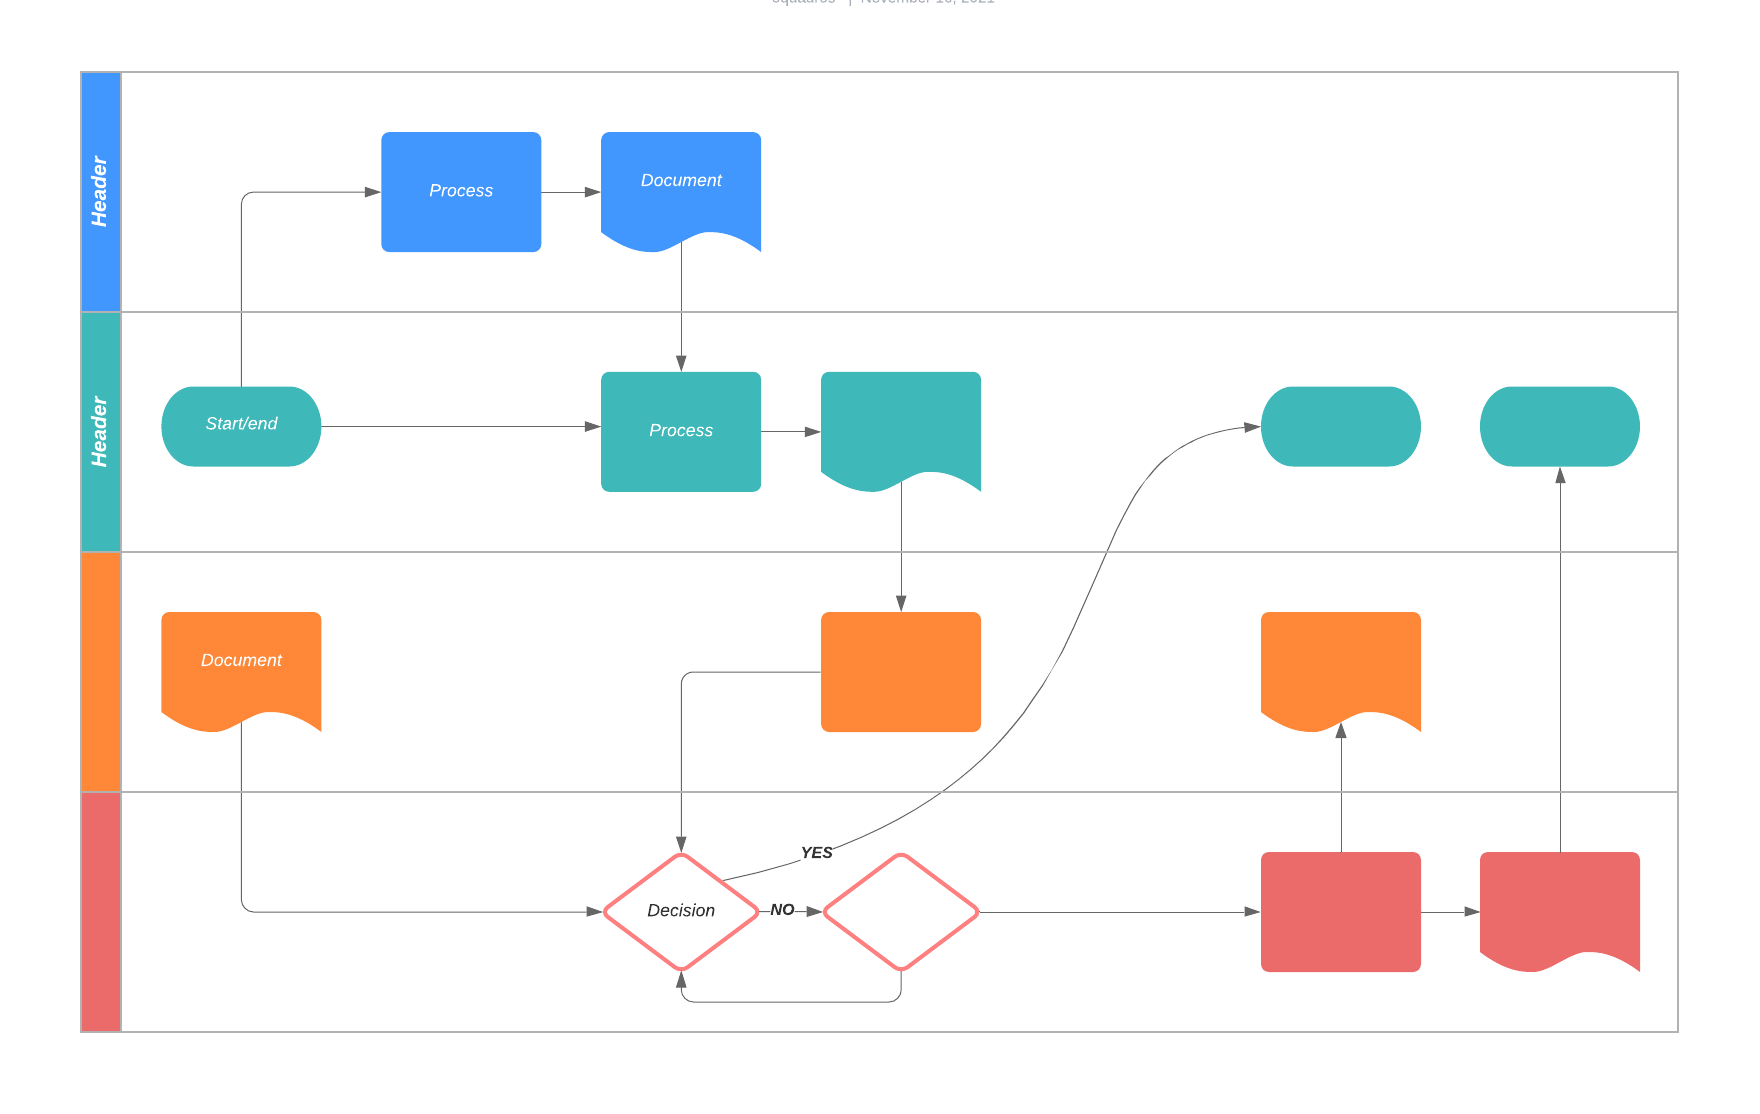
- Basic flowchart with swimlanes: Separate different departments and show one or more processes.
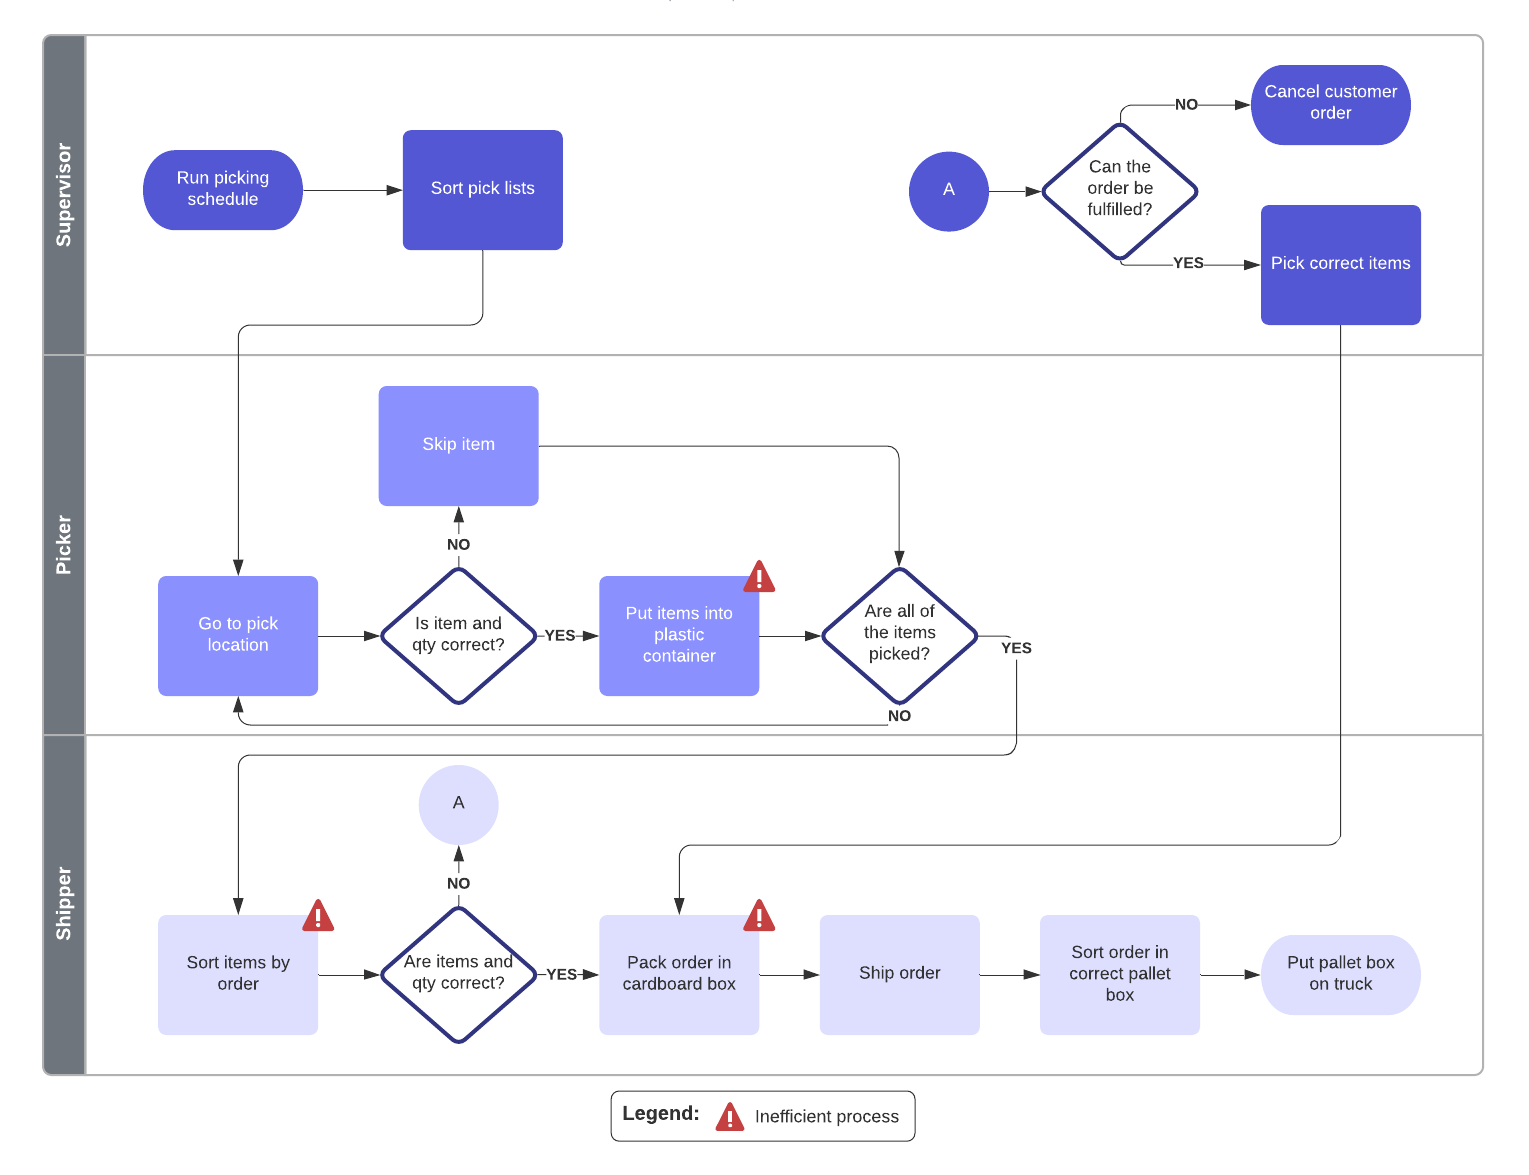
- Process flow: With a process flow diagram, you can show how responsibility and action are divided in a process.
Funnel charts
Funnels empower you to visualize data, working just like real funnels to demonstrate the transition of information through a process. A funnel can show movement from one step to another, or a narrowing down of information.
Drawn to look like a real funnel, a funnel chart shows a progression through steps. The widest part of the funnel moves to the narrowest part of the funnel, showing the starting point transitioning all the way over to the endpoint. The first stage is the largest section, followed by successively smaller stages. Not everything that starts at the beginning of the funnel reaches the end of the funnel.
When would you use a funnel chart?
Used for marketing, operations, HR, and other types and structures of information and content, funnels are easy to adapt and modify to different purposes. You can start with a template and adapt it with specific details, or you can create a funnel from scratch. Often sales or marketing contexts are where funnels really shine.
- Great for high-level visuals: Funnels are helpful places to start for high-level conversations before you begin a deeper dive into the data.
- Easy to use and understand: Funnels show clear progressions from one step to the next and are relatively adaptable.
- Adaptable to different functional areas: You can use a funnel with different departments and functions within your organization.
- Shows transitions and change: For use cases where you need to visualize a change or evolution from a starting point to the end, funnel charts are ideal. One popular use is in marketing to show the customer journey: how new prospects become more familiar with a brand, make a purchase decision, and become enthusiastic fans.
Examples
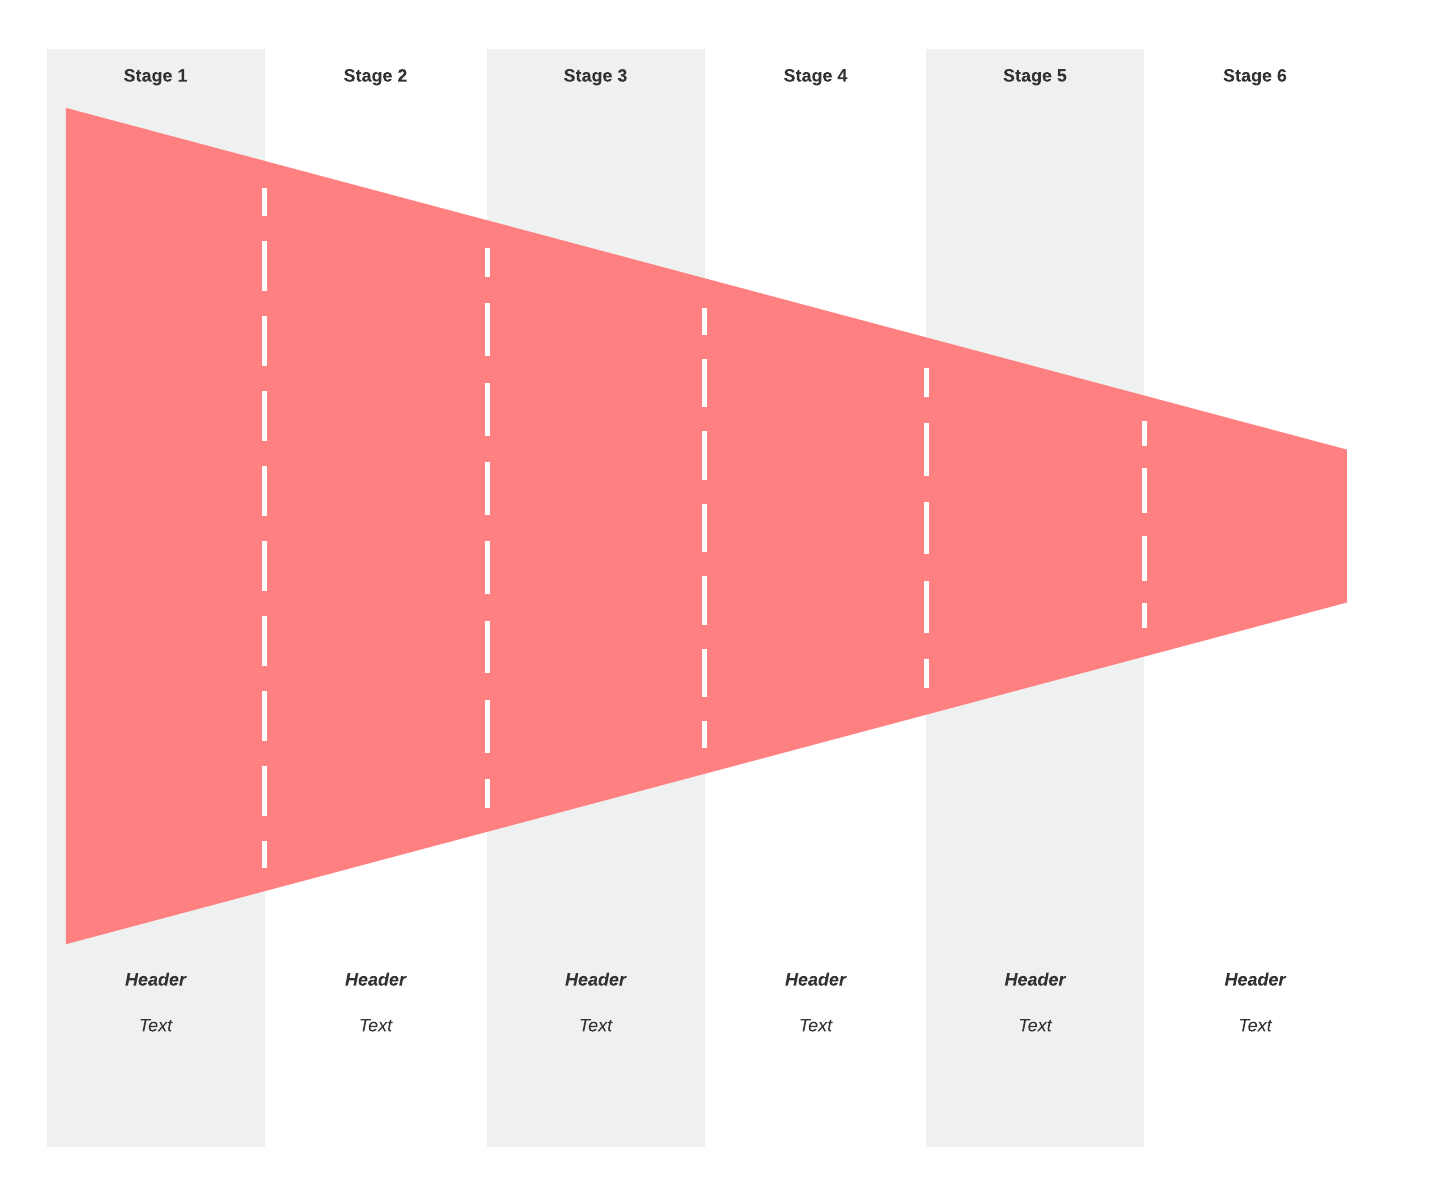
- Horizontal funnel: Horizontal funnels are great for showing transitions that are time-bound or impacted by change. For each stage from left to right, you can show which teams are involved and what happens during that part of the process.
Roles and responsibilities framework
Through a roles and responsibilities framework, you can depict how employees work and report to each other within your company or while completing a project. Team members can quickly determine who they should check in with or ask about a particular issue, simplifying the training and onboarding process. This is a helpful type of chart to create for your team and adapt whenever new people join your organization.
Working from a framework template or from scratch, you can create a roles and responsibilities framework that reflects your specific use case.
Your roles and responsibilities chart may show a hierarchy among your team members, clarifying who in the organization reports to whom and what responsibilities they hold. These charts look something like a tree or network and can include names, photos, titles, and an accompanying list of responsibilities that go with different roles.
When would you use a roles and responsibilities framework?
You can use this type of diagram for an organizational chart, help new employees understand the organizational structure of your company, and use this diagram within your human resources department to help identify gaps and challenges in your organizational structure.
Example
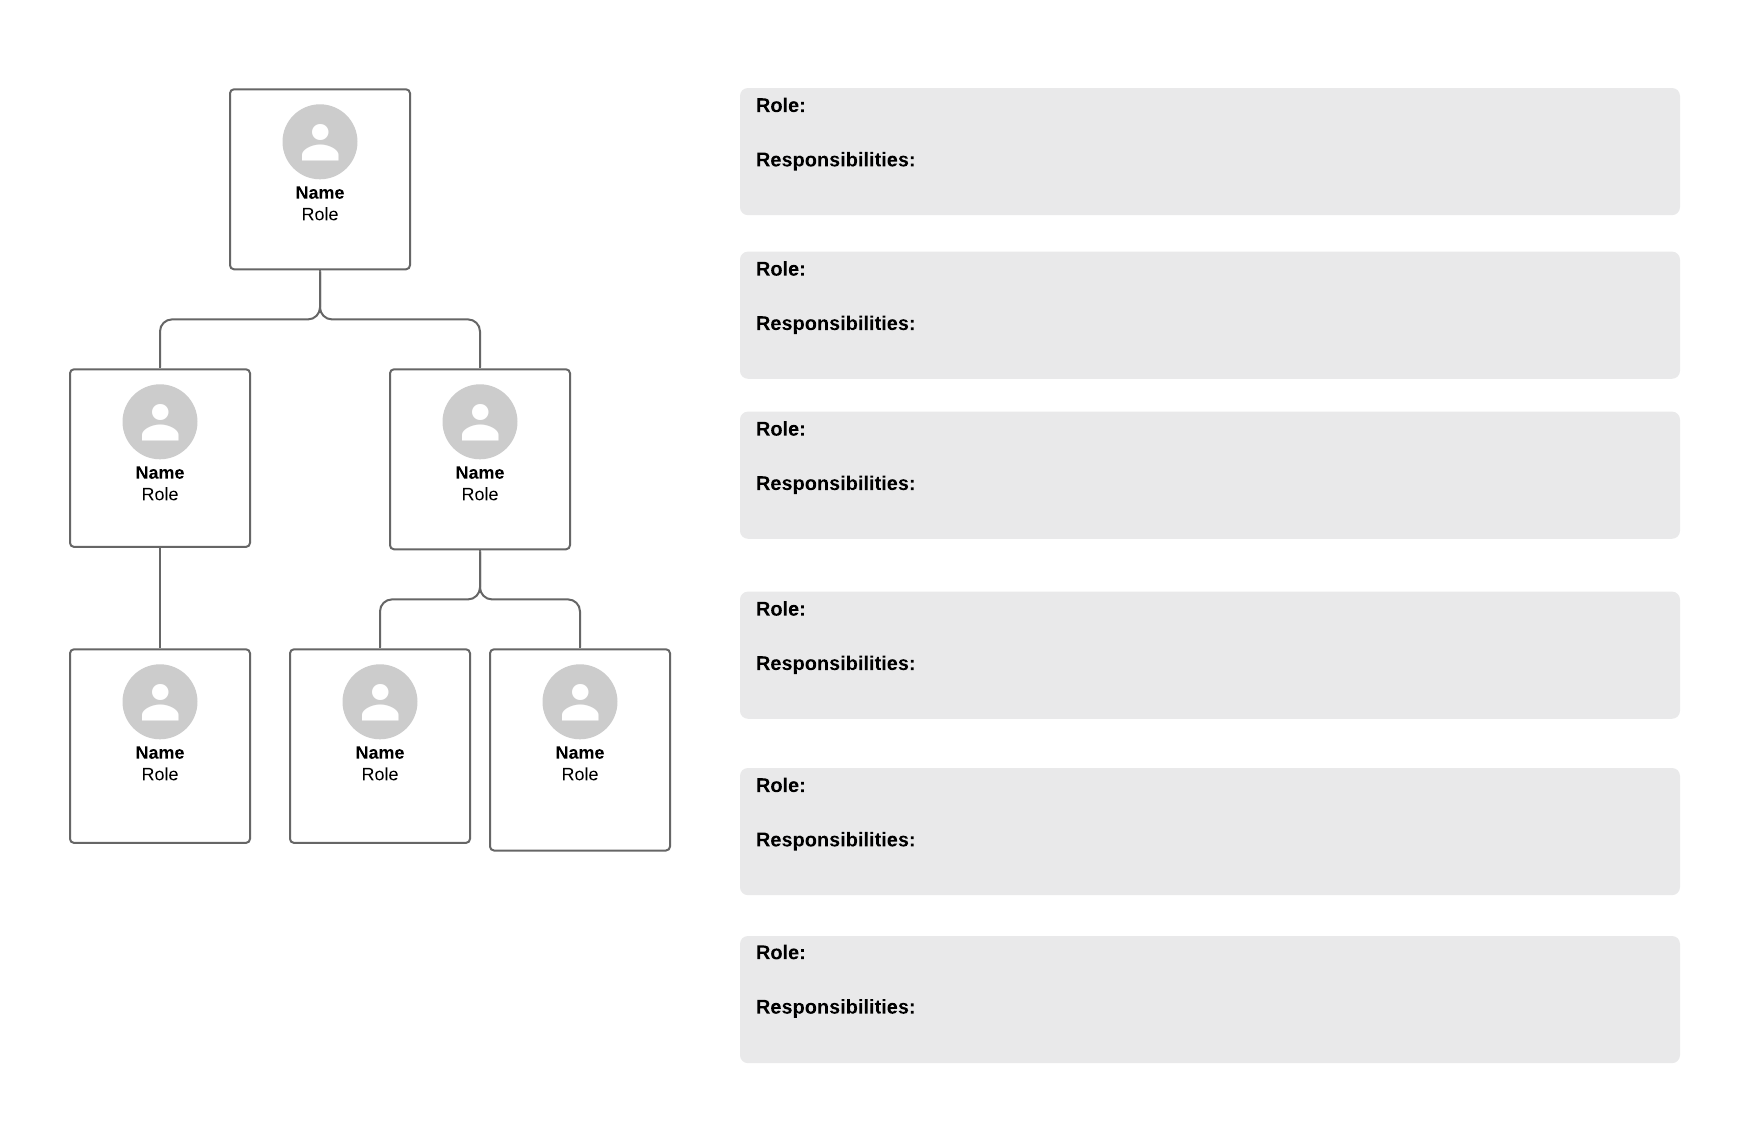
- Roles and responsibilities framework example: By visualizing the relationships between different roles, you can see how the responsibilities for each position relate to each other in this diagram.

Want access to more than 1,000 ready-to-use templates? Sign up for Lucidchart.
Sign up nowAbout Lucidchart
Lucidchart, a cloud-based intelligent diagramming application, is a core component of Lucid Software's Visual Collaboration Suite. This intuitive, cloud-based solution empowers teams to collaborate in real-time to build flowcharts, mockups, UML diagrams, customer journey maps, and more. Lucidchart propels teams forward to build the future faster. Lucid is proud to serve top businesses around the world, including customers such as Google, GE, and NBC Universal, and 99% of the Fortune 500. Lucid partners with industry leaders, including Google, Atlassian, and Microsoft. Since its founding, Lucid has received numerous awards for its products, business, and workplace culture. For more information, visit lucidchart.com.
Related articles
How to design a process infographic (+ free templates)
In this blog post, we will explain what a process infographic is and how to create your own. Includes free templates!
Bring your bright ideas to life.
By registering, you agree to our Terms of Service and you acknowledge that you have read and understand our Privacy Policy.