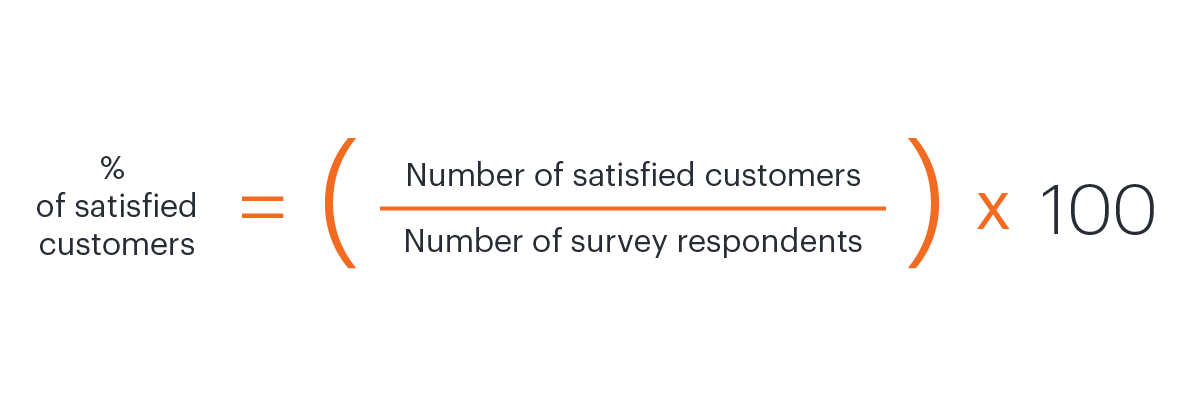
% of satisfied customers = (Number of satisfied customers/number of survey respondents) X 100
If you’re using a scale of 1-5 (as a lot of CSAT surveys do) and the answers are very dissatisfied, dissatisfied, neither satisfied nor dissatisfied, satisfied, and very satisfied , those who select 4 and 5 would be considered satisfied customers. Anyone who answers below a 4 wouldn’t count toward your percentage of satisfied customers.
3. User experience (UX) feedback
UX is an important part of how your customers use your products and services. Keeping the UX quality high means that customers can easily and effectively use your platform, install your product, put your service to use, or interact with your website. With access to real data, your teams can accurately design product updates, plan marketing campaigns, and troubleshoot user patterns.
Finding UX feedback participants
To get UX feedback, you need to determine what types of feedback you need, how you’ll measure your feedback, and how you’ll take action in response to the feedback. A great way to recruit participants who can provide UX feedback is to find super users who use your product frequently, survey your broader user base, or seek out your ideal users and invite them to help.
Keep in mind, when you need more specific users for your research, it may be harder to recruit the right participants. For example, if you want to survey C-suite users, you may have more difficulty finding the right respondents than if you are able to use feedback from your entire user base.
Designing UX research
When you know who you’re looking for, you can design research that fits your needs. If you use a survey, think about your questions carefully and how they may be interpreted. You can also use a focus group to explore UX with a targeted group of participants. Plan your research according to who you’re trying to reach, what you want to ask, and what you need to use the feedback and results for.
4. Goal Completion Rate (GCR)
This metric helps you understand how effectively your users are achieving their goals on your website or mobile app. By determining the GCR, you can find out if your online presence is actually working successfully to help your customers. A GCR may be expressed as a percentage, with a higher success rate generally being your goal.
To collect GCR information, you can invite your customers to respond on their own initiative through your website or app, or you can have a GCR survey triggered when your users try to navigate away from your site or close their browser window. In your survey, you can include a follow-up question for users who respond “no” to “Did you achieve your goal?” A simple, open-ended “Why not?” can help you decipher what is really happening when your users interact with your website.
5. Customer Effort Score (CES)
CES measures the level of effort your customers have to invest in order to interact with your company to make a purchase, resolve an issue, etc. Generally, customers are looking for low-effort, straightforward interactions, whether they are buying software, a service, or a physical product. The harder it is to buy and experience a product, the less likely they’ll stay loyal to your brand.
You can collect CES data after the purchase decision is made, either through your website or by reaching out afterward to your customers. A CES survey typically includes a scale ranging from “very easy” to “very difficult” or some other variation measuring effort.
6. Feature requests
Knowing what features your customers want is the first step towards effectively designing and implementing new offerings and updates. This information is more helpful than trying to guess what your market wants or copying your competitors’ ideas.
You can invite this feedback through surveys inside your app, platform, or website. You may also host a feature request section in your community platform if you have one. Another idea is using a feature request voting tool—sometimes, a clever idea suggested by one user is appealing enough to other users that they are happy to vote in support.
Make the most of feedback
With access to high-quality customer feedback, you can strategize and plan for how you’ll keep your customers happy and gain market share. Beyond collecting feedback, it’s even more important to put this feedback into practice and use it to make meaningful improvements.