business requirements document

Adding visuals to your business analysis doc

Lucid Content

Reading time: about 6 min

Imagine you’ve been tasked with navigating a very important ship containing valuable cargo from a port in Venice, Italy, to a port in Cape Town, South Africa. As an experienced captain, you’ve navigated this route dozens of times before, so it’s second nature to you, but your crew has never sailed to South Africa. Instead of using a map, however, you decide to adopt an unconventional new technique: you’re simply going to verbally describe the route in detail.

That’s not going to end well. And, unsurprisingly, neither will any business analysis documents that don’t include strategic visuals. Here, we’ll go over the types of visuals you should be sure to include in your business requirements documents to ensure the best outcome possible.

What is a business requirements document?

A business requirements document (BRD) details a solution for a project. For instance, if you’re planning on increasing product sales through virtual try-ons, a business requirement document would lay out a plan in detail for all stakeholders. 

A BRD normally includes:

  • Current business processes
  • Proposed business processes
  • Goals and objectives
  • Constraints and risk factors
  • The reason for implementing the solution
  • User needs and expectations
  • Deliverables required for a project’s completion
  • Personnel requirements
  • Functional requirements
  • Timeline and delivery schedule
  • Benefits and costs
  • Financial statements
  • Summary
  • Objectives
  • Scope
  • Features
  • Assumptions

This business requirements document is similar to a map: it shows where the business is currently and where it would like to go, as well as what the organization would like to achieve by taking the journey. And, just like a map, it’s much more effective when it’s an exercise in showing and not just telling.

In short, visuals make for stronger, more compelling BRDs and help communicate goals, current/future states, and proposed solutions.

There’s another issue that most of us are hesitant to talk about, but it’s real and it needs to be addressed: as a society, we no longer read the way we used to. Consider the way you’ve likely been reading this blog. You’ve probably been skipping around, missing some sentences and skimming through to get a general gist of things in the most efficient way possible. 

That same approach applies to how your stakeholders will consume your BRD. And that’s a problem because, if you’re only relying on text, a stakeholder may well miss something vital to the success of the solution. By incorporating visuals, you force the reader to stop skimming text and pay attention to the presentation in a different manner. Visuals just may be the key to getting your solution adopted and implemented correctly.

How to write a BRD

While writing a BRD is a complicated process, here’s a general overview of the steps involved:

  1. Gather information–Conduct interviews with various stakeholders to determine the correct direction for your solution and what the requirements should be.
  2. Detail key attributes–Explain what your solution should include to meet customer needs.
  3. State the scope–This is important for managing the project and avoiding scope creep.
  4. Outline the process–Describe the steps that should be taken for the solution to be implemented and how those steps tie into one another.
  5. Understand the impact–Show how processes, technology, individuals, and products will be impacted.

What kind of visuals should you be using?

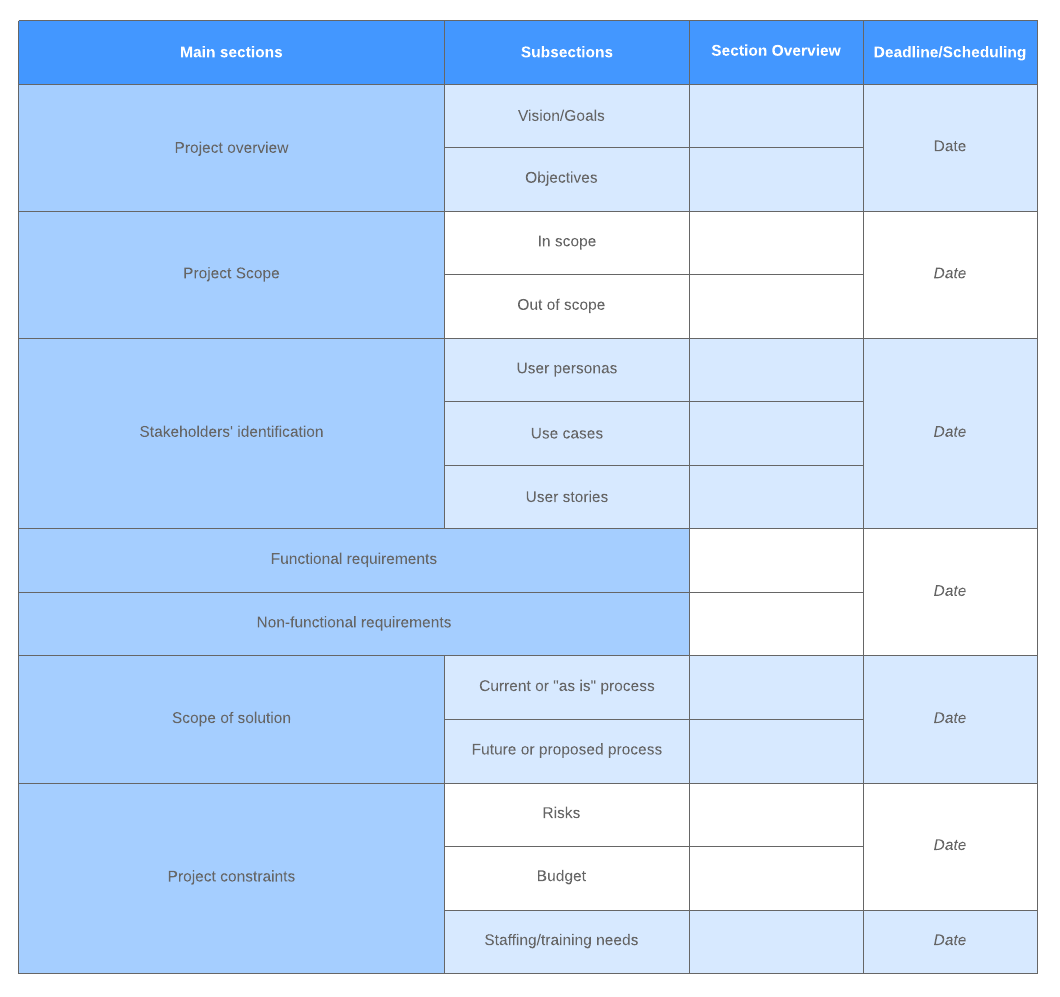
A business requirements document is customized to a specific business’s needs. With that in mind, here are some key sections to include.

BRD scope models

The scope model visually represents what is and is not part of the scope of the solution. This detailed breakdown is important because even the most seemingly easy projects are subject to “scope creep,” which can make the cost of a solution balloon. It’s much easier to visually represent this scope than rely on a pages of text. This is an important feature of your BRD because it also outlines what can’t be fixed through the implementation of your solution. This establishes clear expectations from the outset.

Here’s a helpful template to follow when organizing your BRD and establishing scope. 

alt text
Business requirements document example (Click on image to modify online)

BRD system context

The digital infrastructure of any organization is quite complex. There are email servers, cloud servers, on-site servers, document management systems, apps, hardware, and a whole host of other systems your business relies on to operate. By implementing one solution, you may find all your systems need to be altered to incorporate that one change. 

That’s where a visual representation of the intricacy of your current systems is so important. Not only can stakeholders see the interconnectivity of your digital infrastructure, they can also identify any systems that may have been overlooked, which will help avoid issues in the future.

Here’s a great template for including a BRD system context visualization in your BRD scope model.

alt text
Network security diagram example (Click on image to modify online)

Business process diagrams

This diagram shows how each of the sections of your BRD connect to each other. The business process diagram essentially shows how each requirement of the solution fits together, so a workflow diagram is helpful for this process. 

The standard for business process diagrams is referred to as BPMN—Business Process Model and Notation—a graphical representation for laying out business processes. This is a very standardized, specific regulation for execution semantics.

Here’s a useful template for incorporating a business process diagram into your BRD.

alt text
Business process flow example (Click on image to modify online)

Value proposition canvas

A value proposition canvas keeps the solution centered around the customer’s wants and needs. So, while it may be a good idea to incorporate a virtual try-on into your website, if the customer doesn’t need or value a virtual try-on, there’s no reason to incorporate it. 

A value proposition canvas includes a customer profile that outlines the following:

  1. Customer gains–What would delight customers as well as what they need and expect from a solution
  2. Pains–What negative experiences your customer may have while you implement your solution.
  3. Customer jobs–The problems your customers are trying to solve and the needs they want satisfied. 

The value proposition looks at those three factors and then positions gain creators, pain relievers, and products and services in relation to the customer profile. Once those have all been listed out, it’s easier to rank which points are most essential to add the most value to the customer. 

For an easier way of detailing your value proposition canvas, use this template.

alt text
Value proposition canvas example (Click on image to modify online)

Impact assessment diagram

This diagram outlines how your solution will impact:

  1. Processes
  2. Technology
  3. People
  4. Product
  5. Facilities
  6. Machinery
  7. Organization

An impact assessment diagram allows you to communicate the external and internal environments of an organization that will be impacted by a solution’s implementation so your business can better incorporate the solution across everything affected.

Visuals communicate so much more than text alone, and that’s especially true when it comes to business requirements documents. Using templates to visually represent each of the above sections of your BRD will go a long way to helping all stakeholders understand the solution, add valuable insights, and secure necessary buy-in. Rely on text less and utilize diagrams more to encourage those who would otherwise skim through the BRD without absorbing the sections to take their time to understand and pay closer attention to the proposed solution.

Make more informed business decisions and solve problems quickly with Lucidchart’s business analysis tools.

Learn more

Lucidchart

Lucidchart, a cloud-based intelligent diagramming application, is a core component of Lucid Software's Visual Collaboration Suite. This intuitive, cloud-based solution empowers teams to collaborate in real-time to build flowcharts, mockups, UML diagrams, customer journey maps, and more. Lucidchart propels teams forward to build the future faster. Lucid is proud to serve top businesses around the world, including customers such as Google, GE, and NBC Universal, and 99% of the Fortune 500. Lucid partners with industry leaders, including Google, Atlassian, and Microsoft. Since its founding, Lucid has received numerous awards for its products, business, and workplace culture. For more information, visit lucidchart.com.

Bring your bright ideas to life.

Sign up free

or continue with

Sign in with GoogleSign inSign in with MicrosoftSign inSign in with SlackSign in

Get started

  • Pricing
  • Individual
  • Team
  • Enterprise
  • Contact sales
PrivacyLegal

© 2024 Lucid Software Inc.