data mapping

An introduction to data mapping

Reading time: about 8 min

Topics:

  • IT and Engineering

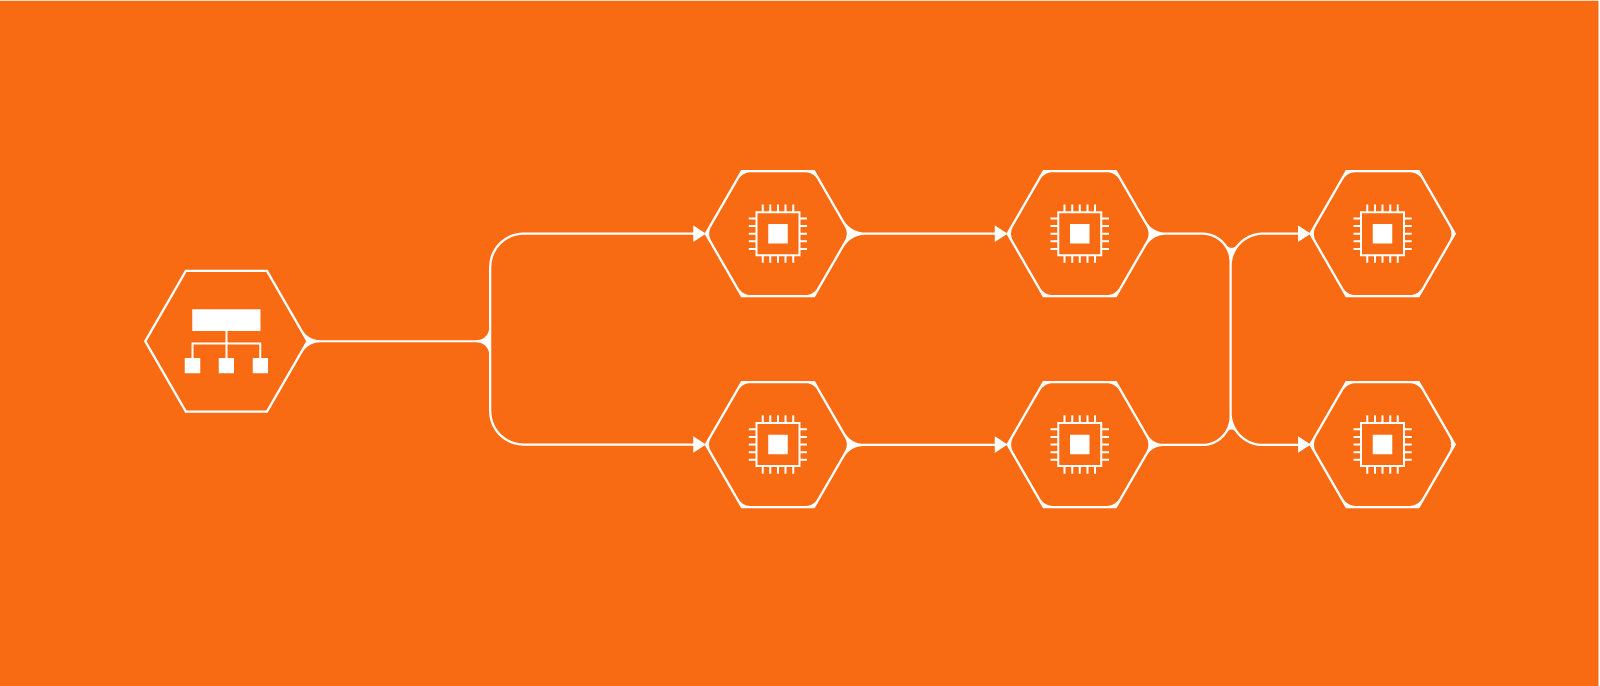
Today’s businesses run on data. In fact, the average business collects data from 25 unique sources and has 16 unique technology applications housing customer data. But with so many data sources—and the complexity and volume of the data itself— it’s difficult for different systems to read and interpret the data consistently. 

And all that data is useless (or worse, harmful) if it is poor quality or not even accessible in the first place.

Quality data is important because it helps companies to:

  • Make better decisions
  • Understand consumer behavior
  • Solve problems
  • Improve processes and procedures
  • Understand company performance

Unfortunately, poor-quality data is a common problem that costs organizations an average of $12.9 million every year. So how can you transform disparate sets of data into quality insights? This is where data mapping comes in. 

Below we’ll review what data mapping is, why data mapping is important, and how you can use data mapping tools to create functional diagrams. 

What is data mapping?

Data mapping is essential to data management. Data mapping tools can help you improve data quality and utility by accurately matching data sets from different systems to ensure it is consistent and homogenized for easy access and analysis.

One data mapping example is a source system that allows abbreviations in a state location field while the target system requires that state names are spelled out. A data map connects the common state abbreviations to the appropriate state name (CA, Calif. to California; CO, Colo. to Colorado; AZ, Ariz. to Arizona; and so on) in the target system. 

Why is data mapping important?

When managing large volumes of data from many different sources. Mapping is important because it gives you insight into the connections and relationships among various data sources. This makes it easier for you to standardize the data and consolidate it into a single source of truth. 

Standardizing and consolidating the data makes data analysis easier and more accurate because it reduces the risk of potential errors, repetition, and corrupted data, which result when the data is mapped improperly. Proper data mapping is also important for common data management tasks like:

  • Data migration: This is the process of moving data from one source to a new destination. The data is generally static and doesn’t change. The source fields are mapped to destination fields. The values and information in the destination fields become the new source of truth for the data and the original source of the data is retired.
  • Data integration: This is when data is combined from multiple sources into a single, unified view. Data is moved from one system to another on a regular basis on a regular schedule or by a triggered event. Data is mapped from the source fields to destination fields, but data is stored and maintained in both locations.
  • Data transformation: This process converts source data from one format to another in the destination. This includes setting data categories and defining the standards for naming the data field, kind of like a style guide. 
  • Data warehousing: After data has been migrated, integrated, and transformed, it can be stored in a data warehouse, a single source for accessing and analyzing the data.

How do you get started with data mapping?

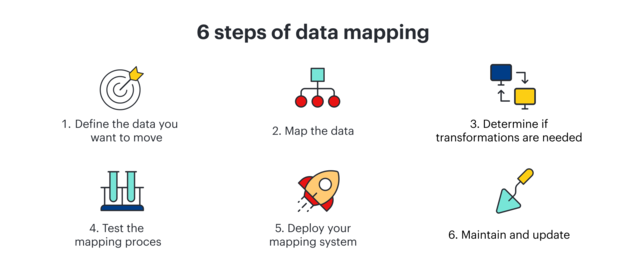
If data mapping seems like a daunting task, you can follow these steps to ease into the process. Implementing a good data mapping solution early in the data lifecycle will save you a lot of time and ensure that your data is stable and reliable.

  1. Define the data you want to move: This includes defining the tables, the fields, and the format of data that will be moved. Determine what the format of the tables and fields will be in the destination system. If you’ll be performing data integrations, you’ll also need to determine how often the data will need to be mapped.
  2. Map the data: Map the tables and fields in the source data to the tables and fields in the destination.
  3. Determine if transformations are needed: Define the transformation formula or rule that will be used in data transformations.
  4. Test the mapping process: Run some tests to make sure your mapping works like you expect it to. Test a small sample of data to begin. This will give you a better idea of how well your mapping process works. Make adjustments if problems come up and test again if necessary.
  5. Deploy your mapping system: If you’re happy with how the mapping process worked in your tests and you’re confident that everything works correctly, it’s time to deploy your data mapping system. 
  6. Maintain and update: You will need to maintain and update your mapping process as data sources change and new data sources are added.
data mapping
The six steps of data mapping

What are the benefits of data mapping?

A data map is like an index that lets you quickly and easily find where and how your company’s data is stored. So, if you need to find customer-related information, the data map lets you quickly identify where that data is located so you can retrieve and analyze it.

In addition to making it easier to find the information you need, data mapping has several other benefits:

  • Improves data sharing between departments and ensures that stakeholders have access to the information they need.
  • Improves data management and security.
  • Identifies relationships between data across different data sets and models.  
  • Gives you cleaner, higher-quality data which leads to faster and better decisions.
  • Helps you to identify and act on emerging trends.
  • Mapping to specific legal measures can help you keep your data in compliance with regulations and standards.

Data mapping tools

You can form a team of developers to manually create and maintain data maps. The team will have to code the connections that match the source data to the target destination. But you will likely be working with massive amounts of data making ongoing manual data mapping and maintenance likely too labor intensive. Luckily there are several data mapping tools to choose from to help you to automate a lot of this work.

The best data mapping software includes tools that let you create visual representations of your data maps, including the relationships, connections, and data storage. Visuals data map diagrams make it easier for everybody involved to understand the data flow and to interpret what the data is telling them.

With Lucidchart, you can create robust data mapping documents that are easily shared and interpreted, without the hassle of manual data mapping. Lucidchart has several data mapping diagram templates you can use to get started, like our Level 1 and Level 2 data flow templates or our data flow diagram (physical) example template. Plus, take advantage of features like data linking to connect your datasets directly to your data map diagrams and automatically visualize updates.

Following are some things to consider when look for the data mapping tools that are right for you:

  • Transparency for analysts and architects: The tools should provide a common, real-time view of the data being mapped. This way your analysts and architects can understand the data structure, its content, data flow, integrations, and transformations. 
  • Optimize complex formats: Data coming from many different sources can lead to compatibility problems. Your tools should be able to streamline the transformation process so complex formats are transformed accurately.
  • Facilitate changes: Data standards and formats will change. A data mapping tool should help you to ease some of the challenges that come with changing data models. In addition, the tool should let you document and track changes so you don’t lose any information. 
  • Create data maps intuitively: Visual platforms with drag and drop features like Lucidchart let you quickly and intuitively create data maps. You can use the existing templates or create your own. Maps are reusable so you don’t have to start over with every new data model.

Data mapping is essential to good data management. It will help you to get the most use out of your data, help you make better decisions, and lead to better customer experiences. 

data mapping

Explore our guide that covers everything you need to know to get started with data flow diagrams.

Go now

Here are some things to consider when look for the data mapping tools that are right for you:

  • Transparency for analysts and architects: The tools should provide a common, real-time view of the data being mapped. This way your analysts and architects can understand the data structure, its content, data flow, integrations, and transformations. 
  • Complex format optimizations: Data coming from many different sources can lead to compatibility problems. Your tools should be able to streamline the transformation process so complex formats are transformed accurately.
  • Facilitate changes: Data standards and formats will change. A data mapping tool should help you to ease some of the challenges that come with changing data models. In addition, the tool should let you document and track changes so you don’t lose any information. 
  • Create data maps intuitively: Visual platforms with drag and drop features like Lucidchart let you quickly and intuitively create data maps. You can use the existing templates or create your own. Maps are reusable so you don’t have to start over with every new data model.

Data mapping is essential to good data management. It will help you to get the most use out of your data, make better decisions, and lead to better customer experiences. 

data mapping

Learn more about how Lucidchart makes diagramming your data simple.  

Take me there

Lucidchart

Lucidchart, a cloud-based intelligent diagramming application, is a core component of Lucid Software's Visual Collaboration Suite. This intuitive, cloud-based solution empowers teams to collaborate in real-time to build flowcharts, mockups, UML diagrams, customer journey maps, and more. Lucidchart propels teams forward to build the future faster. Lucid is proud to serve top businesses around the world, including customers such as Google, GE, and NBC Universal, and 99% of the Fortune 500. Lucid partners with industry leaders, including Google, Atlassian, and Microsoft. Since its founding, Lucid has received numerous awards for its products, business, and workplace culture. For more information, visit lucidchart.com.

Bring your bright ideas to life.

Sign up free

or continue with

Sign in with GoogleSign inSign in with MicrosoftSign inSign in with SlackSign in

Get started

  • Pricing
  • Individual
  • Team
  • Enterprise
  • Contact sales
PrivacyLegal

© 2024 Lucid Software Inc.