Lucidchart Zapier integration

Visualize your data with Lucidchart’s new Zapier integration

Margaret Julian

Reading time: about 4 min

Topics:

  • Lucid News
  • Product Updates

Recently, at our largest user conference of the year, the Lucidchart team launched several new features and integrations—all with the intent to help our users see more, know more, and do more.

As part of this launch, we announced an integration with Zapier, which will help you bring live data into Lucidchart, link it to process flowcharts and other powerful diagrams, and monitor your metrics in context. Learn how to set up this new integration and how it can help you make better business decisions, no matter your role.

If you’re already familiar with Zapier, try the integration now.

What is Zapier and how does it connect with Lucidchart?

Zapier is a web-based platform that integrates with 1,500+ apps, including Google Sheets, Trello, Asana, Slack, Quickbooks, and many more. With its intuitive interface, you can connect the apps you use daily and easily automate your workflows.

Thanks to our new integration, you can bring data from Zapier’s other integrated apps into Lucidchart. Because our visual workspace is so flexible, you can build any type of diagram or visual to help you better understand information from various sources. Link Zapier to Lucidchart in order to:

  • Make decisions in context with real-time data. Include data within process maps, flowcharts, and other diagrams to identify where customers are dropping out of a conversion funnel, see bottlenecks in a manufacturing process, or make any number of important business decisions. You can even link Zapier data to dynamic shapes to visualize progress on KPIs.
  • Create a single source of truth. Now you won’t have to pull data from multiple apps every time you need an update on key performance metrics. The Zapier integration can help you see the status of an initiative in seconds and all in one place, whether you’re watching sales deals progress through the funnel or monitoring your AWS instance.

Take a look at some of our popular zap templates or explore what other apps you can integrate with.

How can you use it?

Lucidchart empowers users to accelerate understanding and drive innovation in any role—and our Zapier integration is no exception. From HR to DevOps, see examples of how you can start using Lucidchart and Zapier now.

Marketing and sales

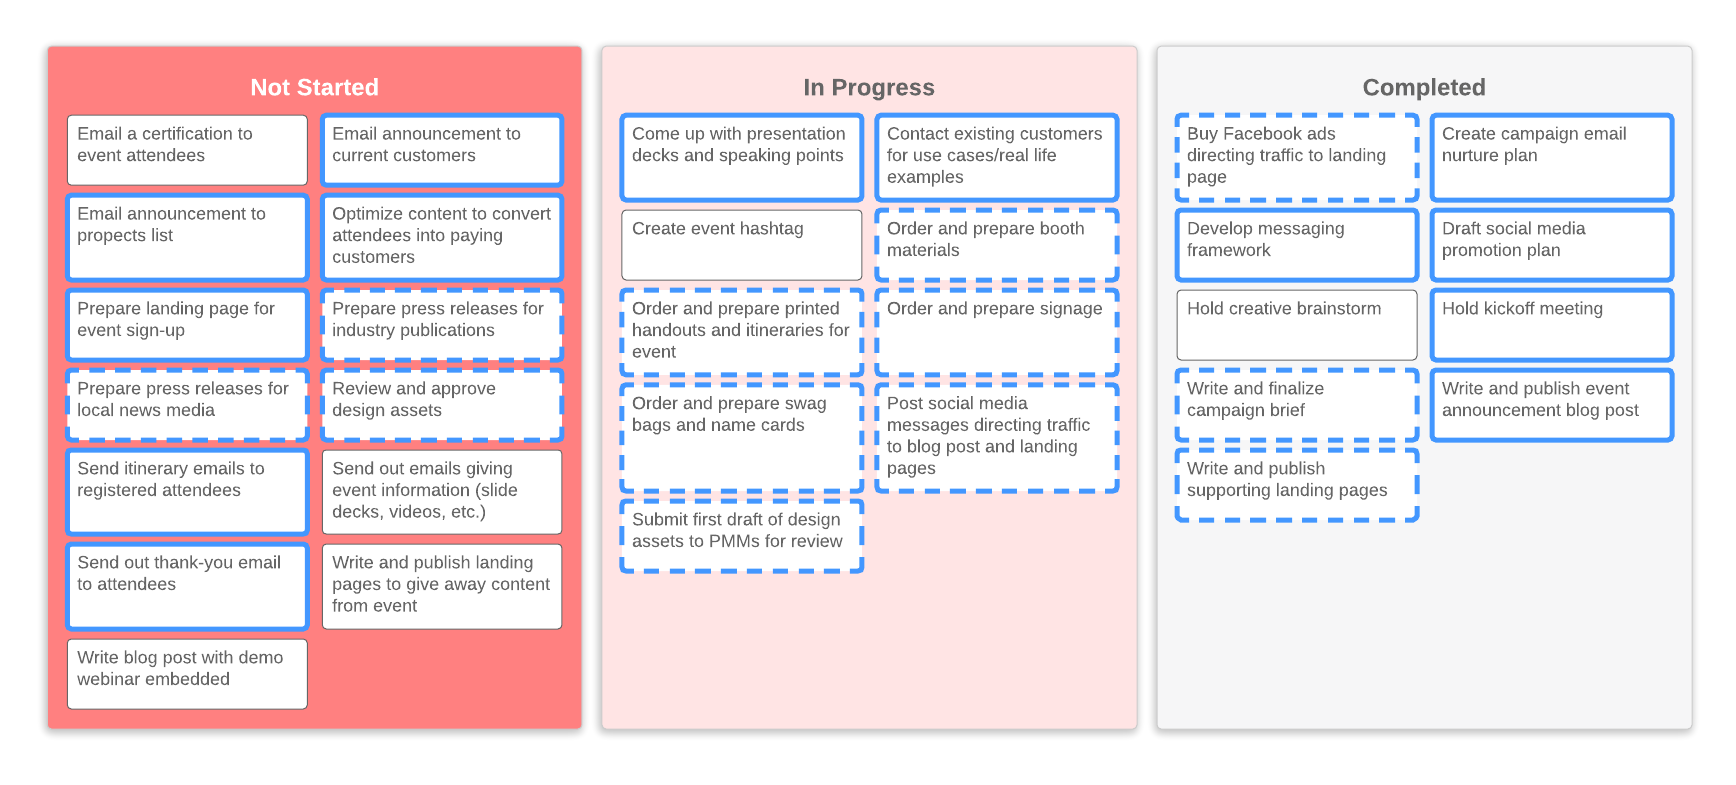
Professionals who use CRM, demand generation, email automation, or event management software can connect these tools to Lucidchart and visualize these workflows. For example, you can:

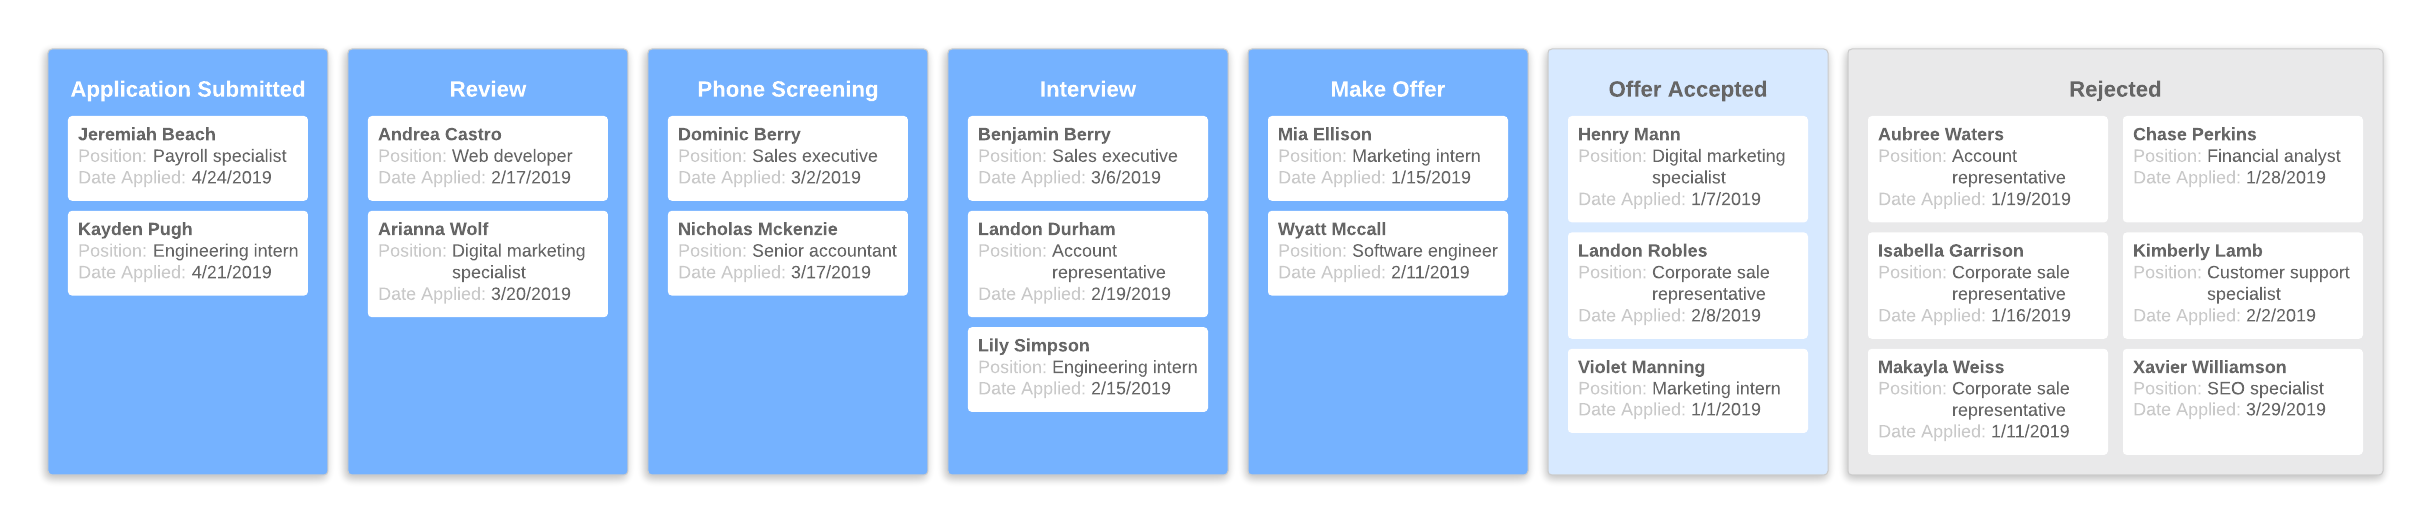
  • Link data from Salesforce, Hubspot, or Pipedrive to see customers coming through marketing and sales funnels.
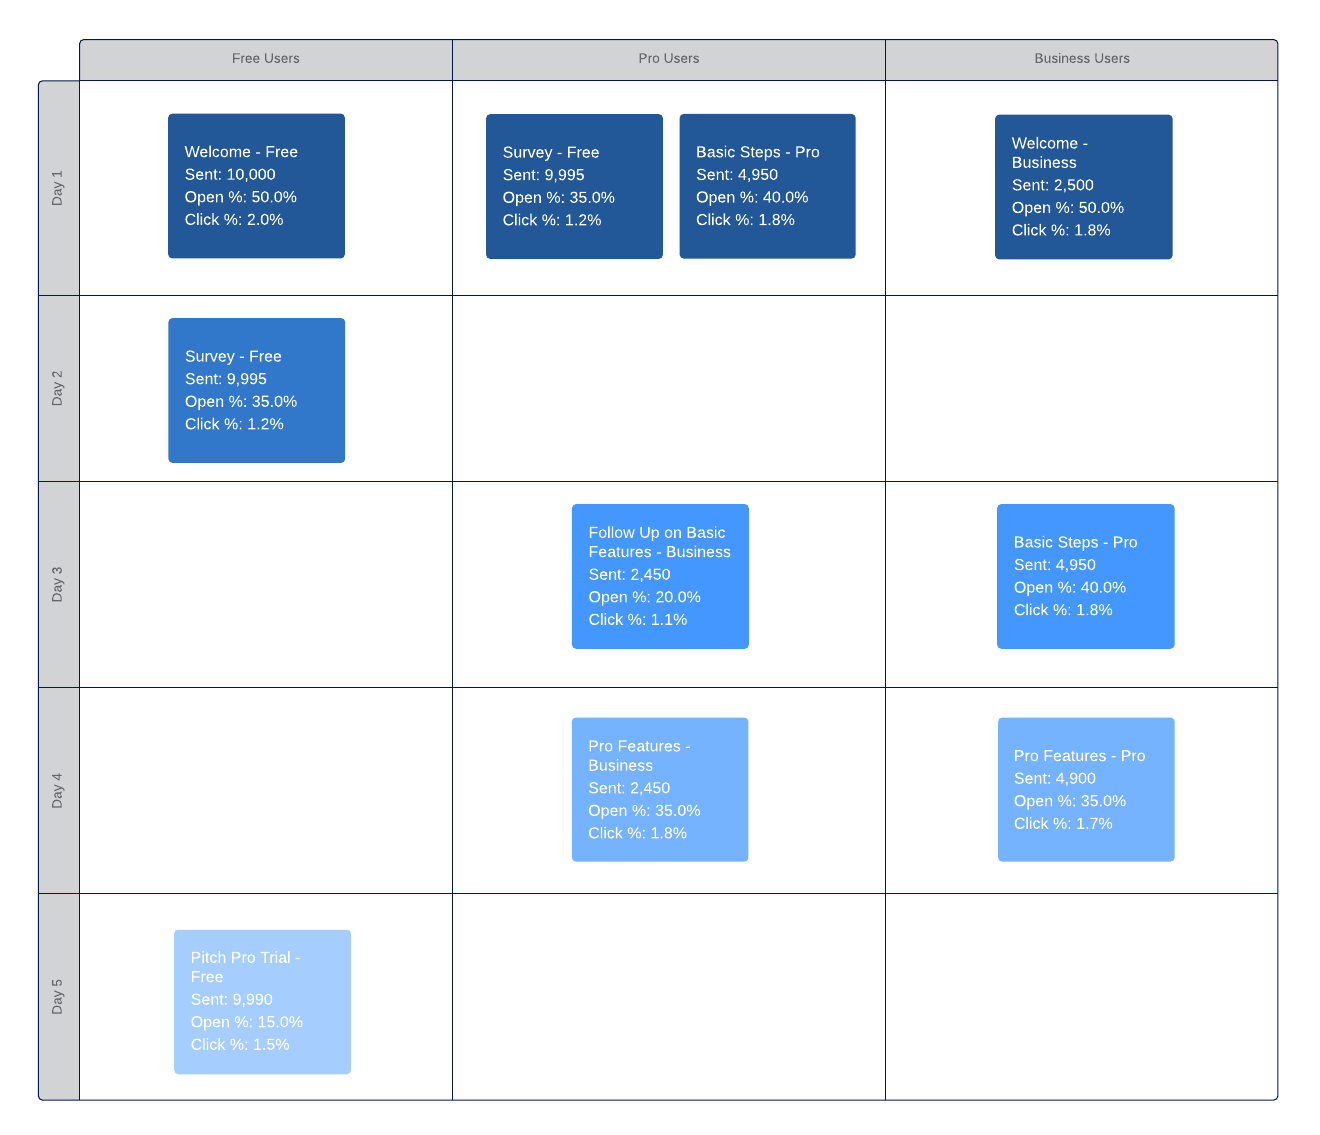
  • Diagram email flows and update performance metrics from email systems like Klaviyo or CleverReach.
email flow tutorial
Email Flow Tutorial (Click on image to modify online)
  • Connect to event management software and pull data into Smart Containers to more easily visualize incoming event registrants, task completion, or event timelines.
marketing campaign plan
Marketing Campaign Plan With Smart Containers (Click on image to modify online)

IT/DevOps professionals

Connect Jenkins to Lucidchart to create continuous integration/continuous development dashboards that can help you identify bottlenecks in workflow processes.

Visualize IT tickets by setting up zaps that connect Lucidchart to apps like ServiceNow or Jira. Track ticket status, and sort tickets by urgency, owner, or a variety of other factors to gain insights into bottlenecks or common requests.

Software developers

Connect Jira to Lucidchart—visualize tasks and issues as they come in, and sort them into manageable buckets with Smart Containers. Use conditional formatting to show status. Visualize epics and monitor them visually.

Monitor builds and jobs in Jenkins with visual dashboards in Lucidchart. Ensure that features make it through the full deployment process.

Customer support specialists

Integrate with tools like Zendesk (Premium), Freshdesk, and Intercom to manage incoming support tickets visually. Add Smart Containers in Lucidchart to sort by priority, ticket status, or other factors.

Human Resources professionals

See your recruiting funnel or onboarding process, and keep your org charts up to date by connecting Lucidchart to an HR system like Workable, Zoho Recruit, or Workday (coming soon).

hr hiring process
HR Hiring Process With Smart Containers (Click on image to modify online)

How to get started

If you’re ready to visualize your data and start taking action on it, follow these steps to set up our integration with Zapier.

  1. See which app(s) connect your data to Lucidchart or visit our app profile for some examples. (Note: Currently, Lucidchart zaps are only compatible with apps that allow you to pull data out.)
  2. If you don’t already have a Zapier account, sign up for free. Then, select “Make a zap.”
  3. Select the app you want to send data from, and set up a trigger.
  4. Select Lucidchart as your action app, and indicate how you would like Lucidchart to manage the incoming data.
  5. Connect your Lucidchart account to Zapier. From there, you can visualize your Zapier data by linking your incoming data to processes, linking data to dynamic shapes, or adding data to Smart Containers.

For more in-depth instructions, please visit our Help Center.

About the author

Margaret Julian profile picture

Margaret Julian is our content marketing manager at Lucid. An MBA graduate from Brigham Young University, Margaret is passionate about content, branding, and product marketing strategy. In her free time, Margaret dances, hikes, reads, and experiments with new ways to incorporate chocolate into any recipe.

Receive product tips and expert advice straight to your inbox.

Subscribe to our newsletter

Get started

  • Pricing
  • Individual
  • Team
  • Enterprise
  • Contact sales
PrivacyLegalCookies
  • linkedin
  • twitter
  • instagram
  • facebook
  • youtube
  • glassdoor

© 2023 Lucid Software Inc.