Introducing the future of Lucidchart
Lucid Content
Reading time: about 6 min
Our users repeatedly tell us why they love Lucidchart: It allows them to see more, so they can know more, so they can do more. At our largest user conference of the year in San Francisco, we took the opportunity to announce to more than 300 of those users the next era of Lucidchart.
We’re constantly upgrading Lucidchart’s core diagramming and collaboration abilities, but now we’ve added a whole new element to give you a better view of your business than ever before: our visual reasoning engine that powers Lucidchart data visualization, data integrations, and automation. Our goal is to combine diagramming, collaboration, and now data visualization to accelerate understanding and drive innovation at your organization.
At our user conference, we released new features and integrations powered by our visual reasoning engine which are designed to give you the elevated perspective that drives better decisions in every area of business. Here’s a summary of what’s new and next in Lucidchart.
Visualize information from other systems with our Zapier integration
In order to do more, you need to be able to visualize and interpret the data coming from the systems you live in every day. Once you can visualize this information, it becomes actionable—which is why we’re always adding new integrations with leading tools and applications. In San Francisco, we pulled back the curtains on an exciting new data integration with Zapier!
This integration allows you to connect Lucidchart to 1,500+ other web services so you can automate your work and maximize productivity. Automated connections called Zaps are set up in minutes with no coding and can automate your day-to-day tasks and build workflows between apps that otherwise wouldn't be possible. Using this integration, you can monitor your most important metrics visually, show data in the context of a process, and bring live data into Lucidchart.
Learn more
Zapier is joining the line up among our existing data integrations that allow you to harness the power of Lucidchart to enrich the applications you’re already using. Here are a few of those integrations helping you do more with your data:
-
Salesforce: Automatically import your Salesforce contacts into Lucidchart and drag and drop them onto the canvas to build powerful account maps and find the best path to sale.
-
BambooHR: Import your BambooHR data and generate professional org charts so you can visualize new reporting structures or plan for new people and projects.
-
Google Sheets: Import data sets to create powerful, data-driven visualizations. Lucidchart automatically syncs updates to your spreadsheet data into your visualizations.
Save time and diagram effortlessly with automated layout
Our visual reasoning engine auto-generates diagrams for you according to your specifications. Spend less time creating and more time taking action on the new insights you discover. Here’s what’s new with autolayout.
Smart containers
Ditch the static spreadsheet rows for smart containers to make smarter decisions faster. This feature helps you sort through information to gain the clarity you need to move forward. Import any spreadsheet and group the data into specific categories, or drag and drop empty smart containers onto the canvas and create your own shapes to create categories. For example, group your project plans by task priority or your sales deals by deal stage. And don’t worry about creating and aligning shapes yourself—Lucidchart automatically creates shapes from your data and organizes them by group.
Group view for org charts
Take the beauty of smart containers to your org charts. Group the shapes in your org chart by any field in your data set, or manually group employees in smart containers to organize new cross-functional teams. You can group employees by location or seniority to identify staffing needs and fill those gaps, or you can visualize cross-functional teams outside of the traditional reporting structure, such such as tiger or scrum teams.
See your data in context
Data visualization powered by our visual reasoning engine allows you to get to better insights faster by seeing your data in the context of your ideas, systems, and processes already documented in Lucidchart.
Dynamic shapes
Visualize data, show progress or status, or create dashboards in Lucidchart using our new dynamic shapes! You can show progress, completion, or growth with our dynamic shapes library. This new feature allows you to monitor your most important metrics visually, show data in the context of a process, and bring live data into Lucidchart.
Data API (COMING SOON)
We will be exposing our API and releasing full API documentation so that you can bring in data from outside systems into Lucidchart.
Diagram smarter
We haven’t forgotten our bread and butter amidst all the new bells and whistles. We’ve got exciting updates when it comes to our diagramming and collaboration capabilities.
Microsoft Teams integration
Turn your conversations from text to visuals by creating and collaborating on diagrams without leaving the Teams interface. Keep your team connected and collaborate visually on the ideas and projects that move your business forward.
Learn more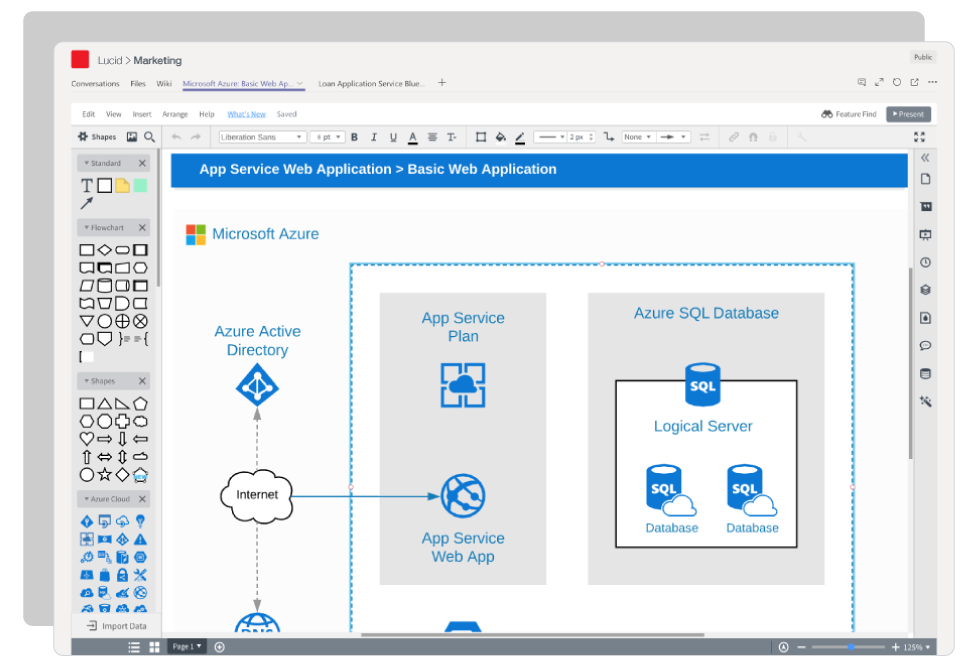
Extended template gallery
Our template library now offers over 500 templates designed to help you get the most out of Lucidchart—you name your use case, and we’ve likely got a little something to help you get started. Save time by using a template rather than building from scratch, or browse our library simply to get inspiration specific to your role. Templates now include brief tutorials and links to additional resources.
Template recommendations (COMING SOON)
We will soon be using machine learning to provide template recommendations based on your job role and use of Lucidchart.
New G Suite add-ons for Gmail and Calendar (COMING SOON)
This integration will allow users to easily incorporate Lucidchart documents into their emails. They can view Lucidchart documents, insert them or attach them as PDFs in emails, add or manage collaborators, and see Lucidchart notifications—all without leaving Gmail or Google Calendar.
If you’re a business analyst, you need to visualize a process to understand what is working and what is not so you can optimize it. If you’re a sales rep, you need to see the big picture of your account in order to understand who the promoters and detractors are to get to the right decision-makers. The need for insight is applicable to any role within an organization—and the future of Lucidchart provides this bird’s eye view. Check out all our exciting new features to see how they can help drive success across your org.
P.S. If you want a closer look at Lucidchart’s vision, check this out!
About Lucidchart
Lucidchart, a cloud-based intelligent diagramming application, is a core component of Lucid Software's Visual Collaboration Suite. This intuitive, cloud-based solution empowers teams to collaborate in real-time to build flowcharts, mockups, UML diagrams, customer journey maps, and more. Lucidchart propels teams forward to build the future faster. Lucid is proud to serve top businesses around the world, including customers such as Google, GE, and NBC Universal, and 99% of the Fortune 500. Lucid partners with industry leaders, including Google, Atlassian, and Microsoft. Since its founding, Lucid has received numerous awards for its products, business, and workplace culture. For more information, visit lucidchart.com.
Bring your bright ideas to life.


By registering, you agree to our Terms of Service and you acknowledge that you have read and understand our Privacy Policy.