Create architecture diagrams with Lucid
As you try to visualize your cloud architecture, it’s easy to do with Lucidchart. Whether you're making the transition to the cloud, meeting PCI compliance, or just putting together a visual reference, architecture diagrams built using Lucidchart can help streamline the process.
Lucidchart offers two ways to create architecture diagrams: manually or automatically.
You can create your diagram using the auto-layout option with Lucidscale, or you can manually build your diagram with a standard Lucidchart account.
Manually build architecture diagrams
If you don’t have Lucidscale, you can still build AWS architecture diagrams in Lucidchart.
Get started with templates
Get started with any of the dedicated AWS architecture templates in the template gallery. Pick from any use case, including blank templates, AWS CI/CD pipelines, AWS Magento hosting, and more.
Manually drag and drop
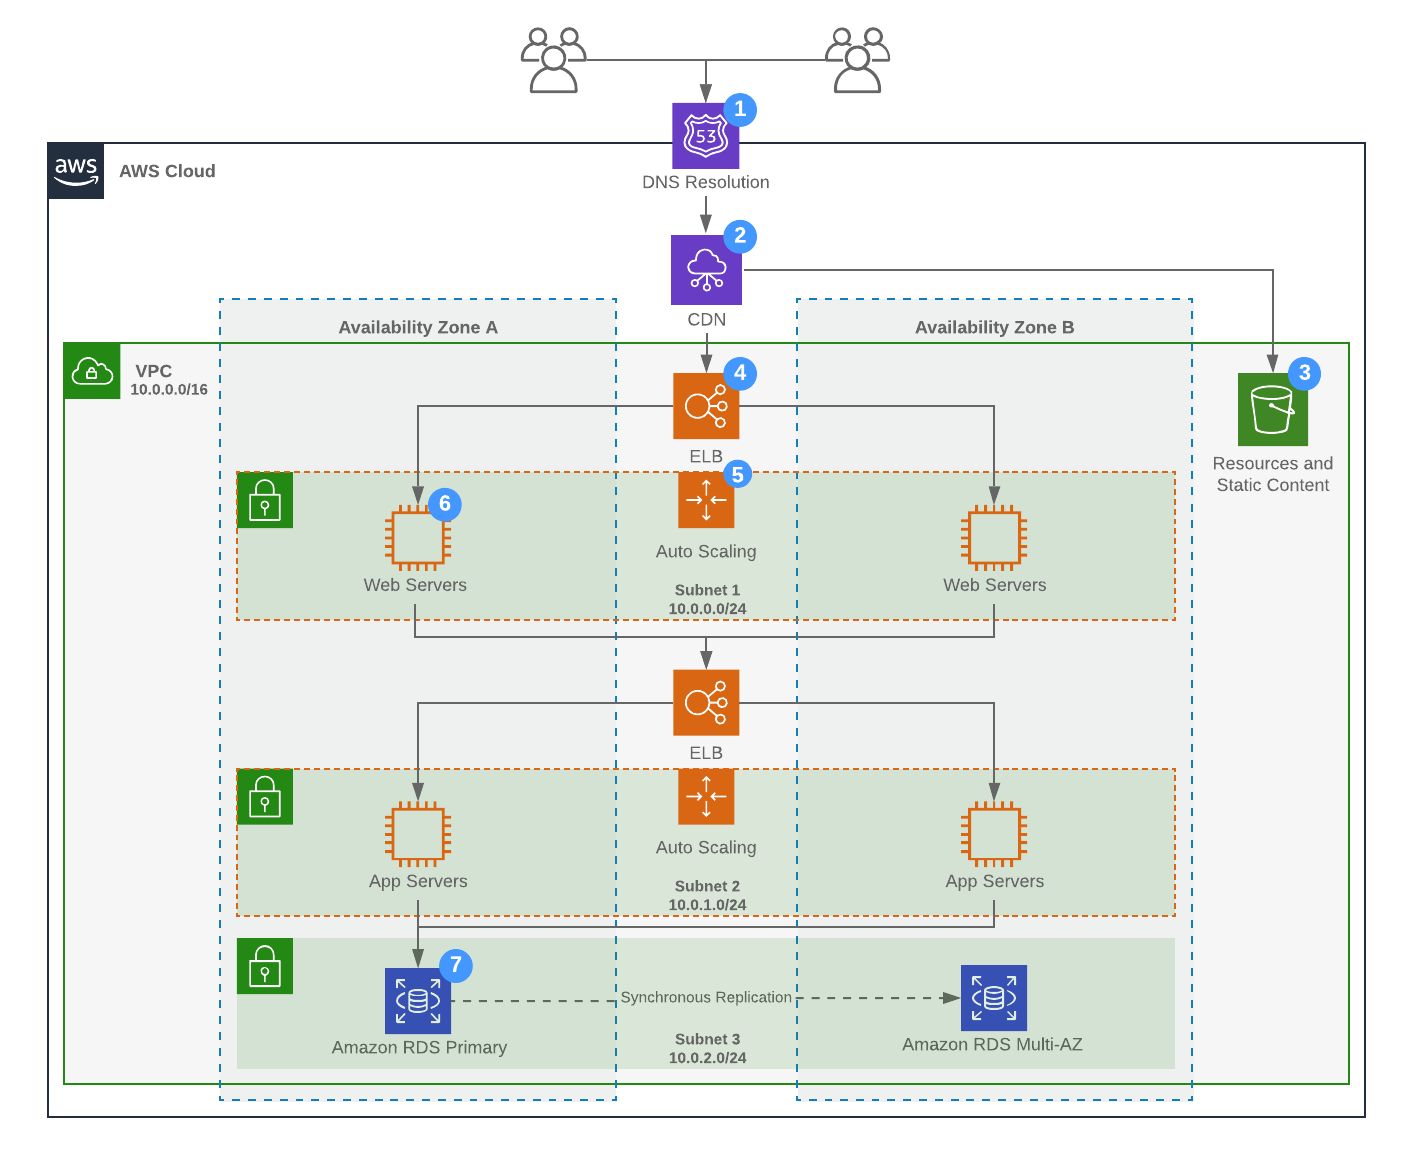
If you know exactly what you need your diagram to look like, simply drag and drop your containers, regions, VPS, availability zones, and other resources, such as EC2 instances, auto-scaling groups, and more, on to the canvas from your toolbox.
Use industry-standard icons
Lucidchart comes complete with industry-standard architecture icons, with dedicated shape libraries for AWS, Google Cloud, Azure, and Kubernetes. This way, you can be sure your diagram accurately represents your environment.
Draw relationships
After you’ve finalized the number and order of shapes on your canvas, from there, you can manually draw lines to represent logical relationships between resources so you can understand the flow of information and interaction among different AWS services and resources.
Plan future states
As you finalize your current state AWS diagram, you can plan the future state of your cloud environment with Layers. Lucidchart Layers allow you to overlay multiple elements of a diagram and control which ones are seen at any given time. This way you can easily visualize your plans for the future without losing site of what exists today, including potential limitations.
Automatically generate architecture diagrams
Lucidscale is the superfood of architecture diagramming. It offers advanced functionality as you create, maintain, and iterate on your cloud diagrams.
Access, apply, and refresh data
Connect to your cloud provider with just a few clicks: After connecting to your cloud provider data, in minutes, Lucidscale generates a diagram based on your live infrastructure.
From there, Lucidscale further simplifies how you view your data. Simply select a resource in your architecture diagram to access all the data linked within on that resource. You can view—or even add—data directly to your AWS diagram, such as tag names, IP addresses, or any other metadata that will make the diagram easier to read and understand.
Keeping cloud architecture diagrams up-to-date is no longer a difficult task. As you implement changes to your infrastructure, all you need to do is refresh the data backing your diagram and any changes will be reflected in the visuals, and even updated in your Confluence wiki pages.
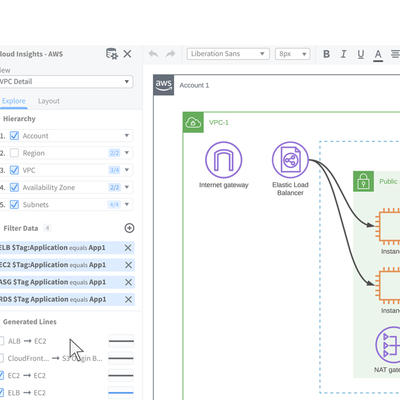
Filter to remove unnecessary information
As Lucidscale automatically generates your cloud diagrams, it’s backed by metadata brought in from your cloud provider, allowing you to create and save multiple views. Remove unnecessary details, filter by criteria, such as AWS tags or subnets. Draw lines based on relationships between resources, and then save your views for future use.
Lucidscale comes with standard views so you can see infrastructure through network rules, or as an overview of accounts, regions, and VPCs. The overview view can help you quickly see how accounts, regions, and VPCs are set up, including VPC peering, all with just a few clicks!
Streamline feedback and review
After you finalize how to draw architecture diagrams that best reflect your network system, your next step is to communicate and solicit feedback with stakeholders, cloud engineers, and AWS solutions architects.
Lucidchart streamlines these communication processes. First, Lucidchart is built in the cloud so you can work from anywhere, with anyone, and on any device or operating system, including Windows, Mac, and Linux.
Secondly, you can provide feedback directly in Lucidchart and point collaborators to any element of your AWS infrastructure diagram with @mention notifications and commenting features so you can direct architects or developers to exactly where action needs to be taken.
Then, embed your diagram on a wiki, use presentation mode, share a URL, or integrate your diagrams into Google Slides, Atlassian, Confluence, and Slack.
Identify better solutions with layers
It’s safe to assume most companies are trying to improve. Even after your first migration to AWS, you will likely try to improve your architecture as time goes on, whether it’s reducing downtime, increasing performance, or EBS and EC2 optimization.
Lucidscale generates a diagram backed by your cloud data, making that particular diagram non-editable. However, you can actually create an editable copy of your Lucidscale diagram in Lucidchart document, then build your current and future state architecture diagrams using layers in Lucidchart.
This way, you can identify weaknesses in your network, and make plans to optimize. As you make changes, layers allow you to track the changes you’ve made over time, easily visualize current state vs. future states, and achieve alignment.
Present clearly to stakeholders
Being able to communicate complex systems with all stakeholders is critical, whether the communication is between team members, incident response teams, development teams, or leadership.
Leverage all the existing collaboration and communication features currently built into our visual workspace.
- Show specific parts of the diagram using presentation mode.
- Share the diagram with others, assigning different levels of permissions.
- Comment and @mention users on specific shapes to focus attention and take action where it’s needed.
Visualize your networks and get the most out of your AWS experience with Lucidchart and Lucidscale today.