Better ways to monitor and communicate your project's progress
Lucid Content
Reading time: about 7 min
As a project manager, you are often walking the fine line between detailed analysis and the bird’s-eye view. The layers and complexity of today’s modern projects can make monitoring pretty challenging.
There are ways to make it easier though: Your approach to tracking project progress needs to be collaborative, transparent, and timely.
Difference between a project strategy and a communication plan
Your project strategy will likely develop pretty naturally—there is almost always a plan for how to get the project done. But your communication plan takes a bit more effort and deliberation.
Your communication plan isn’t about how you will get the project done but who you will communicate project progress to. Before you begin monitoring your project, you will want to know both the overarching project strategy and communication plan. The approach for both will impact what you monitor and how frequently you report it.
Project monitoring is an essential but admittedly complicated piece of the puzzle. There is often more than one project to monitor, and each project has a lot of sub-levels to it that need to be managed.
Then there are the people. It’s impossible to monitor progress without the cooperation of team members and stakeholders, but because everyone is busy, it can be difficult to get updates. Project managers often default to weekly meetings to obtain updates quickly; however, this tends to take up valuable time that could be used for execution. And if you don’t have the full attention of attendees, you may still end up missing essential information.
If you have weekly meetings, there should already be some updates in place so that the time can be used to clarify gray areas, align on next steps, and generally move things forward.
Smart monitoring can set the stage for easy communication and better implementation of the project strategy. You can create better monitoring by setting up a process for collecting data easily, identifying challenges and opportunities early on, and sharing key takeaways that are easy to understand for both your team and your stakeholders.
How to monitor and communicate progress
To monitor projects, you’ll want to start with determining what you will measure. Work with your manager to align on key objectives and success metrics for the project.
Also, take some time to determine what data will be important for project progress reports and what data will be important for postmortem reports. Examples of important data include time to completion, budget, scope creep, and risk assessment.
Once you know the key objectives and main metrics, you can focus on critical points in your timeline: What are the key dates that must be met? What dates cannot be moved? And where are the dependencies? These are the dates you will want to share with team members so they have clear milestones to work toward.
Identify specific intervals for when you’ll monitor the project
You can use your key dates for the next step in setting up your monitoring approach: determining the intervals for team check-ins.
It typically won’t be necessary to monitor a project every hour, but your critical dates will help you figure out how often you’ll want teams to check in. You’ll also want to set a schedule for updating stakeholders so that they know ahead of time when your projects will need their input.
Decide how to collect data
You’ll need team cooperation to get useful information when you are monitoring projects. Set the expectation in the kickoff phase that you will need updates from team members. Explain the importance of giving timely information and how that information will be used to keep the project on track as a whole.
Ease of use is essential to get the updates you are looking for—ideally, you employ an interactive tool that makes updates quick and easy for team members to share. Lucidchart has a number of collaborative and data visualization feature that allow for real-time updates, shareable formats, and transparency so that everyone is aligned on where the project is and what’s needed next.
Clarify and adjust expectations
Projects typically have a few twists and turns that require more direction from the project manager. The teams will want to know how new developments impact projects and priorities. You can use interactive visuals to illustrate how projects may change in terms of scope and timing. You can also use visuals to communicate any steps in the process that now become more urgent or more critical.
Having these tools at your disposal can also help with one of the major challenges of project management: getting people to respect deadlines. If team members clearly understand how missing a deadline impacts the project as a whole, they will be more likely to try to stick to the timeline, especially if missing the deadline results in more work or less time for them to complete another step in the process.
If you’re working with the same team on multiple projects, visuals can also help significantly in communicating which projects are a priority, which have more slack, and which are related or share dependencies. That way, teams can juggle multiple assignments more adequately.
Select the right tools
As complex as projects are these days, it’s important to have the right tools that can help you communicate quickly, effectively, and in real time.
Spreadsheets are often a go-to for project monitoring, but they aren’t very useful if the information isn’t up to date. Interactive spreadsheets that have a collaborative element can ensure your updates are current and the information is reliable for stakeholders and team members. Lucidchart offers templates for collaborative data management that allow people to work simultaneously on updates and talk through potential scenarios.
There are also a number of applications that are commonly used for project management, but they don’t always clearly identify the key takeaways for stakeholders. While those tools are great for putting data in, they aren’t so great at pulling key takeaways out.
Data visualization and intelligent diagramming applications can integrate with your current programs to help you take the information you already have and illustrate it for stakeholders so that they can more easily provide feedback.
Project tracking diagrams
Part of monitoring projects is identifying the key takeaways of how your project is progressing according to time, costs, and quality. But whenever you’re dealing with lots of information, you need ways to help your audience easily see the main point.
Here are a few common visuals that can be used to help you monitor your projects effectively:
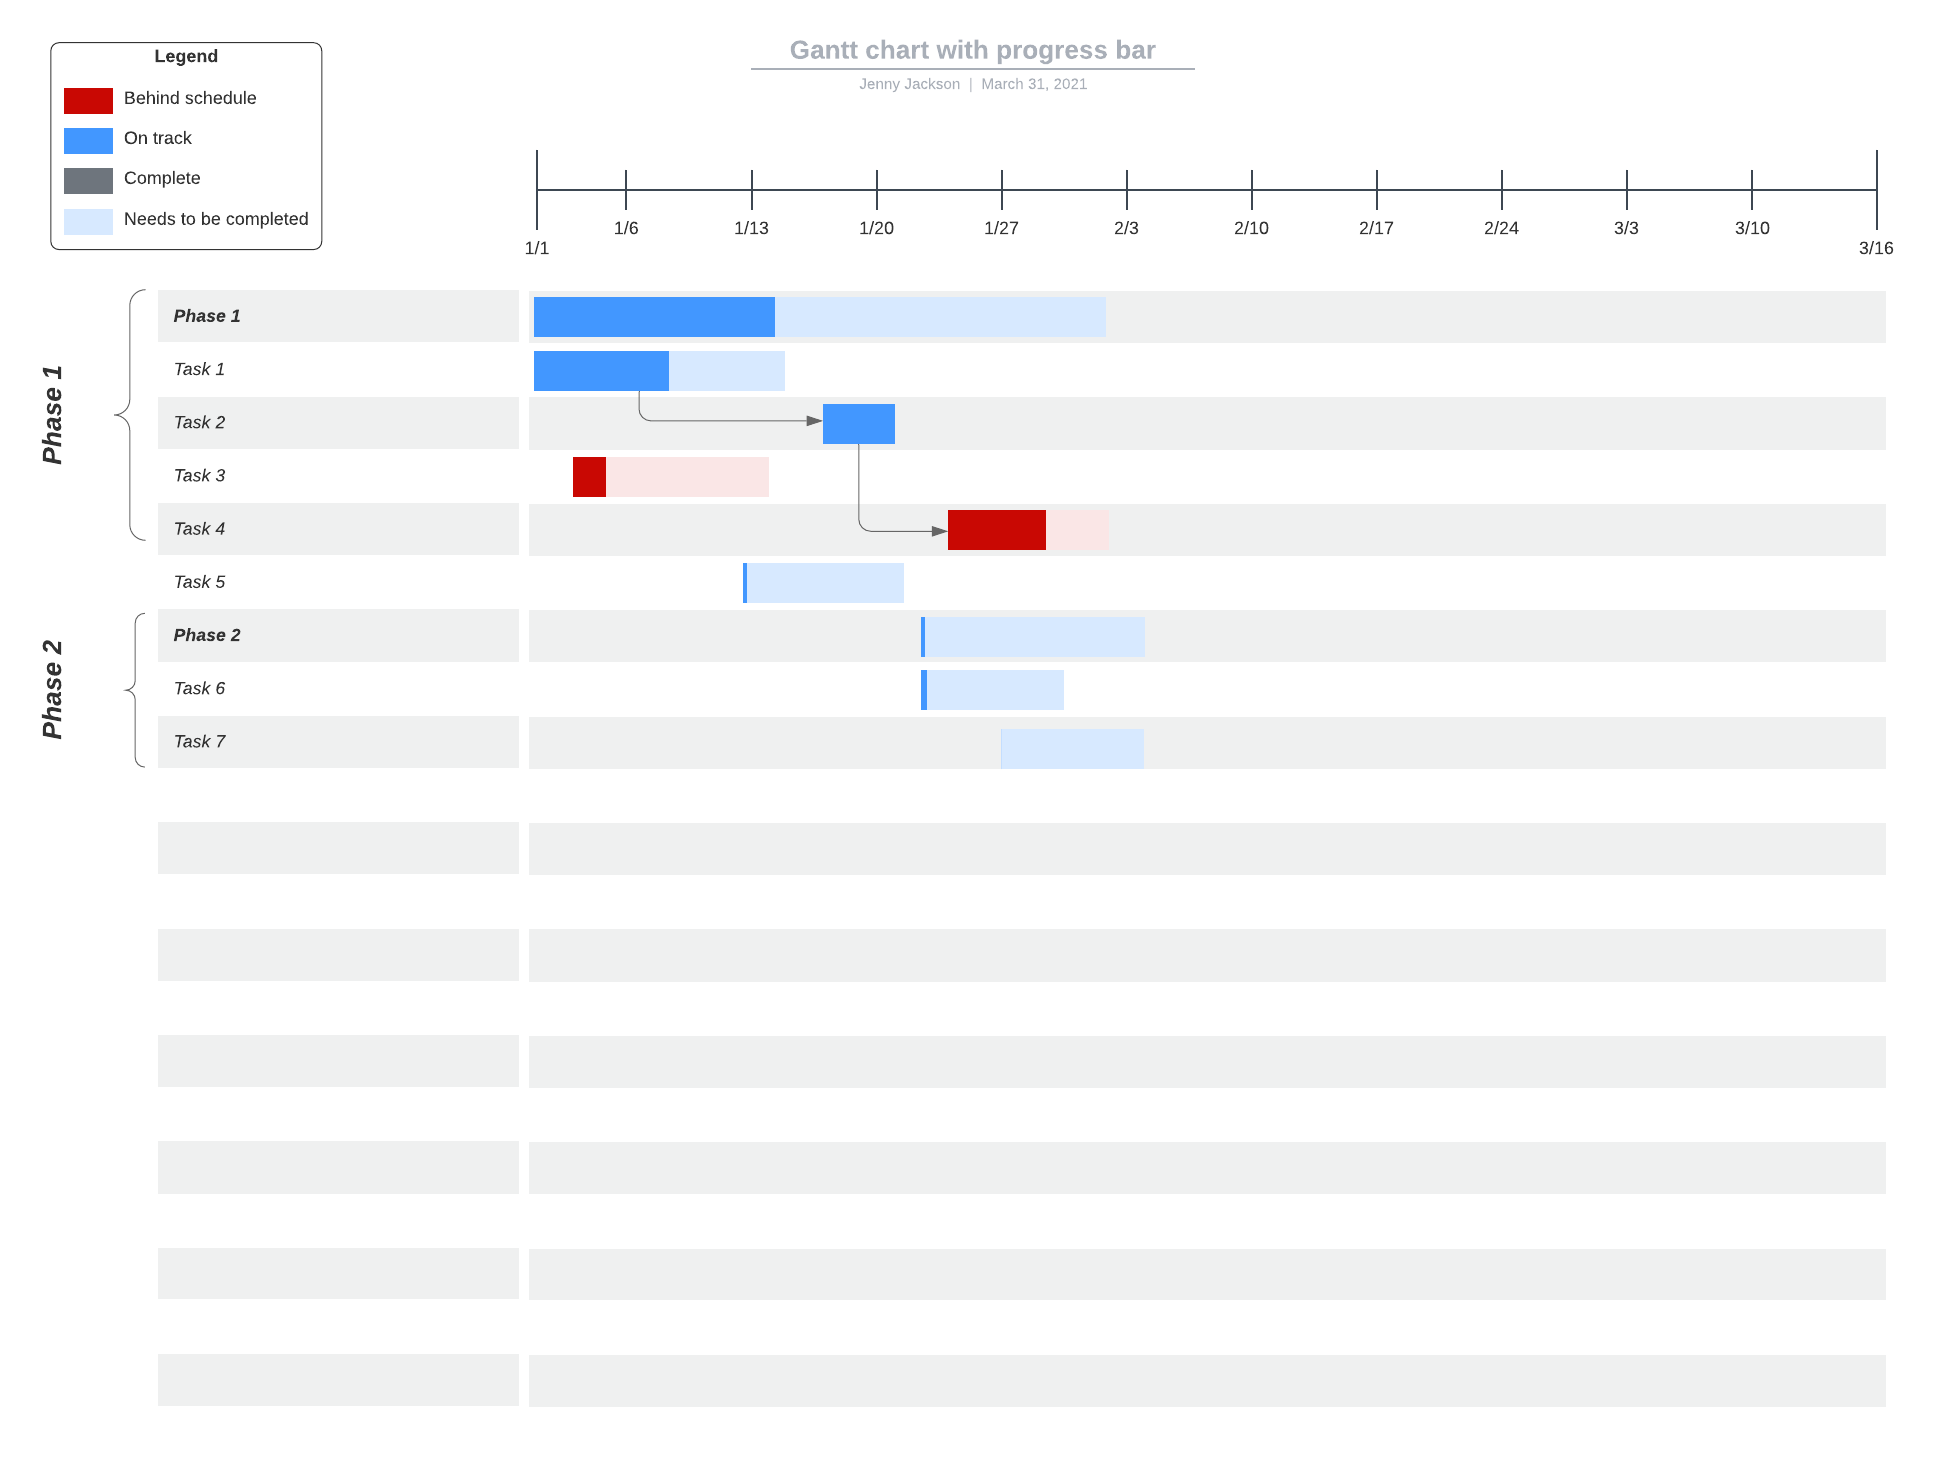
Gantt charts: These charts are great for illustrating the steps in a process, how long each step takes, and which stages of the project overlap. It’s especially great for showing various teams how their work impacts the project as a whole.
Timelines: These are a project manager’s best friend. Often project managers are fielding the question of “When will this project be complete?” Timelines can quickly tell you if you’re on schedule and how changes in dates impact the final deadline.
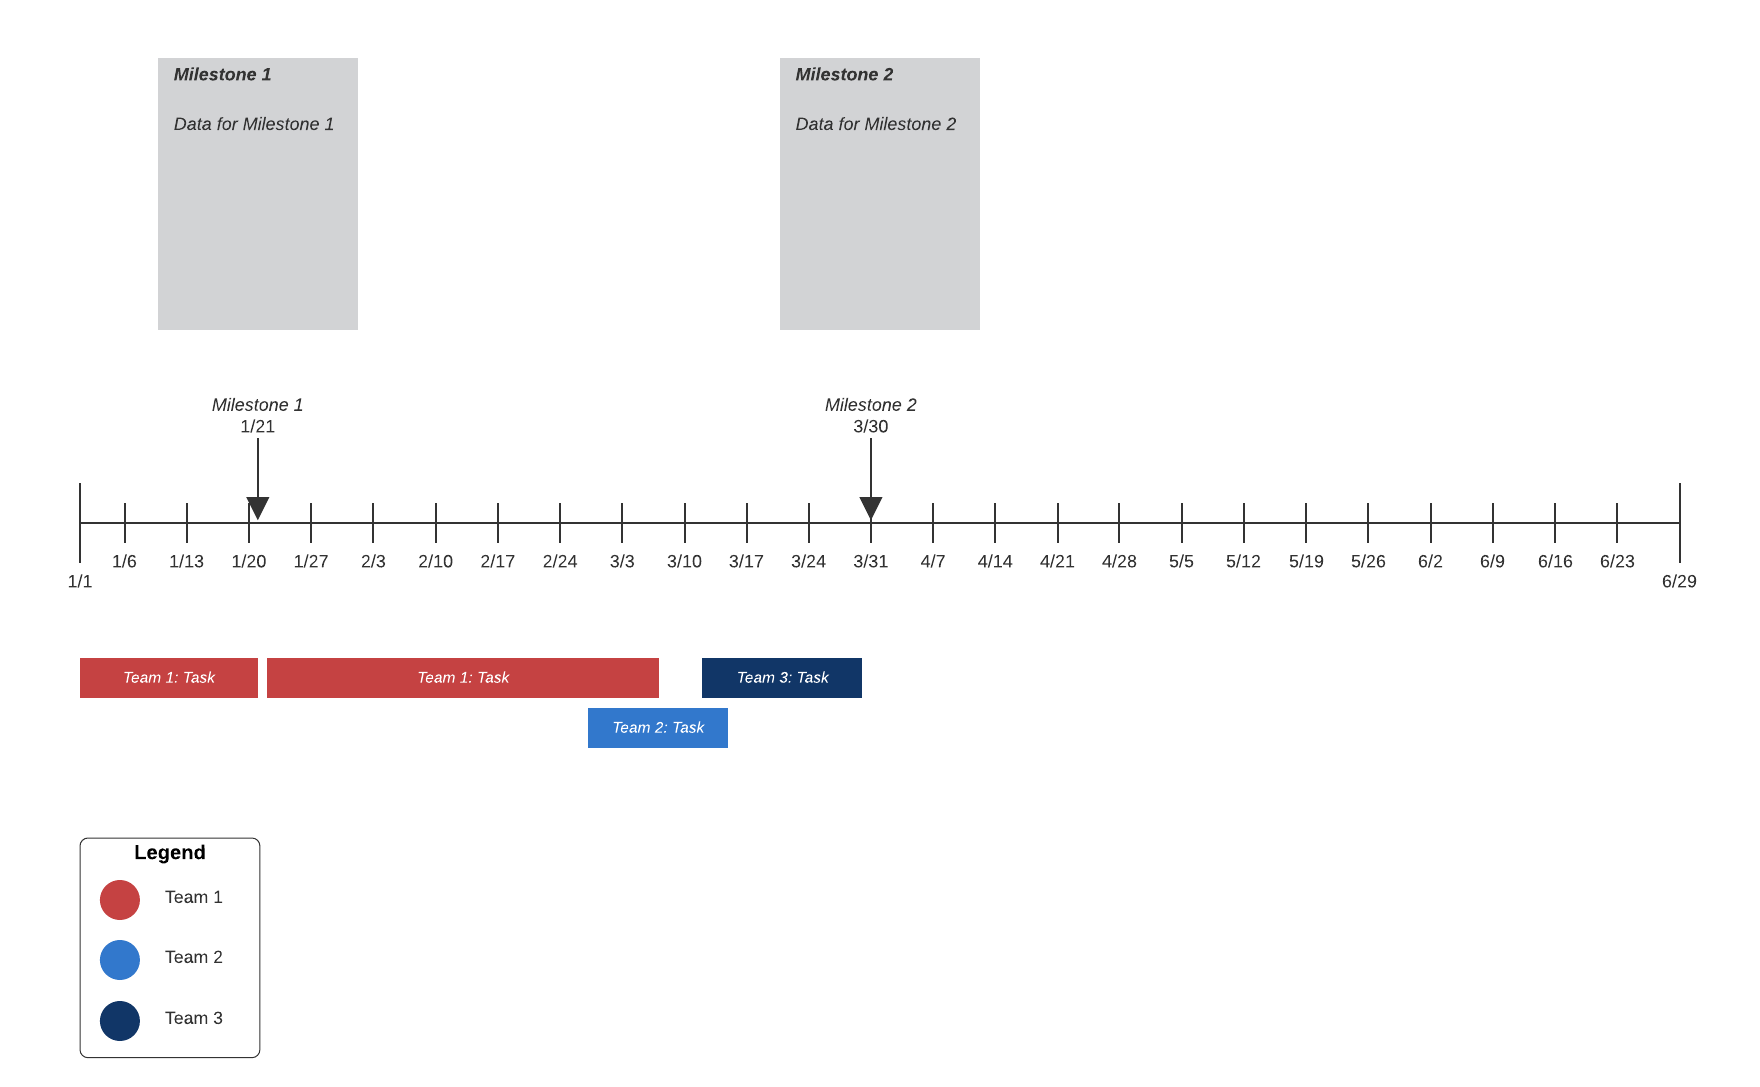
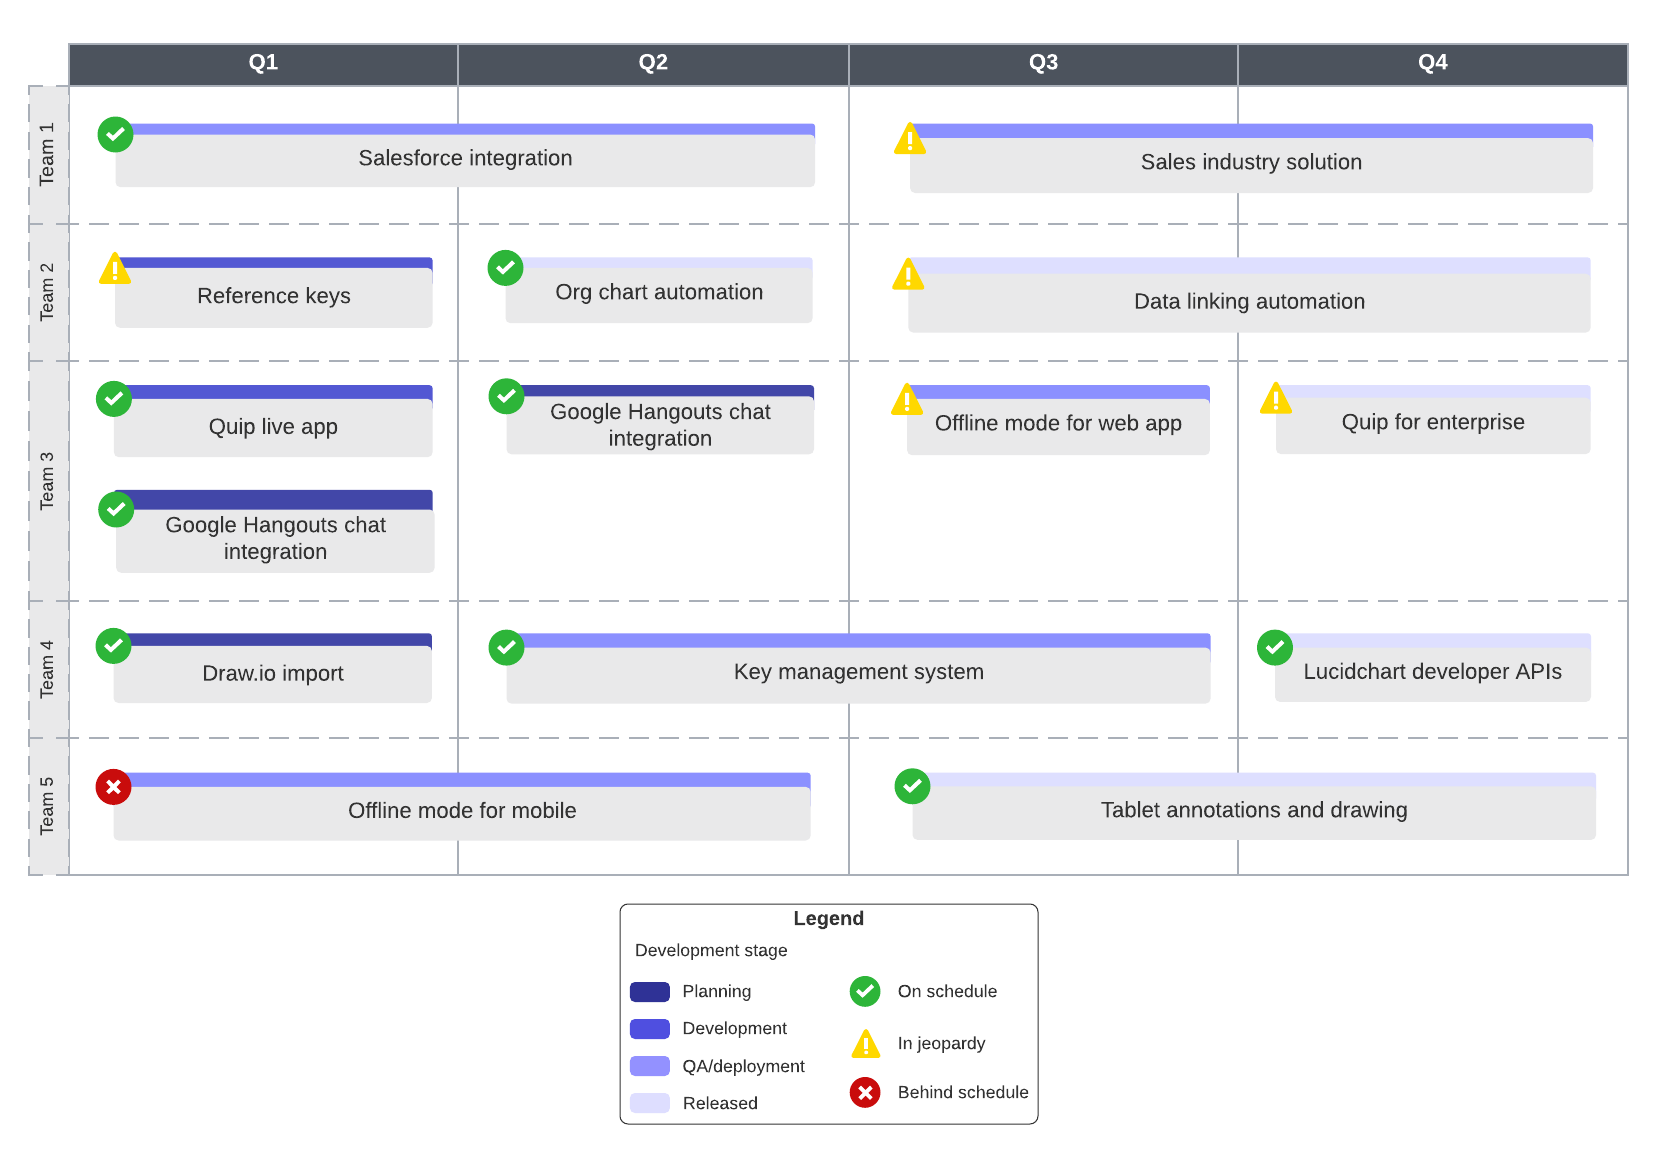
Roadmap: These charts allow for a high-level discussion of the milestones of a project and the path it will take to completion. It’s also a natural format for enforcing a “single source of truth” for what the project is expected to achieve and how it will get done.
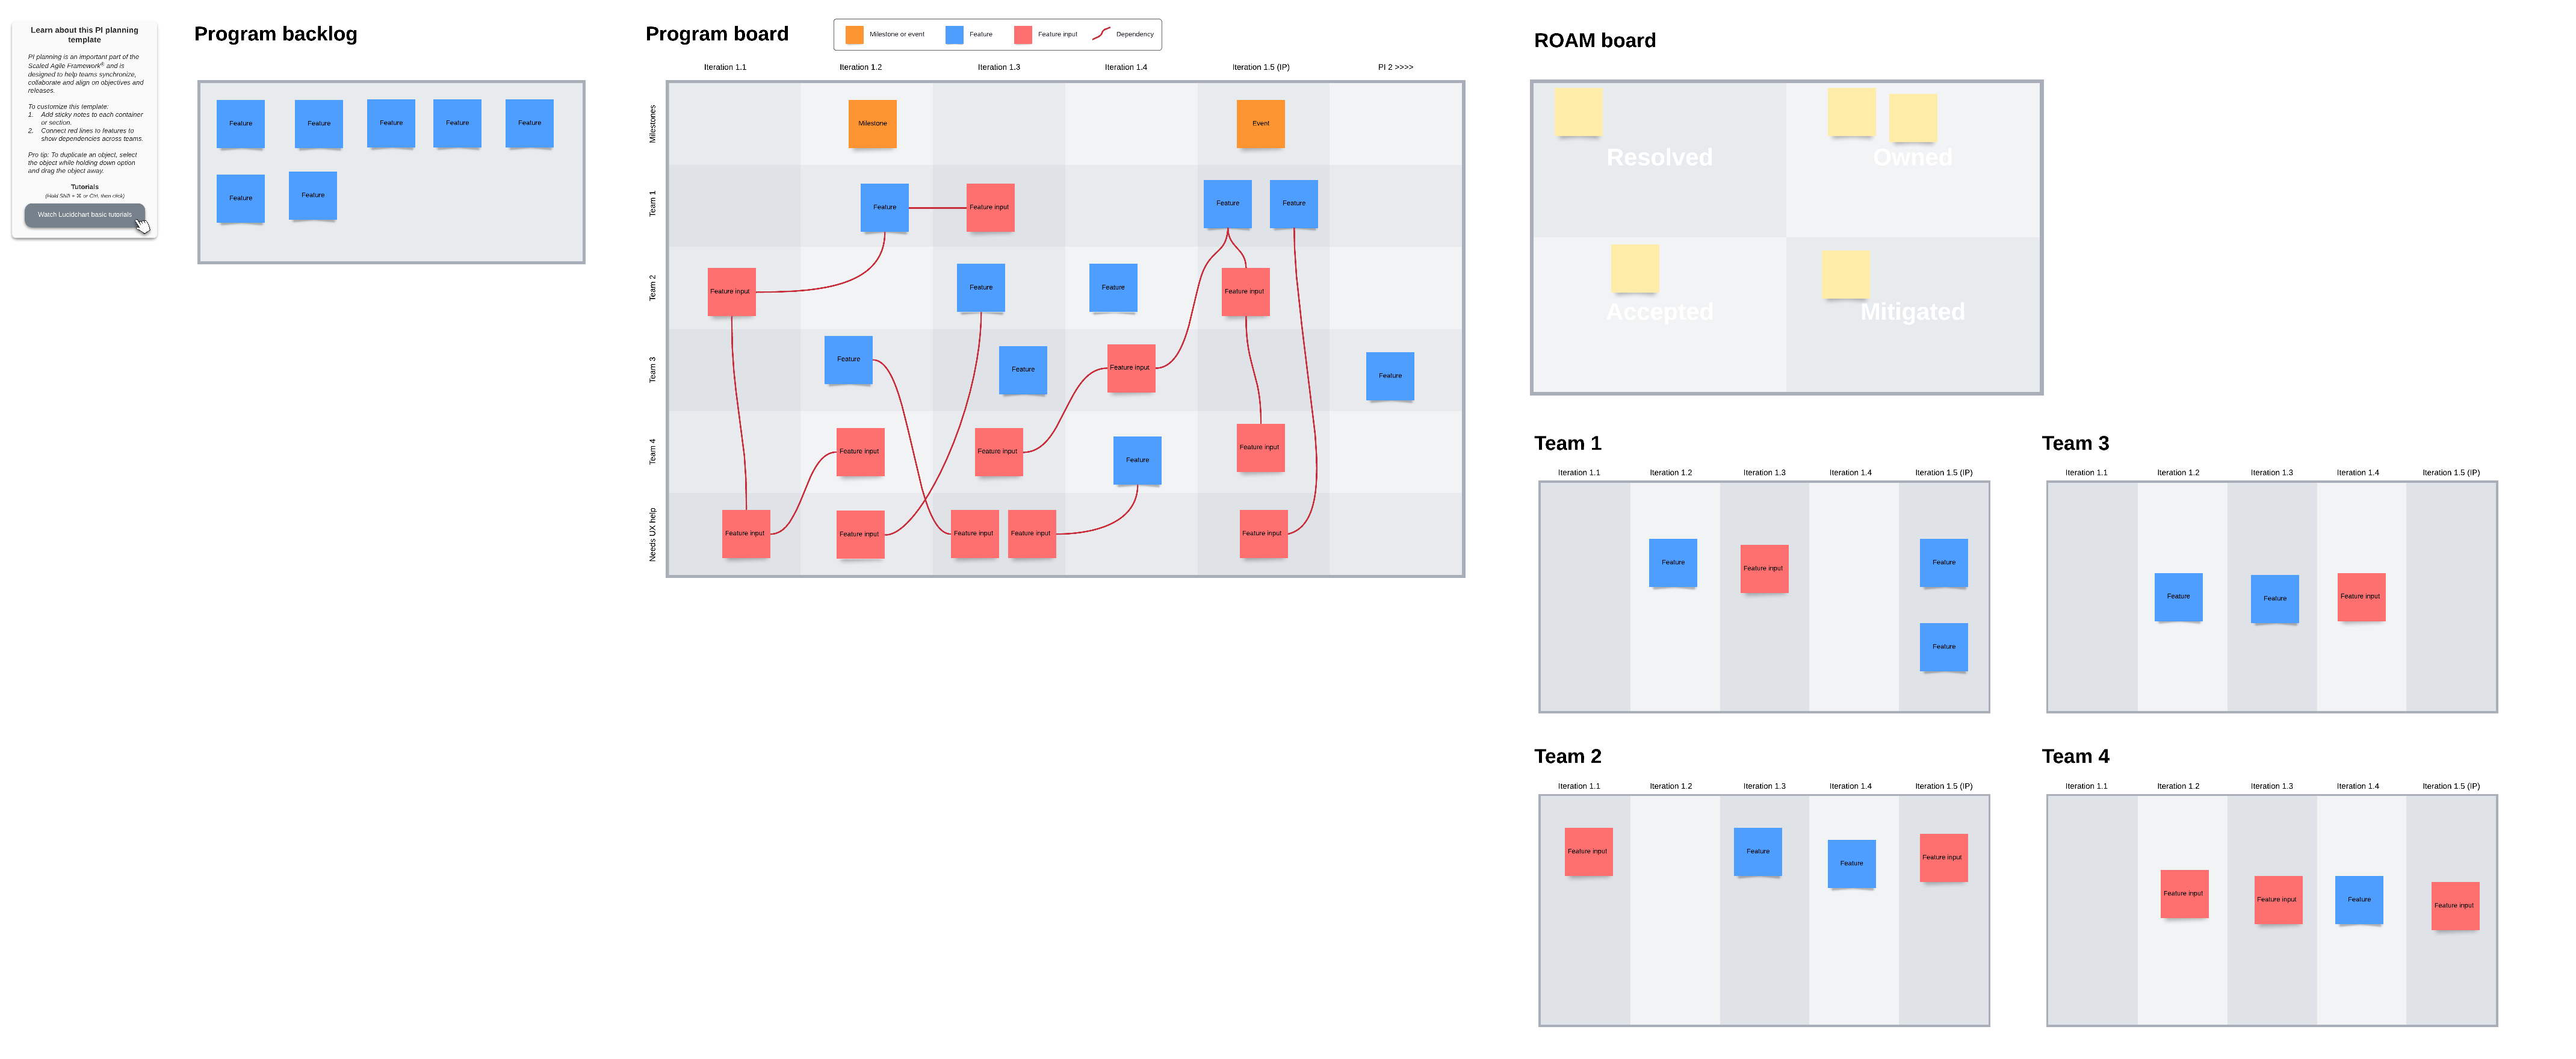
PI planning board: If your project has a large number of stakeholders and you need to align with them, you can use PI planning boards to visualize the impact of a project and map out dependencies. The layout can help field discussion on any changes that may be needed to address stakeholder concerns while meeting key objectives.
Communicate your plan and assign responsibilities
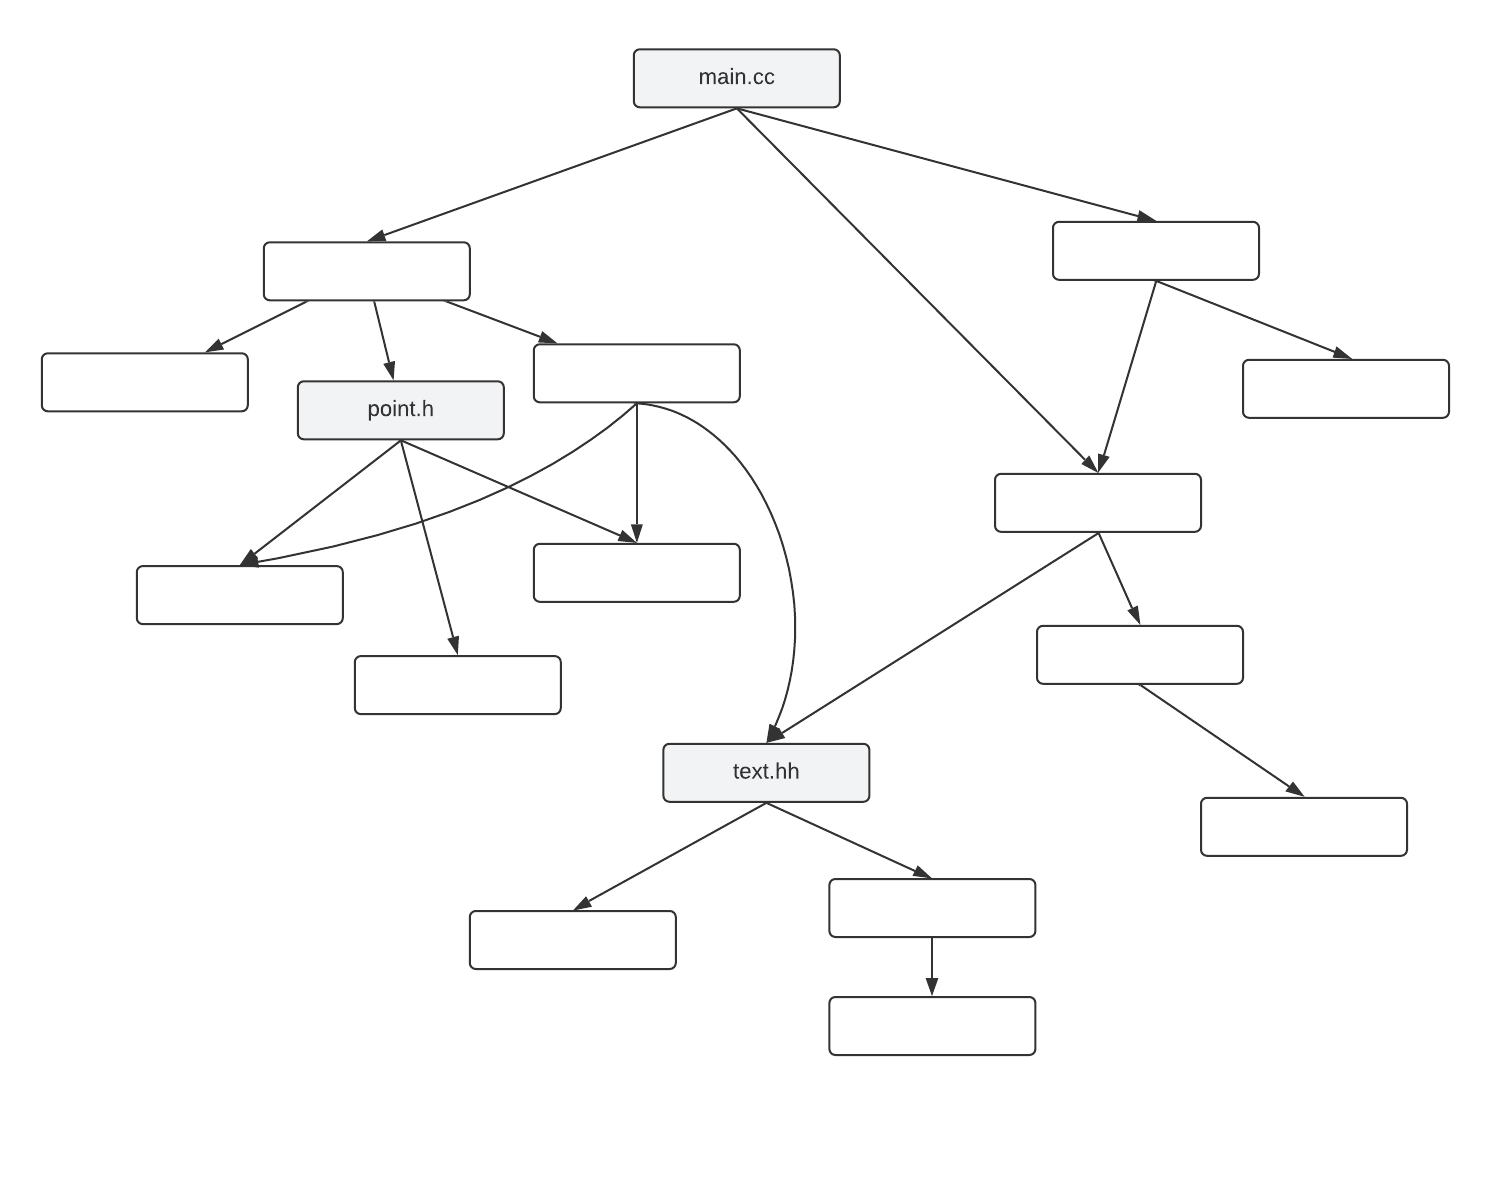
Once you’ve settled on how you will monitor your program and the tools you’ll use to facilitate, you’ll need to communicate the plans with your team. Part of your directives should involve who is monitoring what and what information you’ll need from them. A brief organization chart or a process flowchart should help clearly identify your key reports so everyone knows what they are responsible for.
Plan on communicating your plans early and often. You’ll want to have a schedule for when you update team members and stakeholders as the project goes on, and from time to time, teams may need a refresher on the overall goals of the project. The tools you’ve chosen for project management will help you easily visualize, summarize, and communicate as you steer your team toward successful project completion.

Find out how to use Lucidchart to execute your next project easily and efficiently.
Learn howAbout Lucidchart
Lucidchart, a cloud-based intelligent diagramming application, is a core component of Lucid Software's Visual Collaboration Suite. This intuitive, cloud-based solution empowers teams to collaborate in real-time to build flowcharts, mockups, UML diagrams, customer journey maps, and more. Lucidchart propels teams forward to build the future faster. Lucid is proud to serve top businesses around the world, including customers such as Google, GE, and NBC Universal, and 99% of the Fortune 500. Lucid partners with industry leaders, including Google, Atlassian, and Microsoft. Since its founding, Lucid has received numerous awards for its products, business, and workplace culture. For more information, visit lucidchart.com.
Related articles
Identifying and managing project constraints
This article discusses some of the constraints you might encounter and what you can do to work around them to keep your project on track.
Agile-Waterfall Hybrid: Is It Right for Your Team?
Both Agile and Waterfall offer valuable insights—so why not use both? Learn more about the Agile-Waterfall hybrid model, discover whether it’s the perfect solution for your team, and see how to incorporate various combinations of the hybrid depending on your organization’s needs.
Bring your bright ideas to life.


By registering, you agree to our Terms of Service and you acknowledge that you have read and understand our Privacy Policy.