Using entity relationship diagrams (ERDs), you can plan your database designs and collaborate with team members. These database diagrams are ideal for at-a-glance representation of how information and objects within a system relate to each other. Since these flowcharts are very practical for architecture design teams, ERDs have a variety of uses and varying levels of detail.
With ERDs, you can start to explore database requirements, potential challenges, and solutions before you begin implementation. Let’s talk more about what a good database diagram includes.
What is an ERD and how does it help with database design?
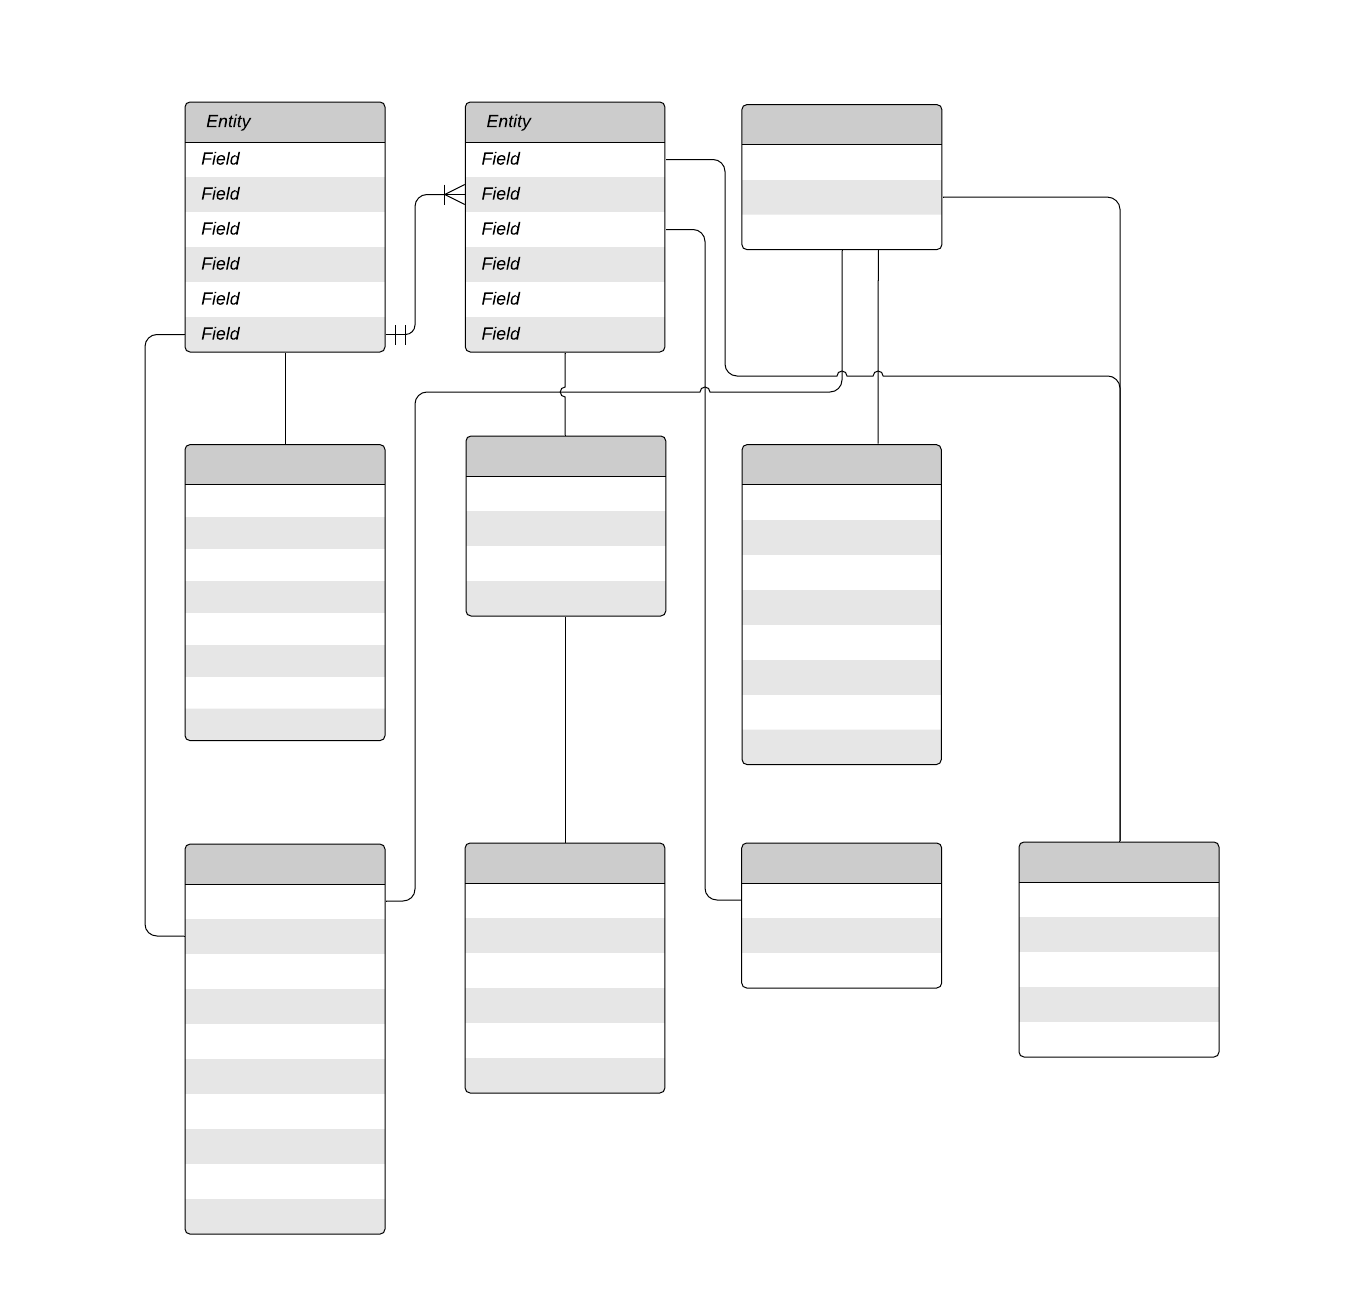
Entity relationship diagrams are used in database design to help teams visualize a system’s entities and the relationships between them within the system. Visual depictions of these connections allow architects and designers to plan their databases—the roles, users, tangible and intangible objects—and how they relate to each other. For example, an ERD might show how a customer interacts with a product which then records information to the database for retrieval as the software is used.
These diagrams use symbols that consistently represent the entities themselves, relationships, and characteristics or attributes. As a type of flowchart, ERDs may have connecting lines, ovals, squares, circles, and other shapes, following a specific set and key for that particular diagram. A variety of different fields such as management information systems, software engineering, education, and others use ERDs to show how their relational databases work.
ERDs are often used at the start of a new database project to outline the requirements and help the team build a model that expresses the information flows between the user, software, database, and other entities. Based on this model, the team can make better decisions and a more effective project plan. Benefits of an ERD include:
- Identify roadblocks early. ERDs help teams find potential challenges and begin brainstorming solutions. By mapping out your database plans, you can run through different scenarios that are likely to show up during implementation.
- Reduce complexity. Complicated networks are difficult to plan. ERDs help to simplify planning and align teams, preventing confusion and mitigating risk.
- See operational and technological detail. With different levels of ERD detail available, you can include as much or as little information as you need for an effective diagram. Detailed ERDs can be valuable for implementing your database, or you can use high-level diagrams to plan the big picture without getting too far into the details.
Thinking about how you plan to use your ERD and what benefits you’re looking to achieve can help you make the most of your diagram.
How to create an ERD for database design
Any ERD should begin with a clear purpose and scope—this provides more definition for your ERD and allows you to determine which entities, relationships, and attributes are necessary.
How much detail you choose to include in your ERD largely depends on the size of your system and what you plan to use the chart to illustrate. The larger your system, the harder it is to effectively capture detailed data in one visual. If necessary, you can use more than one chart and create different levels of ERDs as needed. Smaller systems, on the other hand, can often be easily represented.
Generally speaking, there are three different levels of detail that ERDs are used for:
- Conceptual model. With the least amount of detail, the conceptual model shows system architecture and provides a high-level overview. Typically, conceptual models are used for large architectures because they are helpful for planning a large system where there’s a lot of detail to consider.
- Logical model. As a more detailed flowchart, logical ERDs have a more in-depth definition of operational and transactional entities. For a very large system, an ERD at the logical level may be hard to visually follow and understand at-a-glance, so a conceptual model might be more practical at this stage.
- Physical model. Highly-detailed and ready for implementation, the physical model shows enough information for designers to create the real-life database. For big systems, it’s often practical to create more than one physical model.
Once you know what level of diagram you need, follow these steps to create a preliminary, basic ERD:
- Create the entities. Draw your entities according to a key you’ve decided upon, such as rectangles to represent the user and product. Label these entities. Remember that ERDs typically follow a grammar system, calling entities “nouns” and relationships “verbs.”
If you’re creating your diagram in Lucidchart, make sure you’ve enabled the entity-relationship shape libraries by clicking on the “+ Shapes” button in the left menu. Now, you’re ready to drag and drop shapes to show entities in your ERD.
- Draw the relationships. Show connections between and among entities by drawing lines to represent their relationships. Label these connections, generally right above the line or using a different shape from what you used to represent entities.
Lucidchart allows you to connect your entities with smart lines. To create a connection, drag out from the red dots at the borders of shapes you’ve placed on your diagram. From the toolbar above the canvas, you can change line settings and endings.
- Add in the attributes. Next, add in entity attributes. For example, an entity representing an employee may have an ID number or name as attributes.
Depending on the entity shapes you’ve added to your canvas in Lucidchart, you can edit fields or type directly on your shapes to show attributes.
- Describe the relationship. Cardinality, depicting whether there’s a one-to-one, one-to-many, or many-to-many relationship, explains how the entities relate. This detail can be shown visually, but it’s important to specifically include this detail in your visual.
Once you have your visual, you can share it with your team and collaborate on your database design. Having visuals available simplifies the communication process and enables you to reference design details at-a-glance.
How Lucidchart can help
With Lucidchart, you can create ERDs in the cloud and share or print your flowcharts whenever you’re ready. Create shapes, draw lines, and use pre-made components to build your diagrams online. Using Lucidchart’s template library, you can save time creating diagrams that are consistent and ready for sharing. Your team can comment, make suggestions, and update the ERD in real time.