What is empathy mapping?
Empathy mapping helps UX designers, marketers, salespeople, and product developers quickly get inside the heads of their customers. After taking some time to think the way their users think, these professionals are empowered to make customer-oriented decisions during every step of product development, testing, and release.
Empathy maps do not replace persona research, but they have gained prominence in the Agile community as a sort of “lean user persona.” Unlike persona research, empathy maps are completed as a brief team exercise rather than an exhaustive research endeavor, hence their nickname “10-minute persona.”
So what is an empathy map?
An empathy map is a visual design thinking tool. It is divided into four quadrants that describe user behavior and traits observed through the customer journey or during market research:
- Think and feel: How the user feels during the journey, including mood, motivations, reactions, needs, and frustrations.
- See: The user’s environment, including what they see others doing, the competitors they’re exposed to, etc.
- Say and do: Direct or paraphrased quotes from users and their observed actions.
- Hear: What information and feedback the user hears from others, including friends and influencers.
Your empathy map should act as a source of truth during your project to ensure alignment and strategic decision-making.
How does empathy mapping work?
Typically, empathy mapping occurs as a team activity. Everyone gathers in a meeting, bringing with them any data, insights, customer feedback, or experiences related to the persona in question. Follow these steps to build your own empathy map:
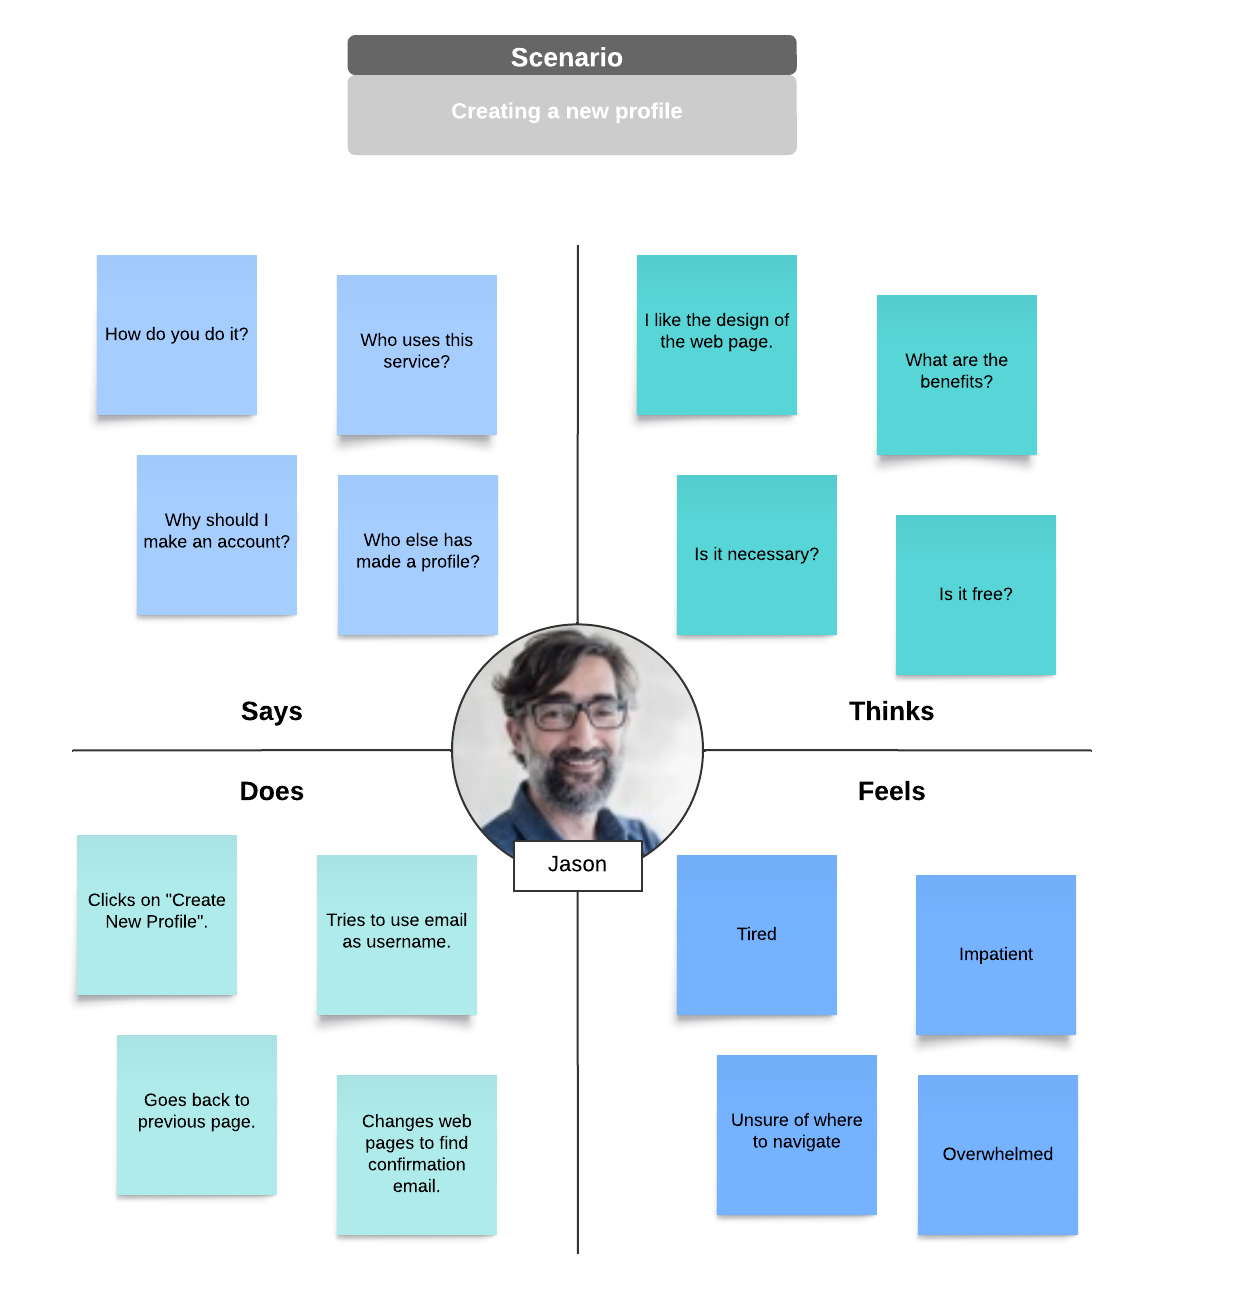
1. Draw a quadrant on the board.
The team lead draws a large X on a whiteboard or virtual canvas like Lucidchart and gives labels to the four spaces the X creates: think and feel, see, say and do, and hear. At the center of the X, the leader draws a face and writes the name of the persona to remind the team that they are talking about real people during the exercise. Note that empathy mapping may be done for a group of people or for a specific individual.
Use an empathy map template to quickly generate a customizable empathy map.
2. Brainstorm ideas and add them to the board.
Next, team members are given a stack of sticky notes and a pen. Participants write their thoughts, quotes, and data about the persona on sticky notes and then place the notes on the empathy map in one of the four labeled categories.
If you are using an app like Lucidchart, team members can easily collaborate on one shared canvas with sticky notes and tag other people for commentary.
In the think and feel category, sticky notes should include quotes (real or imagined) of what users are thinking. For example, “I love making mind maps!” or “Network diagrams can be so tedious.”
In the see category, describe what people see as they use the product. Where do their eyes go? What do they see in the environment around them? For example, “notices a large empty space on the canvas.”
In the say and do category, think about the way the customer acts while using your product. For example, “Agh! My line is crooked again!”
In the hear category, record what influencers say about people as they use your product. Think about where users get their information and what they might hear from those sources. For example, if your product were Lucidchart you might write, “You use Lucidchart? Rock on, man! I love Lucid!”
As team members share their thoughts, the leader may ask questions to extract deeper insights about the persona. Consider asking the following questions:
- What does a typical day look like for this person?
- What does this person worry about?
- What are their aspirations?
- When using our product, where will this person be? What are they seeing and hearing around them?
- What will friends, colleagues, and other influencers say about this person when they use our product?
- How does this person feel when they use our product?
- What does this person say and do when they use our product? How would that change in a public or private setting?
- How might this person benefit from using our product?
If your team struggles to produce thoughts, try role-playing. You’ll probably feel a little embarrassed at first, but with a positive attitude, role-playing can be fun and extremely beneficial.
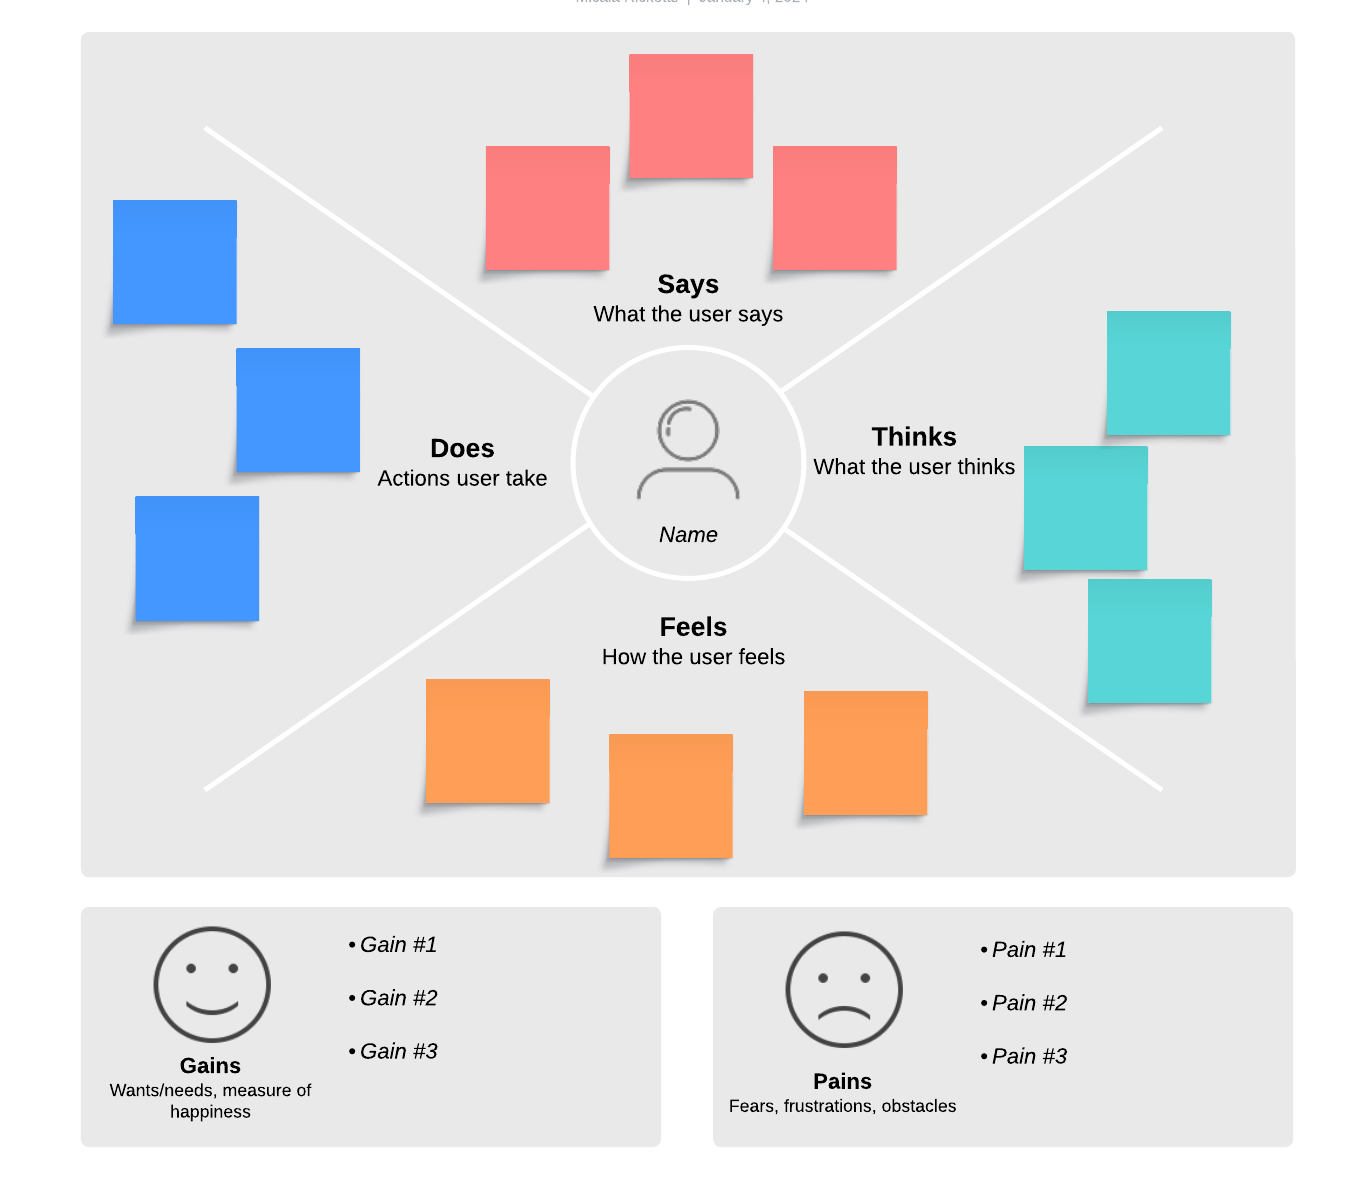
3. Analyze your empathy map.
After filling in the four categories, draw a line at the bottom of your empathy map and divide the remaining space into two sections: pain and gain. Here you will use the information on the empathy map to analyze and discuss the pains users may be looking to solve when they use your product. What do they have to gain when they do? An easy way to do this is by filling the blanks in the sentence, “They need a way to __ because __.”
Pain and gain are the most important sections of your empathy map. They serve as a sort of hypothesis that you can use to make decisions during development and further test with thorough persona research.