Visuals allow you to efficiently communicate your cloud architecture—both your current state and your future plans—to your engineering team and other stakeholders, even those with less technical experience.
With your cloud plan available at a glance, your team can suggest ideas, collaborate more easily, and get started quickly with effective solutions. Visuals also help you identify bottlenecks and see where your cloud infrastructure could benefit from changes and improvements.
Lucidscale gives you everything that you need to plan and propose changes to your cloud architecture in real time. Here’s how.
How to use Lucidscale to propose new cloud plans
Lucidscale helps you automatically create a visualization of your current cloud infrastructure using real-time data from third-party cloud services. With this functionality, you can develop new cloud plans that are shareable within your organization.
Follow these steps and tips to build an effective cloud plan for your team.
1. Pull in third-party cloud provider metadata to get an accurate picture of your current state
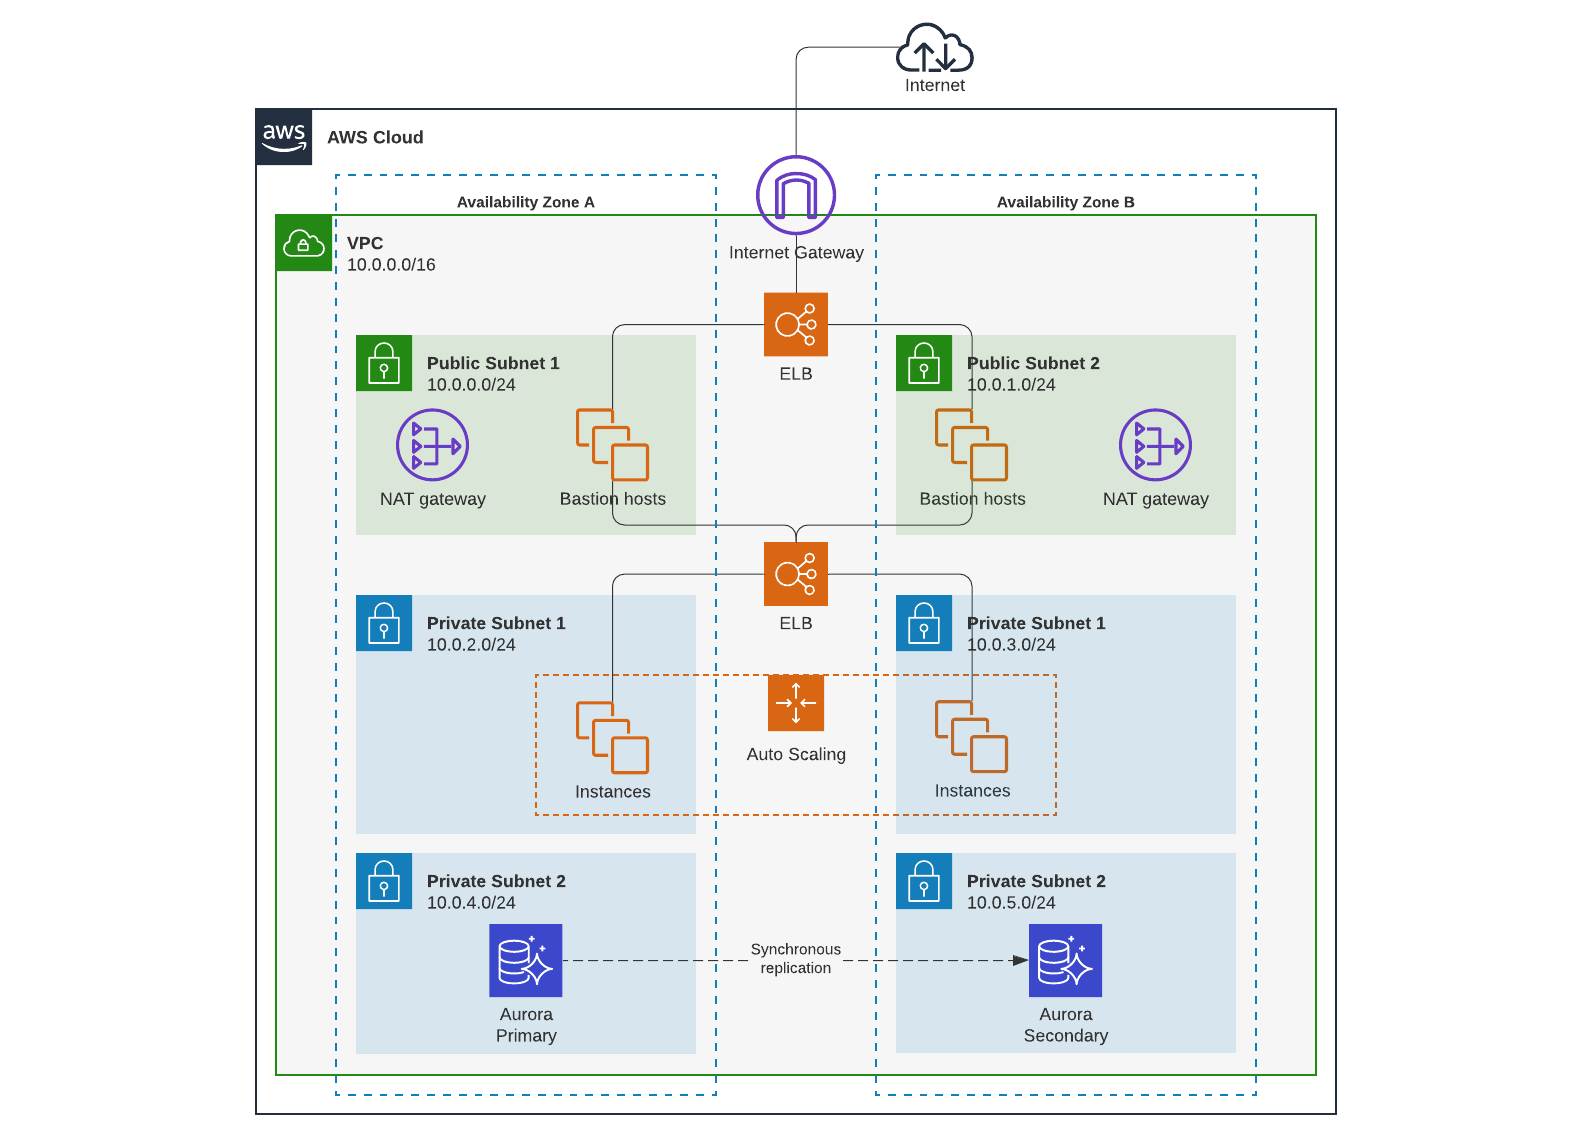
First, you’ll start the process of developing your new cloud plan by pulling in third-party cloud provider metadata into Lucidscale. With this data, you can build a full cloud architecture diagram with multiple views available.
Lucidscale allows you to apply filters and customize your views by removing unnecessary detail, using lines to depict relationships between resources, and more.
Accurate cloud diagrams are essential to the cloud planning process because they:
- Eliminate guesswork: With an accurate diagram, you don’t have to wonder if your visualization is truly an effective depiction of your cloud architecture. You can use your diagram to guide your decisions.
- Troubleshoot in real time: Live data is shaping your cloud diagram so you can see where blockages and disruptions are right now and plan accordingly.
- Verify your cloud architecture: With Lucidscale, you can verify your cloud architecture without having to manually redraw information to update your visual.
Lucidscale reduces the likelihood of mistakes and gives you a full range of customizable views your team can reference.
To automatically generate cloud diagrams with third-party metadata:
- Open up a new document
- In the left-side panel select, “Import data.”
- Click the drop-down menu and select the appropriate cloud provider
- Then select “Cloud Insights” and then your cloud provider.
- Click “Import Your Data” and follow the prompts.

2. Create a diagram “rough draft”
Next, you’ll need to copy your diagram into Lucidchart so you can make changes, add shapes, or incorporate new information. This is a diagram you can use to visualize adjustments you want to make to your cloud architecture.
Because Lucidchart has been built for seamless collaboration, you can share this diagram with your team and reference teammates with mentions, use tags to categorize, and provide shareable links.
Here’s some ways to visualize relationships with Lucidchart:
- Generate lines to highlight relationships, such as ALBs and EC2s.
- Customize line styles by color, style, and more.
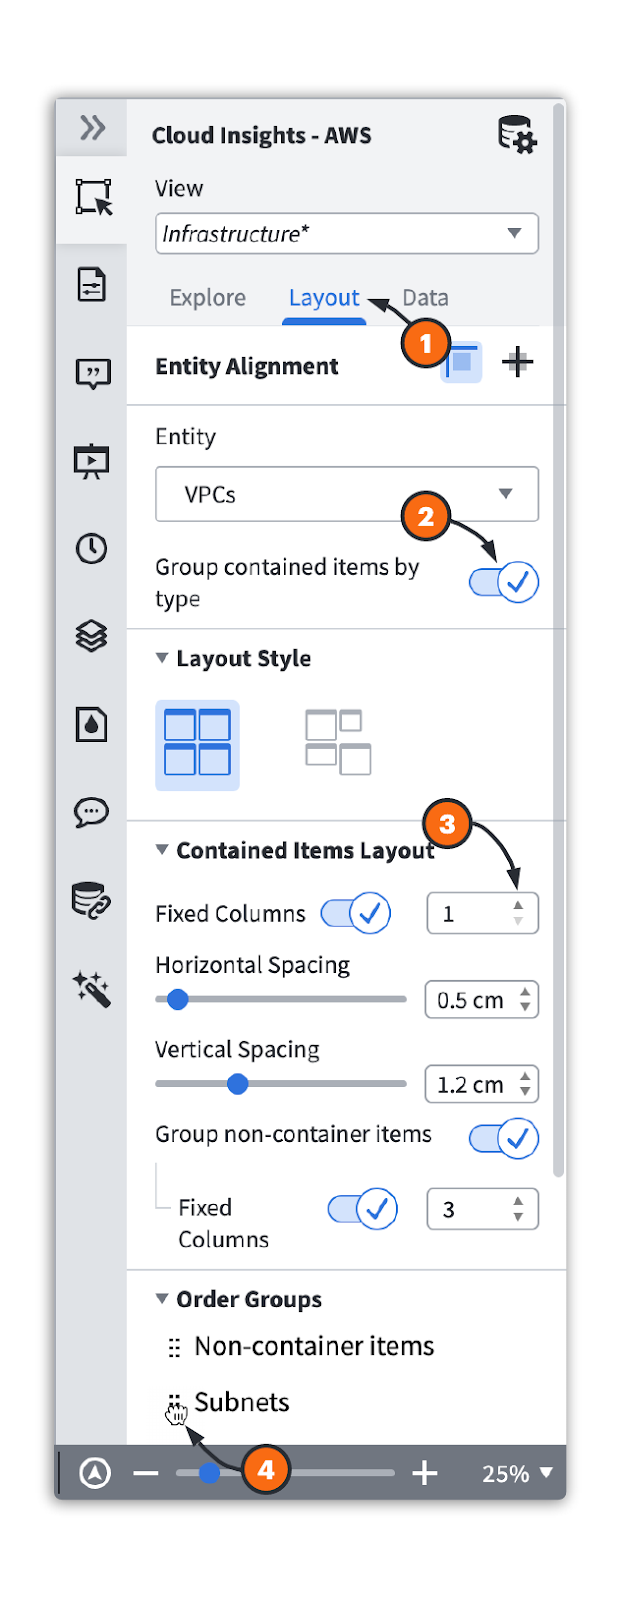
To adjust your layout:
- Click the “Layout” tab.
- Group resources within a container by type.
- Adjust the number of columns inside a specific container type.
- Rearrange the order for resources to appear.
After you’ve put together a rough draft of your cloud plans, you need to share these plans with the appropriate teams and get their buy-in and approval. But complicated cloud architecture diagrams are hard to digest. That’s why it’s important to create, customize, and share different views of your cloud plans.
When you filter your diagram, you can experience these key benefits:
- Ensure all information is accurate during planning and implementation.
- Present to non-technical stakeholders more easily.
- Zero in on crucial cloud information.
- Communicate clearly across teams.

When you save views, be sure to include the following:
- Show relationships: You should be able to see how your cloud accounts are related and how they communicate.
- Display components: In a multi-cloud environment, your diagram should show every service that’s part of your architecture.
- Include real-time data: Ideally, your cloud diagram should be updated in real time or on a frequent basis to reflect how you use the cloud right now.
To save as a new view:
- Click the pull-down menu for “View.”
- Click “Save as New View” to save your diagram for future use.

3. Give your diagram to the coding team
As you move forward with your cloud architecture planning, you’ll want to give your diagram to the coding team so they can start building the new architecture. It’s best if you create different diagrams for each scenario you want the team to consider if you’re still discussing your planned architecture. Gathering input from stakeholders can help everyone build a better cloud.
Once your engineers, architects, and coders have provided you with any other pieces of information you need and you’ve made adjustments to the plan (as needed), provide your coding team with a final version of the cloud diagram. You can use the Lucidchart sharing features to grant access and loop in teammates.
Tips for collaborating in Lucidchart or Lucidscale
- Use annotations: Don’t assume your team can see what you do. If you have an important idea to reference about your diagram, make a note.
- Tag problem areas: Use the tagging feature to emphasize specific problems and draw attention to specific areas in your diagram.
- Pay attention to views: Make sure you’re looking at the same visualization and view as your teammates. Lucidscale allows you to share your diagram and use mentions.
4. Verify that the implementation is correct
From here, you’ll be reviewing your Lucidscale diagrams again to make sure your cloud implementation was done correctly. Revisit your views again and ensure that the changes are appropriate based on your plan. Using the process in Step 1, check out your cloud architecture diagram and real-time data.

Tag any problems you notice so your team can start resolving them. If necessary, review your expectations and discuss what other changes you’ll use to achieve the implementation you need.