Lucidchart

How to improve 6 common Lucidchart use cases with Lucidspark

Reading time: about 10 min

Topics:

  • Lucidchart tips

What makes Lucidchart even better? Lucidspark. 

Don’t get us wrong—Lucidchart has been the go-to diagramming solution for years for a reason. With its intelligent automation, intuitive interface, comprehensive shape and template libraries, and collaborative sharing features, teams have turned to Lucidchart for everything from mapping org charts to improving technical architectures. 

But while Lucidchart is great for visualizing structured processes, data, and connections, teams still need a place for the unstructured work: the anything-goes brainstorming sessions, nimble decision-making meetings, and momentum-building planning workshops. So, the Lucid team built Lucidspark to fill this need. 

Lucidspark is a virtual whiteboard purpose-built with feature sets that allow teams to capture their best ideas, then transform those ideas into action. With its limitless brainstorming features, interactive facilitator tools, and flexible prioritization features, it’s the perfect solution to turn to for your ideation and planning needs. 

The best part? Lucidchart works with Lucidspark seamlessly. Each product is powerful on its own, optimized for the unique goals it supports. And when used together, you get uninterrupted collaboration across the entire project workflow—from idea to reality.

If you’re already using Lucidchart in your day-to-day, check out how you can add Lucidspark to your workflow to boost your team’s creativity, productivity, collaboration, and efficiency.

Benefits of using Lucidchart and Lucidspark together

By combining the intelligent diagramming of Lucidchart with the flexible ideation of Lucidspark, teams can:

  • Move efficiently through stages of work: Since Lucidspark and Lucidchart are built on the same platform, it’s easy to move from ideation to planning to designing, building, and so on. When it’s time to pass the project off to the next stage of work, you can ensure other teams will have the context they need to make decisions and move forward.
  • Align around a living blueprint of the business: As teams across the organization collaborate on different use cases in both Lucidchart and Lucidspark, they organically create a living blueprint of all their ideas, decisions, processes, and systems. Teams can turn to this single source of truth to stay aligned and keep up the momentum—even as team members come and go.
  • Achieve scalable, constant innovation: Many teams are already documenting their processes and architecture. By combining this technical documentation in Lucidchart with informal documentation of ideas and decisions in Lucidspark—known as an innovation repository—you’ll have all the information needed to continuously learn, iterate, and innovate. 

How to add Lucidspark to your Lucidchart use cases (with templates)

We’ve identified some of the most common reasons people use Lucidchart—and we’ve taken these use cases to the next level by incorporating Lucidspark into them. See how you can save time and collaborate better by adding Lucidspark to your workflow.

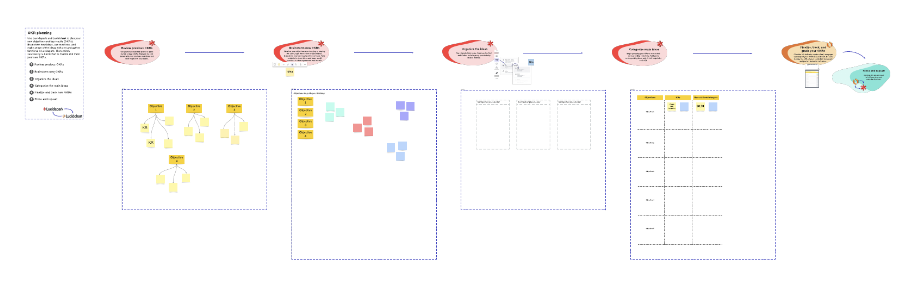
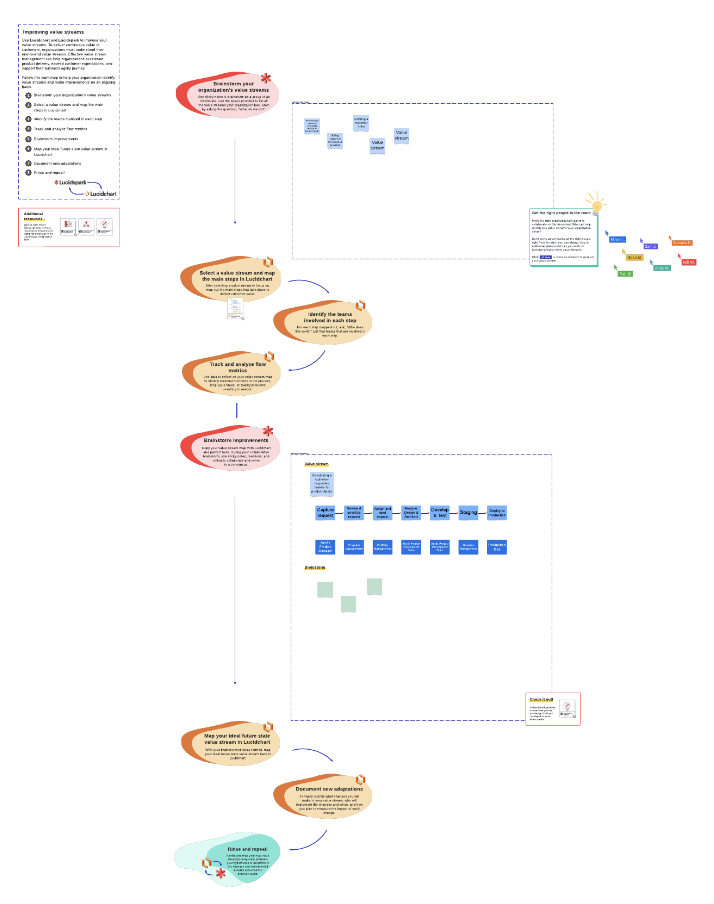
1. Improving a process

Process improvement is an involved activity that requires the input of various teams and stakeholders across the business. Lucidchart is great for defining current processes, identifying bottlenecks or roadblocks, and visualizing areas of ownership. To ensure the process really does improve, teams can turn to Lucidspark to collaboratively brainstorm improvement opportunities and build flexible action plans. 

With Lucidspark, you can ensure all appropriate teams and stakeholders have a chance to contribute ideas and are bought in on the new process. When used with Lucidchart, you can easily move from polished diagrams to free-form brainstorming and back again.

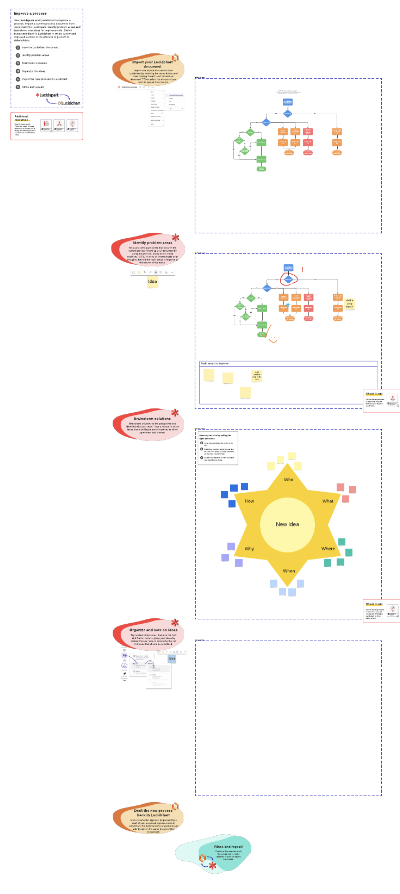
How to use Lucidchart and Lucidspark to accelerate process improvement:

  1. Start in Lucidchart to map out the current state of your process.
  2. Then, import this process map into Lucidspark and identify problem areas. Whether working in real time or asynchronously, take advantage of Lucidspark’s collaborative features like sticky notes, Collaborator Colors, comments, and the pen tool
  3. In Lucidspark, brainstorm solutions to improve the process. You can choose from any brainstorming template to give everyone on your team a chance to contribute ideas.
  4. To decide what improvements to pursue first, use Lucidspark’s features like voting or emoji reactions.
  5. Then, go back to Lucidchart to map out the proposed future state. You can share your improved process easily for approval and buy-in.
Improve a process example (click to open)

2. Product planning and design 

Planning products is an inherently complex activity, with teams across the business needing to align on everything from the product vision to the details of how teams will iteratively develop and deploy the features You may already use Lucidchart for designing and wireframing products. But before you begin, you need to aggregate your team’s research, brainstorm ideas, and prioritize features to build. 

Lucidspark’s dynamic features allow you to collaboratively ideate, gain consensus on key product decisions, and plan just how to bring your designs to life. Planning products using the combination of Lucidchart and Lucidspark produces visual artifacts that improve transparency around decisions, designs, and plans. These visualizations serve as a single source of truth that all involved can reference. 

How to use Lucidchart and Lucidspark to design and plan products:

  1. Start in Lucidspark, where you brainstorm features with your team. You may find it helpful to embed links in your boards to display thumbnails of inspiration sources. 
  2. Then organize your ideas to identify priorities. You can plot your ideas on one of Lucidspark’s matrix templates, such as the feasibility and user value matrix, or hold a voting session to reach an agreement. 
  3. Staying in Lucidspark, create storyboards to illustrate the user journey. Take advantage of freehand drawing or drop in shapes, images, or GIFs. 
  4. Use Lucidchart to map a polished user flow and begin prototyping or wireframing your design.

Jump back into Lucidspark to make a feature release plan. Use the Timeline feature to visualize milestones and accountability and sync your Lucid Cards to Jira, Smartsheet, or Azure DevOps to bring your plan to life.

Product design in Lucid example (click to open)

3. Building user journeys

Lucidchart makes it easy to build user journey maps. But before you begin mapping the user journey, you need to first conduct user research and make sense of your insights. Lucidspark provides a flexible canvas to capture customer insights in a shared space for team members to access. And with Lucidspark’s organizational features, you can quickly identify common themes and trends in research. 

When using both Lucidchart and Lucidspark, you’ll capture all your research as well as a polished journey map in one central location. When it’s time to revisit your journey maps, you can turn to this single source of truth to see how past decisions were made and what insights were overlooked. 

How to use Lucidchart and Lucidspark to continually improve user journeys:

  1. Use Lucidspark to collect user data, quotes, and insights in one central location. Include links to other sources if needed. Then, organize the data and identify themes using Lucidspark features like tagging, Gather, and Sort
  2. Brainstorm ideas for the user journey in Lucidspark. Then, use emoji reactions or voting to decide what ideas to implement.
  3. Use the information and ideas you’ve gathered to build journey flows in Lucidchart.
User research and journey mapping in Lucid example (click to open)

4. Architecture design and improvement 

Due to its broad reach and importance in the business, designing and improving architecture requires buy-in from a variety of stakeholders. Whether designing cloud architecture, UML diagrams, or any other technical system, Lucidchart is great for visualizing architecture and creating a shared understanding. But in order to capture all the requirements, input, and ideas from necessary stakeholders, organizations need a more collaborative space. 

Lucidspark saves time on tedious back-and-forth communications by providing a central space to capture everyone’s ideas without needing a meeting. By using Lucidspark in conjunction with Lucidchart, cross-functional teams can align quickly on not only the architecture’s current state but also plans for improvement. 

How to use Lucidchart and Lucidspark to align on architecture improvements:

  1. Map your current architecture in Lucidchart, taking advantage of the comprehensive template and shape libraries. Tip: If starting from scratch, start in Lucidspark to brainstorm and plan architectural requirements. 
  2. Paste your architecture diagram into Lucidspark and identify potential problem areas to improve. Share with stakeholders and use collaborative features like drawing and commenting to work together.
  3. In Lucidspark, brainstorm ideas to address issues, and use features like voting if you need help reaching a consensus and prioritizing improvements.
  4. Return to Lucidchart to draft your improved architecture diagram.
Architecture design in Lucid example (click to open)

5. Strategic planning

Strategic planning is a complex process—multiple teams need to meet, reach an agreement, and translate their discussions into tangible action plans. Lucidchart provides the data and dashboards to inform decisions and keep track of progress toward goals, but teams still need a flexible way to bring together ideas, prioritize, and plan. Lucidspark’s dynamic collaborator and facilitator tools promote engaging planning sessions while maintaining visibility to all ideas being shared—even as teams work remotely. 

By using Lucidchart and Lucidspark together, cross-functional teams can stay aligned from ideation and planning through to execution and monitoring. And by capturing everything from the messy ideas to the polished plan and dashboard in Lucid, it’s easy to ensure follow-through and accountability on action items.

We’ve tried other online collaboration products, but the dynamic nature of Lucidspark with features like color coding and voting, all in one application on one canvas with flexibility, really helped our meeting reach a new plane.” —Brad Rechner, CEO, Bamboo HR

Read the full case study.

How to use Lucidchart and Lucidspark to streamline quarterly planning:

  1. Gather participants in Lucidspark to begin discussing and ideating. You may want to use the timer or other facilitator tools to keep the discussion on track. Make the session engaging by encouraging participants to interact with each other’s thoughts using emojis, freehand drawing, and comments. If necessary, paste any previous Lucidchart dashboards or data into Lucidspark for additional context.
  2. Stay in Lucidspark to tag and sort ideas by category, team, priority, or any other criteria. Or, use voting to align on the best ideas to move forward with. 
  3. Turn to Lucidchart to make polished, data-driven deliverables of your plan. This may take the form of product roadmaps, task boards, or an OKR dashboard to track and grade progress made.
OKR planning template using Lucid (click to open)

6. Value stream mapping and management

Lucidchart is a fantastic resource for value stream mapping, but value stream management—that is, not only mapping but also optimizing value streams—is an ongoing process that requires measuring, learning, adapting, and repeating the process. Lucidspark’s flexibility makes it easier to collaboratively brainstorm improvements, capture feedback, and share learnings so the business will continually grow more efficient. 

By documenting not only your value stream maps in Lucidchart—but also your ideas, findings, and adaptations in Lucidspark—you create a clear record in Lucid for new team members and stakeholders to understand how the value streams have evolved over time to reach their current state. Centralizing and sharing this information leads to continuous alignment and improvement. 

How to use Lucidchart and Lucidspark to manage value streams

  1. Bring in both leaders and practitioners across the organization to brainstorm what main value streams exist within your organization in Lucidspark. These could be things like, “billing a customer for services” or “launching a new product.” 
  2. Pick which one you’d like to focus on, and map the current state of this value stream in Lucidchart. Measure the amount of time spent in and between each step, and use Lucidchart’s intelligent formulas to automatically calculate flow efficiency. 
  3. Then, jump into Lucidspark to identify waste in the value stream and brainstorm improvements. Use the pen tool, sticky notes, and comments to mark up the value stream.
  4. Map out your ideal future state of the value stream in Lucidchart and identify metrics that you will use to measure the success of the changes you make.
Value stream mapping template with Lucid example (click to open)

When you add Lucidspark to your Lucidchart workflows, you can do big things. Not only diagramming but also the ideation and planning to launch your large-scale initiatives, like cloud migration or digital transformation. With the power of both products, you can collaborate and stay aligned across the entire project lifecycle—no interruptions, delays, or slow handoffs.

Lucidchart

Experience the combined power of Lucidspark and Lucidchart for yourself.

Give Lucidspark a try

Lucidchart

Lucidchart, a cloud-based intelligent diagramming application, is a core component of Lucid Software's Visual Collaboration Suite. This intuitive, cloud-based solution empowers teams to collaborate in real-time to build flowcharts, mockups, UML diagrams, customer journey maps, and more. Lucidchart propels teams forward to build the future faster. Lucid is proud to serve top businesses around the world, including customers such as Google, GE, and NBC Universal, and 99% of the Fortune 500. Lucid partners with industry leaders, including Google, Atlassian, and Microsoft. Since its founding, Lucid has received numerous awards for its products, business, and workplace culture. For more information, visit lucidchart.com.

Related articles

Bring your bright ideas to life.

Sign up free

or continue with

Sign in with GoogleSign inSign in with MicrosoftSign inSign in with SlackSign in

Get started

  • Pricing
  • Individual
  • Team
  • Enterprise
  • Contact sales
PrivacyLegal

© 2024 Lucid Software Inc.