business analysis models

9 essential business analysis models for the BA’s toolbox

Reading time: about 7 min

Topics:

  • Process improvement

The role of the business analyst (BA) requires not only sound data analysis but effective data modeling. The right visual model streamlines data and makes it easy for stakeholders at every level to identify and understand project strategies, relationships, and responsibilities.

In the past, data modeling meant writing out processes in plain text or sketching out a basic diagram.

Fortunately, those days are over.

Today, a good BA is armed with a diverse toolbox of strategies and visual modeling techniques to help them drive successful project outcomes.

As you read more about business analysis models, remember that Lucidchart helps you create elegant diagrams with intuitive design solutions, ready-made shape libraries for consistent notation, and clear data linking and formatting for dynamic data modeling and sharing.

Choose from a variety of business analysis templates to get a jump on your next project today. (Note that some templates contain advanced features that require a paid Lucidchart subscription.)

What is a business analysis model?

Simply put, a business analysis model outlines the steps a business takes to complete a specific process, such as ordering a product or onboarding a new hire. Process modeling (or mapping) is key to improving process efficiency, training, and even complying with industry regulations.

Because there are many different kinds of processes, organizations, and functions within a business, BAs employ a variety of visual models to map and analyze data.

Take a look at these nine essential business analysis models to include in your toolbox.

1. Activity diagrams

An activity diagram is a type of UML behavioral diagram that describes what needs to happen in a system. They are particularly useful for communicating processes and procedures to stakeholders from both the business and development teams.

A BA might use a UML diagram tool like Lucidchart to create an activity diagram to map the process of logging in to a website or completing a transaction, like withdrawing or depositing money.

2. Feature mind maps

Business diagrams aren’t just for late-stage analysis or documentation. They are also useful during a project’s initial brainstorming phase. Feature mind maps help BAs organize the sometimes messy brainstorm process so that ideas, concerns, and requests are clearly captured and categorized.

This visual ensures initial details and ideas don’t fall through the cracks so you can make informed decisions about project direction, goals, and scope down the line.
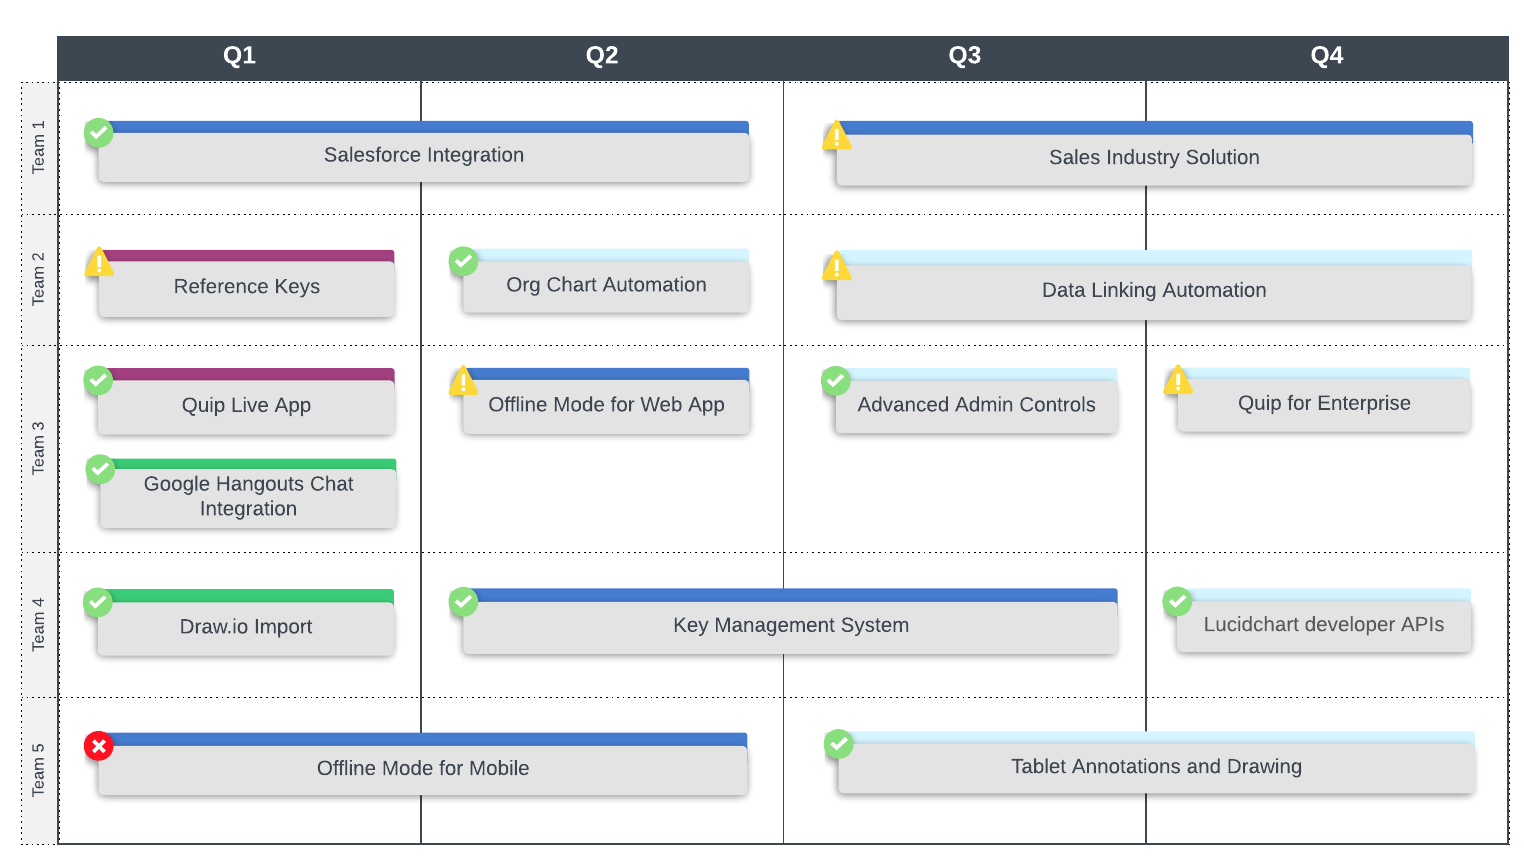
3. Product roadmaps

product (or feature) roadmap outlines the development and launches of a product and its features. They are a focused analysis of a product’s evolution, which helps developers and other stakeholders focus on initiatives that add direct value to the user.

The beauty of product roadmaps lies in their flexibility and range of applications. BAs can create different product roadmaps to illustrate different information, including:

  • Maintenance and bug fixes
  • Feature releases
  • High-level strategic product goals

While product roadmaps are commonly used internally by development teams, they are also useful resources for other groups like sales teams.

A defined product outline and schedule helps the sales team stay on the same page as the developers so they can deliver accurate, updated information to their prospects and clients. Because of product roadmaps' versatility and broad applications across teams and organizations, they are a core part of an analyst’s toolbox.

In Lucidchart, you can link data to and set conditional formatting within your product roadmap to quickly monitor your progress. Check out the template below to learn more.

product roadmap example
Product roadmap example (click on image to modify online)

4. Organizational charts

An organizational chart outlines the hierarchy of a business or one of its departments or teams. They are especially helpful reference charts for employees to quickly identify key stakeholders and points of contact for projects or queries.

Additionally, organizational charts prove useful for stakeholder analysis and modeling new groupings and teams following organizational shifts.

marketing org chart template
Marketing org chart example (click on image to modify online)

5. SWOT analysis

The SWOT analysis is a fundamental tool in a BA’s arsenal. SWOT stands for strengths, weaknesses, opportunities, and threats. A SWOT analysis evaluates a business’s strengths and weaknesses and identifies any opportunities or threats to that business.

SWOT analysis helps stakeholders make strategic decisions regarding their business. The goal is to capitalize on strengths and opportunities while reducing the impact of internal or external threats and weaknesses.

From a visual modeling perspective, SWOT analysis is fairly straightforward. A typical model will have four boxes or quadrants—one for each category—with bulleted lists outlining the respective results.

SWOT analysis
SWOT analysis (click on image to modify online)

6. User interface wireframe

Another essential business diagram is the user interface (UI) wireframe. Software development teams use wireframes (also called mockups or prototypes) to visually outline and design a layout for a specific screen. In other words, wireframes are the blueprints for a website or software program. They help stakeholders assess how users will navigate through the software or website to have a successful experience.

The level of detail in wireframes ranges from low-fidelity to high-fidelity prototypes. Low-fidelity wireframes are the most basic outlines, showing only the bare-bones layout of the screen. High-fidelity wireframes are typically rendered in the later planning stages and will include specific UI elements (e.g., buttons, drop-down bars, text fields, etc.) and represent how the final implementation should look on the screen.

7. Process flow diagram

A process flow diagram (PFD) is typically used in chemical and process engineering to identify the basic flow of plant processes, but it can also be used in other fields to help stakeholders understand how their organization operates.

A PFD is best used to:

  • Document a process.
  • Study a process to make changes or improvements.
  • Improve understanding and communication between stakeholders.

These diagrams focus on broad, high-level systems rather than annotating minor process details.

process flow diagram
Business process flow diagram (click on image to modify online)

8. PEST analysis

A PEST analysis often goes hand-in-hand with a SWOT analysis. PEST evaluates external factors that could impact business performance. This acronym stands for four elements affecting business: political, economic, sociological, and technological.

PEST analysis assesses the possible factors within each category, as well as their potential impact, duration of effect, whether the impact is positive or negative, and level of importance.

This type of business analysis helps stakeholders manage risk, strategically plan and review business goals and performance, and potentially gain an advantage over competitors.

9. Entity-relationship diagram

An entity-relationship diagram (ER diagram) illustrates how entities like people, objects, or concepts relate to one another in a system. For example, an ER diagram could show how the terms in an organization’s business glossary relate to one another.

ER diagrams comprise three main parts:

  • Entities
  • Relationships
  • Attributes

Attributes apply to the entities, describing further details about the concept. Relationships are where the key insights from ER diagrams arise. In a visual model, the relationships between entities are illustrated either numerically or via crow’s foot notation.

These diagrams are most commonly used to model database structures in software engineering and business information systems and are particularly valuable tools for BAs in those fields.

In Lucidchart, you can automatically generate an ER diagram when you import your databases and schemas. Follow this guide to try it out, or manually build your ER diagram with the template below.

entity-relationship diagram template
Entity-relationship diagram example (UML notation), (click on image to modify online)

Start visual modeling with Lucidchart

You have a variety of choices when it comes to visual modeling. The best BAs will have a diverse toolbox of business analysis diagrams so they can match the right models to each scenario, whether that’s a simple organizational chart for new employees or an in-depth SWOT and PESTLE analysis for executives and high-level stakeholders.

Lucidchart makes your job easier by providing flexible, ready-made templates, dynamic design features, and multiple sharing options so your team can stay in the loop and you don’t have to miss a beat. From simple flowcharts to complex visual models with data linking and conditional formatting, Lucidchart is a must-have resource for the savvy business analyst.

Human resources

Start diagramming in Lucidchart today!

Get started

Lucidchart

Lucidchart, a cloud-based intelligent diagramming application, is a core component of Lucid Software's Visual Collaboration Suite. This intuitive, cloud-based solution empowers teams to collaborate in real-time to build flowcharts, mockups, UML diagrams, customer journey maps, and more. Lucidchart propels teams forward to build the future faster. Lucid is proud to serve top businesses around the world, including customers such as Google, GE, and NBC Universal, and 99% of the Fortune 500. Lucid partners with industry leaders, including Google, Atlassian, and Microsoft. Since its founding, Lucid has received numerous awards for its products, business, and workplace culture. For more information, visit lucidchart.com.

Related articles

Bring your bright ideas to life.

Sign up free

or continue with

Sign in with GoogleSign inSign in with MicrosoftSign inSign in with SlackSign in

Get started

  • Pricing
  • Individual
  • Team
  • Enterprise
  • Contact sales
PrivacyLegal

© 2024 Lucid Software Inc.