Determine the audience and purpose for your organizational model
When you invest time in looking toward the future, it’s essential to define your goals before you get started. What timeline are you looking at? Are you looking to identify hires for the next quarter or year? What type of change are you trying to plan—are you reorganizing the company, putting together cross-functional teams, identifying gaps in skill sets, or implementing talent development programs? You may have multiple objectives for this modeling exercise, and that’s great! Just make sure you’ve captured where you want to go before you set out.
Make a list of data that you need to consider in your model to make decisions. For example, if you’re trying to implement growth plans for your employees, it might be helpful to have data on skill sets they have been trained on already.
Before you start to design your future org, you should also consider who will be looking at or using your model. Will it be for personal reference only, or will it be a resource for HR, line-of-business managers, finance, operations, etc.?
Each audience may have different preferences on what data they need to see to be able to follow and support your recommendations, so take that into account.
Add context to your current state
Once you’ve determined what information or data you need to add to your org chart based on your modeling goals and audience, it’s time to gather that data and put it in context of your org chart. Luckily, Lucidchart makes this process easy.
Simply select the “Overlay a new data set” option, and Lucidchart will start the import flow for your new data set. Using a field that is the same between the two data sets (e.g., employee ID), Lucidchart will automatically be able to map your new data or metrics to each employee on your existing org chart.

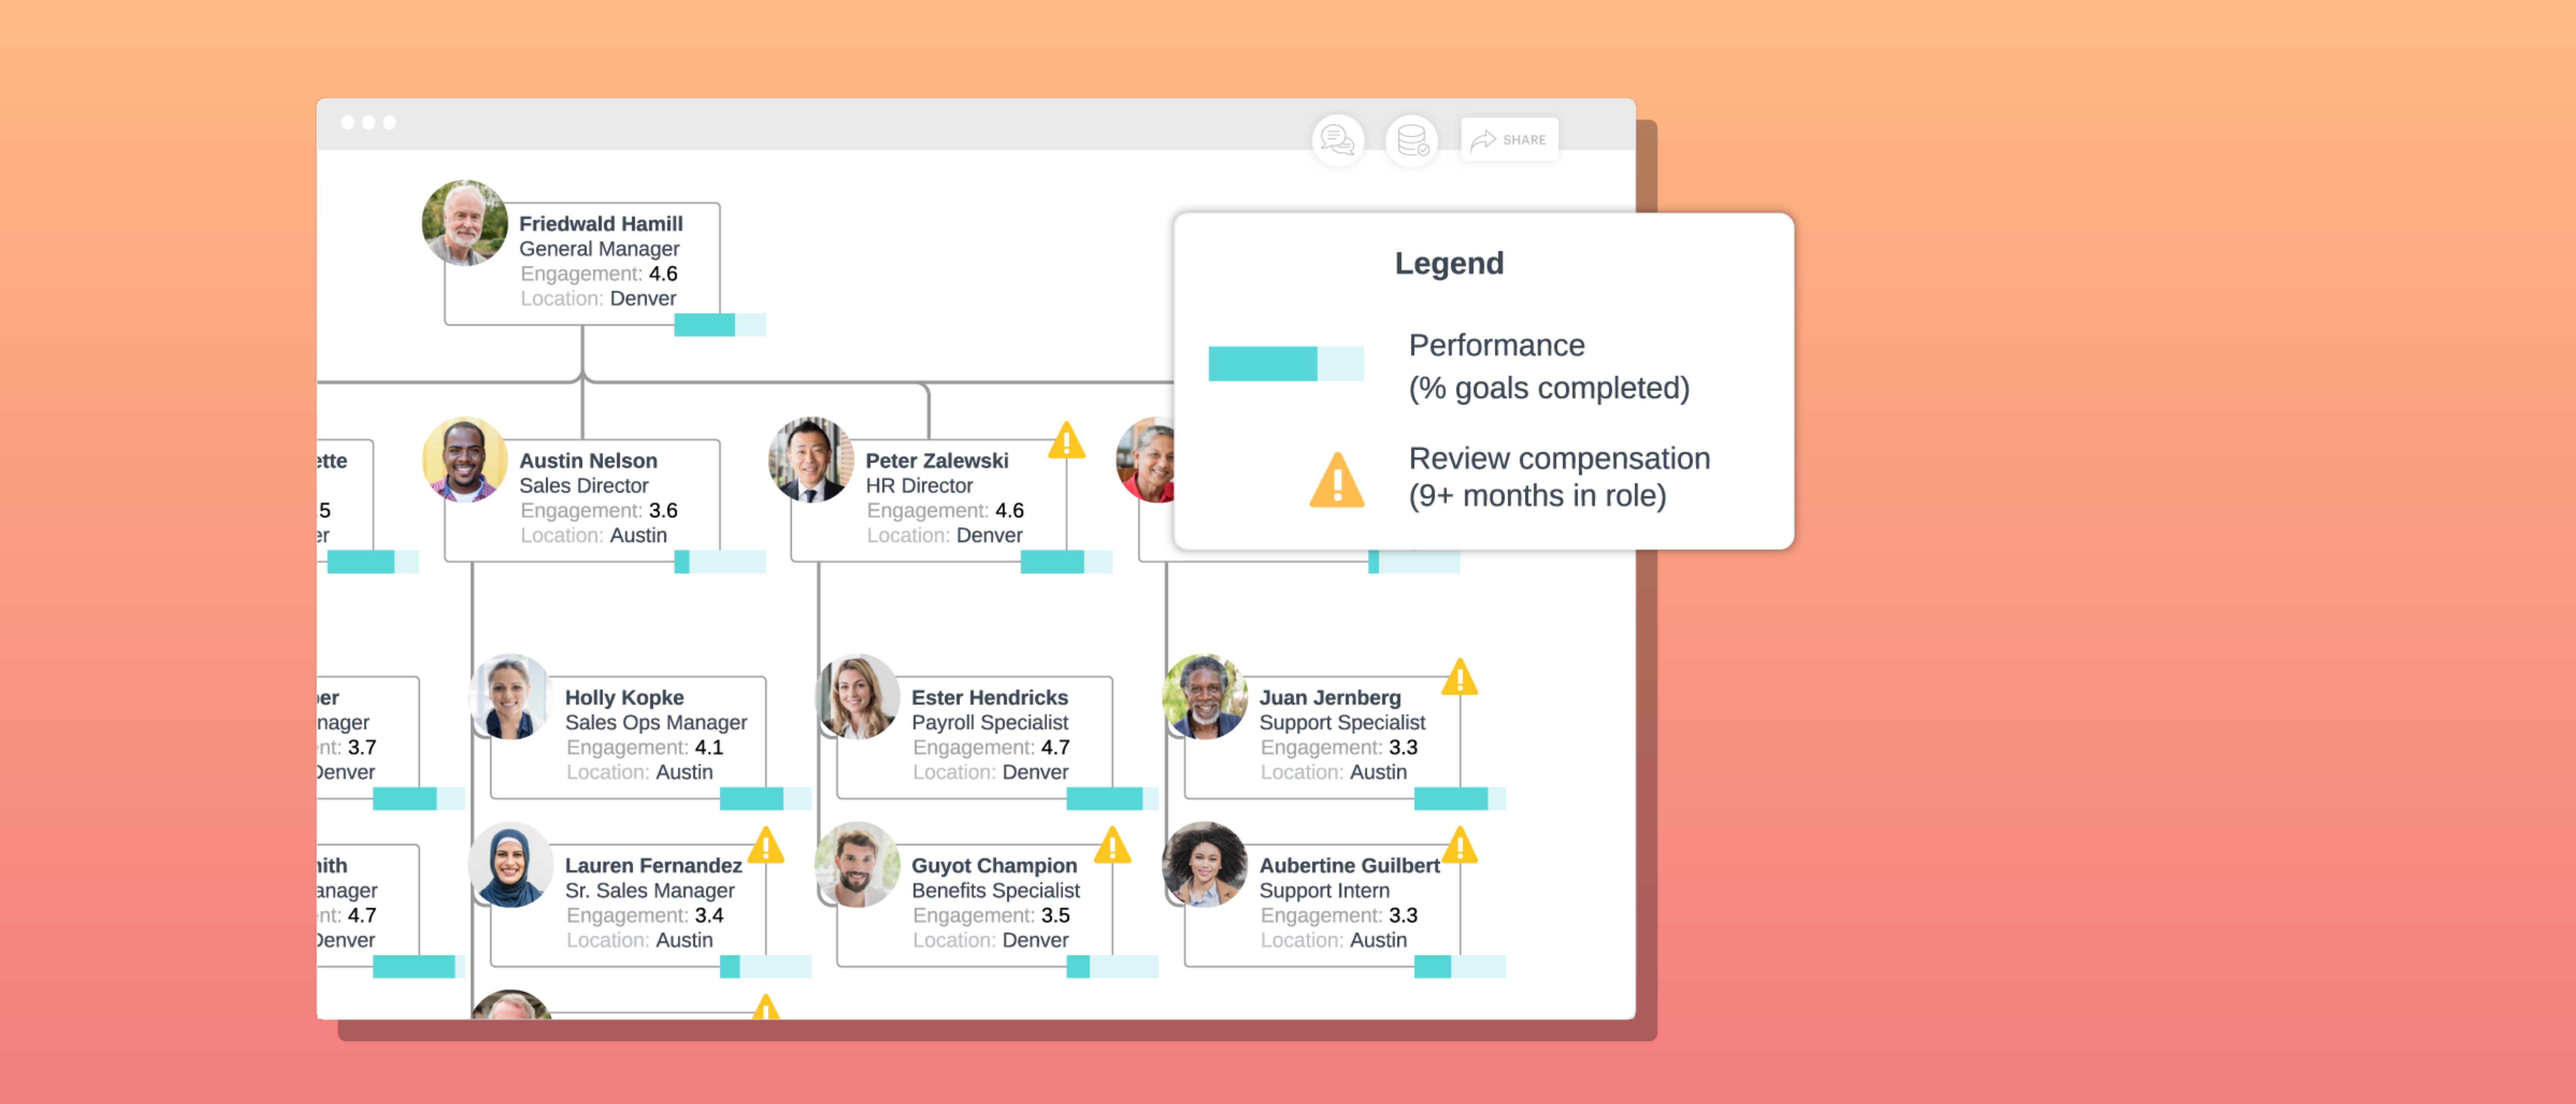
Now that the data is all available within Lucidchart, it’s time to make it digestible and highlight insights. Under “Employee Fields” in the org chart panel, you can select the employee data you want to display on each employee shape in your org chart.

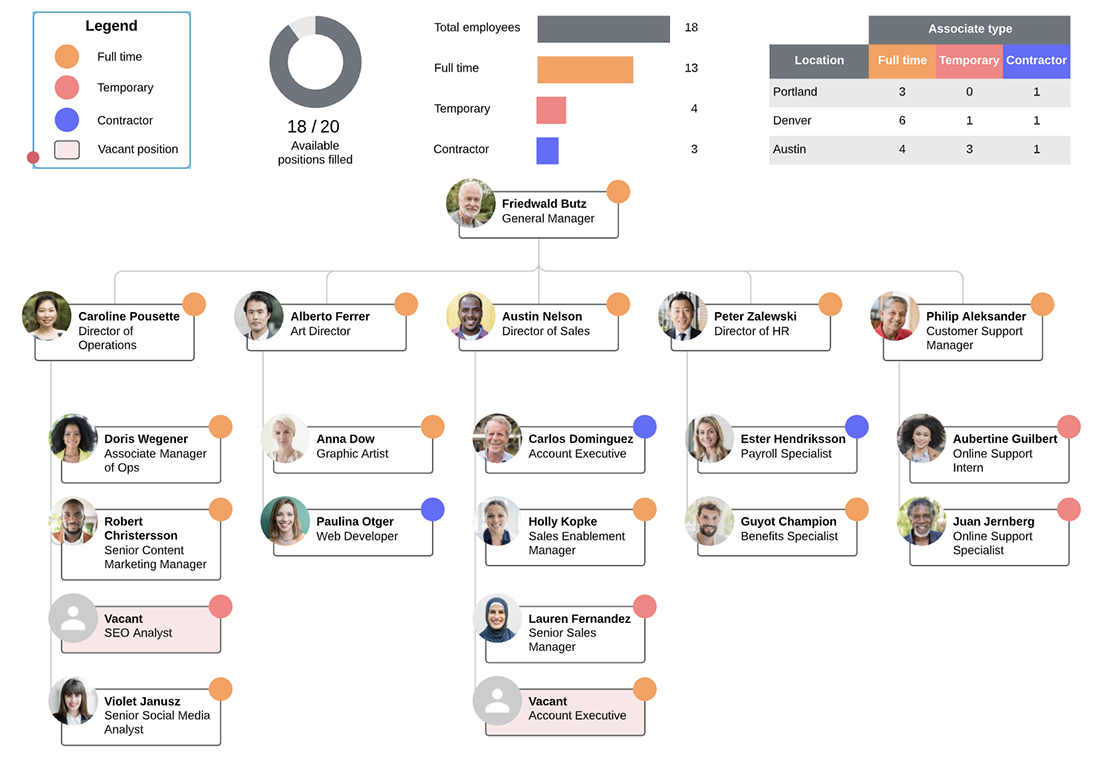
You can also use conditional formatting to highlight data on each shape. For example, you may choose to give employees who have been at the company more than five years a blue icon, or choose a specific background color to highlight managers in your org chart. You can use icons to create a visual map for skill set distribution or even show employee bandwidth with progress bars on each shape.

In addition to visual cues like icons and colors, Lucidchart allows you to view your organization outside of the traditional hierarchical relationships. With the click of a button, you can reframe your view to focus on any aspect of your organization that is captured in your data. For example, you can view your organization grouped by scrum team, by tenure, by skill set, by performance level, etc. Viewing your employees through these lenses can be extremely helpful when it comes to seeing patterns, trends, and making decisions.
Identify areas for improvement or change
Now that it’s easier to see patterns and trends across your employees, it’s much easier to start synthesizing insights and identify ways to shape your organization to prepare for the future.
For example, you may notice that:
- There are skill gaps on some of your teams (e.g., there just aren’t enough UX designers to cover your scrum teams) and that you will need to cross-train or hire to ensure you have the right resources to scale your business.
- Performance is lacking on a specific team.
- There are pay disparities that need to be addressed.
- Your company has too much junior talent on a team and needs to shuffle folks around to ensure there is enough mentorship and leadership to help the team be successful.
- There isn’t enough green talent to replace talent that will be retiring.
- Some teams are overwhelmed with their current bandwidth, which could provide a good opportunity to reshuffle workloads or talent or hire additional folks or interns to manage the load.
- A succession plan for a particular department needs an update.
As you analyze your visual data, take note of your insights so that you can take them all into account as you enter the planning phase.
Create a model of your future org structure
With many potential insights and challenges to address, it can be very helpful to move employees around or add spots for new hires experimentally before you commit to changes. There are a couple of ways that Lucidchart can make this modeling process easier for you:
1. Rearrange employees
Take advantage of the intuitive drag, drop, and add features to rearrange employees based on your needs.
2. Use formatting to distinguish between current and future state
For example, you can put dotted lines around new hire shapes, or use conditional formatting to call out changes you’d like to make.
3. Use layers to distinguish between current and future state
Within your diagram, you can create a new layer so that all of your changes can easily be separated from your current org structure. To toggle between current and future state, you can create a button that allows you to turn future state changes or off, so it’s easy to see the difference.
4. Use revision history
Revision history can be a great way to go back to your current state and start from scratch if your modeling doesn’t work as planned. Simply name the current version of your org, and Lucidchart will automatically save your changes on a regular cadence so you can go back to current state if you need to.
5. Use Group View
Once again, Group View can make it easy to move employees around outside of the traditional org structure. Simply toggle a button to view your org by cross-functional teams (e.g., scrum teams), office location, tenure, or skill set. Making changes is as easy as dragging and dropping employees from one group to another.
Viewing your organizational data with multiple lenses makes it easier to find the insights you need to stay ahead of the innovation curve as your company, customers, and competitive landscape continually shift.

Share with stakeholders for buy-in and approval
Once you’re satisfied with your model, you can share your org chart to get feedback and buy-in from stakeholders. You can do this within Lucidchart in these three ways:
-
Hold a meeting virtually or in-person and work together in your document in real time to discuss the model and make adjustments. Each person’s cursor will be labeled with their name so it’s easy to keep track of where people are at. You can even zoom to the location on the document that your colleague is looking at by clicking on their initial in the header.
-
You can present your model in a meeting with Presentation Mode. Simply add slides to your document, and then click through them just as you would in PowerPoint. You can even export your slides to Google Slides or use Lucidchart’s PowerPoint integration to put them in the context of another deck.
-
If you prefer to let stakeholders preview the document or provide feedback outside of a meeting, it’s easy to share the document with your colleagues with customizable permissions. You can provide them view-only, comment-only, edit, or edit-and-share access so that the information stays secure and you can get the feedback you need. Leaving comments in the document can be a great way for collaborators to leave feedback on specific shapes and employees so that they know exactly which changes need to be made.
Once you’ve received feedback, you’re ready to resolve outstanding comments and make the finishing touches.
Implement your model
Once you’ve solidified your changes and have gained the necessary approvals, it’s time to announce the changes more broadly to start the implementation phase.
In Lucidchart, make a copy of your document that omits sensitive information and provide a view-only copy for employees. Once again it’s really helpful to show both current and future state for your org, so that employees are very clear on the changes.
After you’ve announced changes, it’s important to update your systems and documentation. In Lucidchart, you can rename the future state layer of your organizational model to be current state and date your current state layer in revision history so that you can go back to it later to see how your org changed over time.
In addition to updating your org chart, Lucidchart can also help you update your human capital management (HCM) system with the new changes. If your HCM supports CSV uploads, you can export a CSV from Lucidchart that reflects the new org structure so that the updates are easier and faster to make.
Continue to iterate
It’s crucial to revisit your organizational structure often as your company, customers, and your competitive landscape continue to evolve. It can be helpful to set up a regular cadence to review your organizational structure so that you can always stay one step ahead of the game.
Take advantage of the flexibility of Lucidchart so that you can keep your employees and your company on the cutting edge.