
In Too Deep: The Perils of Data Analysis
Isaac Hales
Reading time: about 5 min
Topics:
I remember one warm Arizona afternoon when I was five years old. I was visiting my cousins, and we decided to go out for a swim in their backyard pool. I would say that I enjoyed swimming that afternoon, but I think that calling it “swimming” might be a bit of a stretch. I enjoyed splashing around, sitting on the steps of the pool.

For some reason, after a little while, I decided that it was time for me to try out my swimming skills in slightly deeper water. I pushed off from the steps and started flapping for this, my maiden voyage. As I drifted away from the safety of my steps, I soon realized that I, in fact, had no clue how to swim. In my mind’s eye, I can see my little foot clawing towards the edge of the steps as my little body sank like a rock. I was in too deep.
I’m not five anymore, and these days I think of myself as a fairly competent swimmer. I’ve found, however, that I still sometimes get in too deep—not in the deep end of the pool, but in the deep end of the data.
In my role as a data analyst, I spend most of my day trying to answer questions in order to gain a deeper understanding of how exactly Lucidchart can help our customers. Often the answers aren’t too far below the surface, but as I try to dig up the answers we’re looking for, I dig up three new questions at the same time. It’s easy to jump in and try to answer those questions too, but that is a slippery slope. I could get pretty far down the rabbit hole before I realize that I’m not exactly sure how my current line of inquiry will have any real business impact.
What’s the solution?
Impact-driven research.
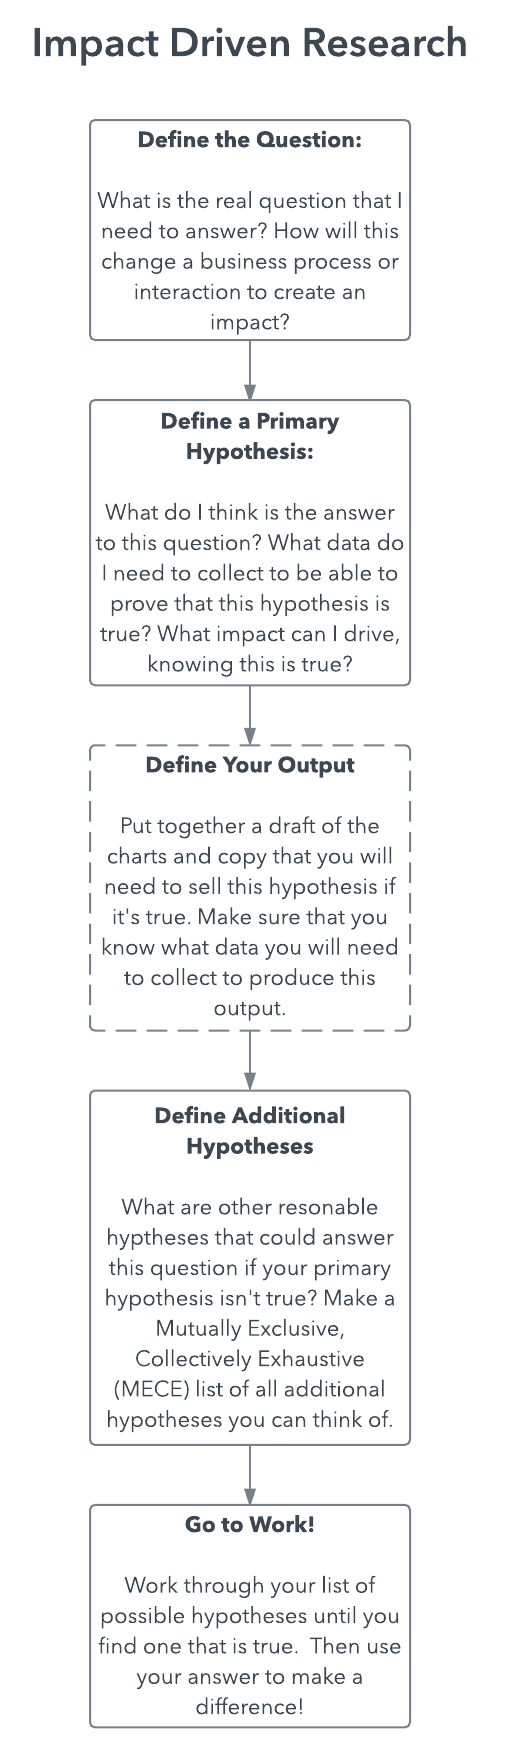
1. Find a question that will drive real impact.
In any project, the real goal is to make an impact, so start your project with that end in mind. Begin by thinking about how you can link your question directly to a real business impact. Often, the result will be a new “why” question. At the outset of a problem, I am usually asked a pretty simple question like “How many new users signed up last month?” but an answer to that question can’t really drive an impact. The “right” question depends on the circumstances, but in this case, I could ask “Why did we have fewer new users register this month than last month?” If I find the answer to this question, I’ll be able to directly address the root of the change, where I can drive the real impact. If you can’t find a question that will point to any of the impact levers in your business, you should think twice before starting the project.
2. Formulate a hypothesis.
Next, formulate a hypothesis of what you expect to find in your research. With each hypothesis, make sure that you can see a clear connection to one of your impact levers. If you find your hypothesis to be true, do you know what steps you need to take to drive an impact? For example, if you hypothesize that you had fewer new users this month because of a change to the homepage, your next steps could be to revert the change to the homepage or to run a test to better understand the full impact of the homepage “feature.”
Determine the data that you will need to collect and the results that you will need to see in order to prove your hypothesis true. It may be helpful to wireframe the specific charts you will present if the hypothesis is true and to write a draft of the slide deck or email that you will use to present your findings.

But what happens in the likely event that your hypothesis isn’t totally true?
3. Consider alternative explanations.
After fleshing out your first hypothesis, think about additional explanations. Formulate a list of alternative hypotheses and the data that you need to prove those hypotheses true or false. Be sure to think about how your plan for impact will change with each hypothesis. Ideally, your hypotheses will be MECE (pronounced me-see): Mutually Exclusive and Collectively Exhaustive. With a truly MECE set of hypotheses, you are guaranteed to find the answer to your question.
With your list of hypotheses in hand, you are ready to finally jump into the data. Gather all of the data that you need to prove your first hypotheses, and go to work. Because you’ve already defined what the data needs to look like for your hypothesis to be true, the work is pretty fast from here. With each hypothesis that you disprove, you’re one step closer to finding the true answer and unlocking your opportunity to make an impact.
It may be that not every question deserves a full list of possible hypotheses (and the work that goes into making that list). But if you approach the problem by first defining what your answer needs to look like in order to make an impact, you will notice the ever-present rabbit holes before you fall down them, and this will keep you from drowning in the ever-deepening pool of data.
Use this process flow or build your own in Lucidchart!
About the author

Isaac Hales works as a data analyst for Lucid Software. With a diverse background in cello performance, computer science, and data analysis, Isaac finds joy in making connections that others miss and turning innovative ideas into reality.
About Lucidchart
Lucidchart, a cloud-based intelligent diagramming application, is a core component of Lucid Software's Visual Collaboration Suite. This intuitive, cloud-based solution empowers teams to collaborate in real-time to build flowcharts, mockups, UML diagrams, customer journey maps, and more. Lucidchart propels teams forward to build the future faster. Lucid is proud to serve top businesses around the world, including customers such as Google, GE, and NBC Universal, and 99% of the Fortune 500. Lucid partners with industry leaders, including Google, Atlassian, and Microsoft. Since its founding, Lucid has received numerous awards for its products, business, and workplace culture. For more information, visit lucidchart.com.
Bring your bright ideas to life.


By registering, you agree to our Terms of Service and you acknowledge that you have read and understand our Privacy Policy.