SOX documentation flowcharts

Trying to Meet SOX Compliance? Meet Lucidchart

Shannon Williams

Reading time: about 7 min

Topics:

  • IT and Engineering
  • Lucidchart tips

If you hear the term “SOX,” and rather than baseball or comfy covers for your feet, you start thinking of meticulously planned processes that mitigate fraud, this article is for you.

Created as a reaction to the Enron and WorldCom accounting scandals in 2001, the Sarbanes-Oxley Act, commonly known as SOX, requires publicly traded companies in the United States to implement controls to address risks within the financial reporting process. Although these requirements can help companies streamline their processes and respond more quickly to a security breach, compliance can be costly and time-consuming.

If you’re an internal auditor, you know—you’ve been the one writing lengthy word documents to explain company procedures.

However, SOX compliance doesn’t have to be complicated when employees communicate visually with each other and with external auditors. See how flowcharts can help you understand and alter current processes and why you should choose Lucidchart as your visual communication platform.

Psst… did you know that we have an integration with AuditBoard, the leading SOX compliance software, that allows you to easily embed flowcharts within your narratives? Learn more about this feature.

Lucidchart flowcharts in AuditBoard

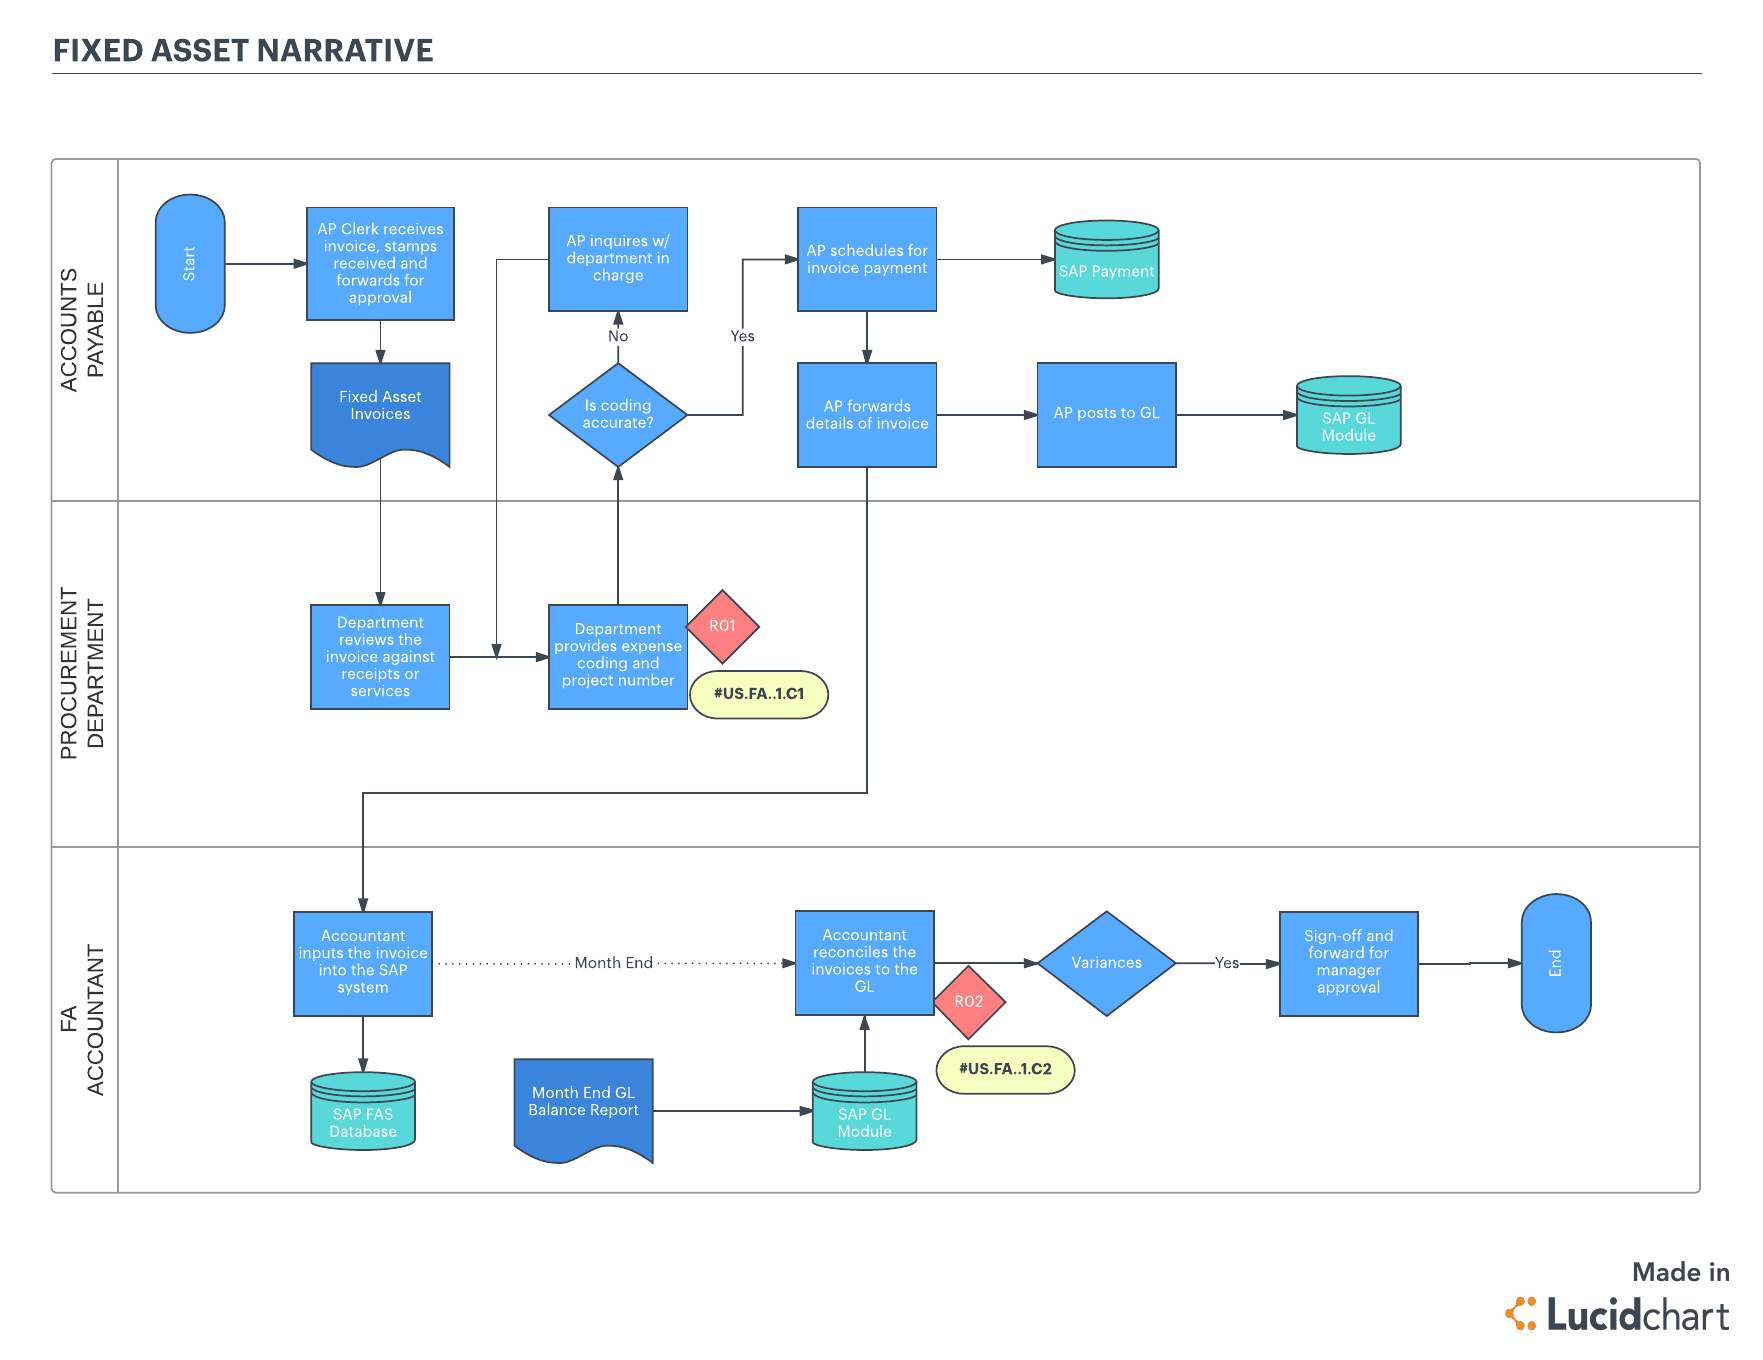
Flowcharts vs. narratives

Do you already create flowcharts to demonstrate SOX compliance? Great—we’ll skip the lecture. Learn why you should use Lucidchart to build this important documentation.

SOX compliance requires detailed documentation to prove that your company mitigates risk and eliminates any opportunities for fraud or misconduct. You now have the option of creating flowcharts in place of narratives.

It takes time to transition your processes to another format, but even if you’re only willing to change based on pressure from external auditors, we want to show you the clear benefits you’ll gain from developing flowcharts. You can:

  • Make any process simple and accessible for people who need to review it
  • Identify missing or redundant controls
  • Reconfirm your understanding of the process
  • Give stakeholders a chance to look at the process with fresh eyes
  • Mitigate risk by quickly identifying gaps in the process
  • Make control points stand out
  • Save time when updating procedures

Convinced? Now see how Lucidchart can make the process of building flowcharts even easier.

Why add Lucidchart to your list of essential software

If you haven’t thought to map out your financial processes before, we don’t blame you. Computers come standard with word processing, spreadsheet, and presentation software, but they don’t often give you an option to quickly create visuals. That’s where Lucidchart steps in to fill the gap.

Pass diagramming off to those who know the process best

You may be the one who’s expected to document processes for auditing purposes—but you aren’t the one who uses those processes on the daily. Lucidchart allows you to get feedback from other employees and nail down the exact process because it was created to support collaboration.

Create your flowcharts and send them to co-workers—you can even limit their access so they can only view or comment on the document. Would you rather ask others to do the heavy lifting? Unlike Visio or similar tools, Lucidchart takes no time to learn. Even those who have never diagrammed before can easily drag, drop, and connect shapes to build a professional document, so you can ask leadership to map out the processes they follow.

Spend less

We can suggest other ways you can use visuals in your work, but let’s be honest—you don’t want to pay a ton of money for software that primarily serves one function. Visio’s steep price tag ($299.99 per user) doesn’t make sense for non-technical companies. You would either need to limit licenses to a few people and leave them with the full burden of creating this documentation or face the facts that you’ll pay a lot of money to use about 10% of the tool.

Lucidchart starts at $7 per user per month for Team accounts, and it’s free for users who simply need to view your diagrams.

Streamline your workflow

Our cloud-based software eliminates any problems with versioning. Instead of uploading a new document every time you make changes—or exporting documents every time because not all of your stakeholders own the program—you only need to post one link to Lucidchart. Any changes you make are automatically available to everyone.

We strive to work wherever you do, so Lucidchart also integrates with leading applications, including G Suite, Microsoft Office, and Atlassian products, so you can include the visuals you create wherever you store your other SOX documentation.

If you use AuditBoard for SOX management, the process is even easier. Read our full announcement to learn how this integration works.

business process flow template
Get started quickly with this process flow template (Click on image to modify online)

3 steps to get your flowcharts up and running

If we’ve talked you into using Lucidchart to demonstrate SOX compliance, we’re not about to leave you high and dry to figure out this visualization process on your own. Take a look at these tips as you start building flowcharts.

1. Keep your flowcharts consistent

Use the same standards across all of your company’s documents in order to look professional and help auditors follow your processes. Your flowcharts should always flow in the same direction—typically from top to bottom and left to right.

Use these standard symbols to represent different points of the process:

start/end pointStart or end of the process
arrowArrow (shows direction and sequence of events)
manual activityManual activity
automated activityAutomated activity
decision pointDecision point (branches off into two or more scenarios)
documentDocument (e.g. contract, invoice, etc.)
systemSystem (e.g. file or database that stores information)

Additionally, you can use swimlanes to explain who owns each part of the process. The swimlanes should be labeled according to different departments or functions with responsibilities. In Lucidchart, look for the Containers library under Flowchart Shapes.

With a Lucidchart Team account, you can customize shapes for your team and save them in your own shape library, so every time someone starts a new process, it’ll follow the style of the others. Learn more.

2. Highlight your controls

Visuals make it easy to point out the controls you’ve put in place to comply with the Sarbanes-Oxley Act. Though there isn’t a standard shape for controls, you can mark parts of the process in red or another bold color, or you can choose a different symbol, such as a circle. Whatever you choose, save the shapes in your customized shape library.

3. Add pages for sub-processes

To avoid lengthy, overwhelming documents, you may want to create different flowcharts for each process and subprocess. And if you’re worried about finding the right process when you need it, don’t. In Lucidchart, you can add additional pages to your document—just click the plus sign at the bottom of the editor.

If you decide to record your subprocesses on separate pages (or even completely separate documents), you can connect all documentation using hotspots. Hotspots allow you to link one piece of your diagram to another page or document. You can diagram the overall process and link out to all of your subprocesses where applicable.

4. Create layers to show changes to the process

Need to improve your process to meet compliance? Show the changes alongside the original process using layers. Find “Layers” in the Dock on the right-side of the editor. Click “+ Layer” and start adding new components to the process. You can then set up a hotspot to toggle between layers and present your current and suggested processes together.

What are you waiting for? Try Lucidchart and take the headache out of SOX documentation. Sign up for a free account today!

About the author

Shannon Williams graduated from BYU in English and then turned to the world of marketing. She works as a content marketing specialist at Lucid Software. Instead of writing her novel (like she should be), Shannon spends her free time running, reading, obsessing about Oscar season, and watching Gilmore Girls on loop.

Lucidchart

Lucidchart, a cloud-based intelligent diagramming application, is a core component of Lucid Software's Visual Collaboration Suite. This intuitive, cloud-based solution empowers teams to collaborate in real-time to build flowcharts, mockups, UML diagrams, customer journey maps, and more. Lucidchart propels teams forward to build the future faster. Lucid is proud to serve top businesses around the world, including customers such as Google, GE, and NBC Universal, and 99% of the Fortune 500. Lucid partners with industry leaders, including Google, Atlassian, and Microsoft. Since its founding, Lucid has received numerous awards for its products, business, and workplace culture. For more information, visit lucidchart.com.

Related articles

Bring your bright ideas to life.

Sign up free

or continue with

Sign in with GoogleSign inSign in with MicrosoftSign inSign in with SlackSign in

Get started

  • Pricing
  • Individual
  • Team
  • Enterprise
  • Contact sales
PrivacyLegal
  • linkedin
  • twitter
  • instagram
  • facebook
  • youtube
  • glassdoor
  • tiktok

© 2024 Lucid Software Inc.