I sometimes feel anxious and struggle to understand where the feeling is coming from. The anxiety manifests itself as a physical sensation, centered loosely in my throat and upper chest region. It is not quite painful, but certainly uncomfortable, somewhat akin to the numb, lead-like sensation I get in my feet after sitting on them for too long. But unlike the discomfort in my feet, which I can alleviate by adjusting my position and letting the blood rush downward, my anxiety defies a simple fix. It is not rooted in my body but in my mind, which, like all other minds, is a very messy and complicated place.
Creating and assessing an anxiety map
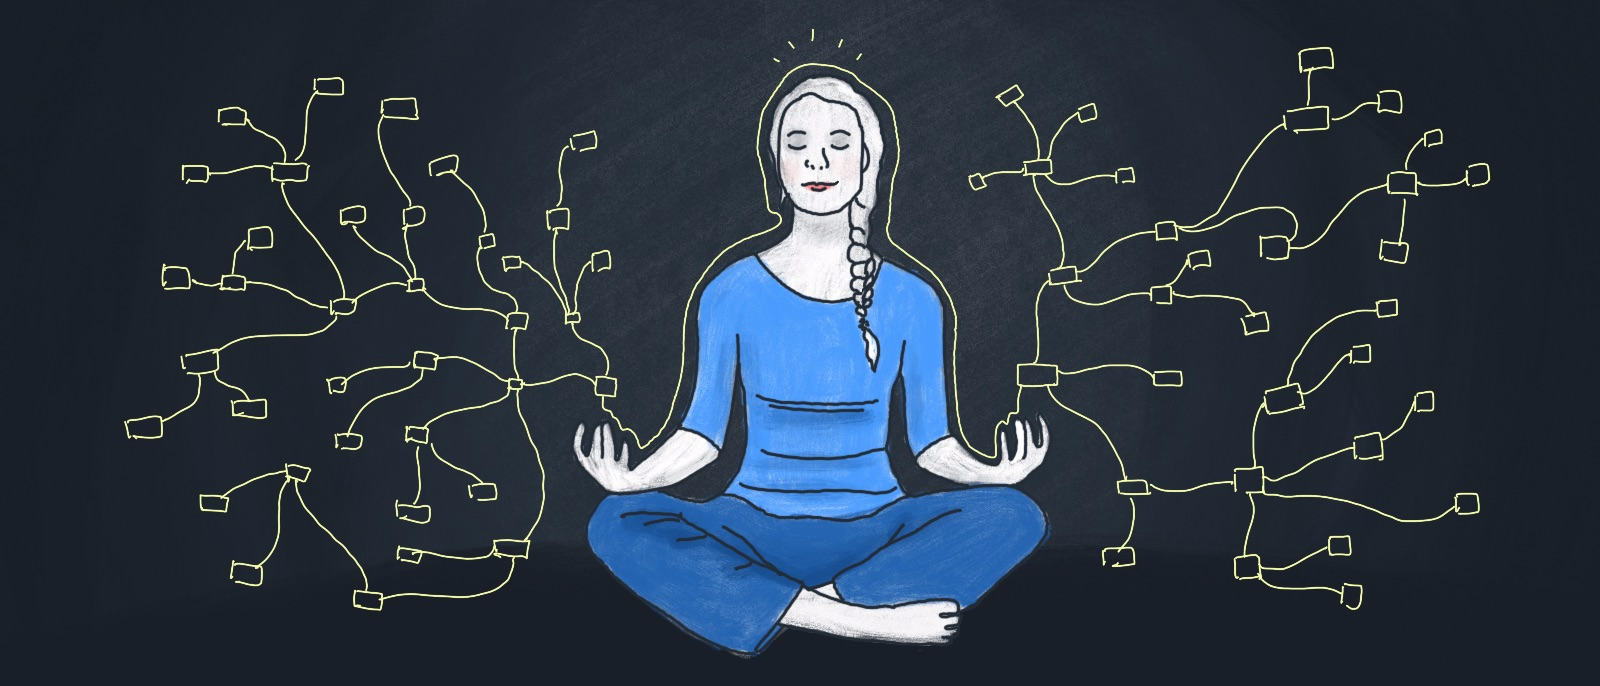
To sift through my mind and identify the thoughts and beliefs that contribute to my stress, I create what I refer to as anxiety maps–mind maps that I use to reflect and organize the tangle of thoughts in my head. I used to create these maps using pen and paper but have recently been creating them on Lucidchart, where I am not limited by space and can easily return to and modify my work. I believe that many people would similarly benefit from mind mapping to obtain clarity when they are faced with an emotion they do not quite understand. Here is the process of creating these maps that I have developed over the past few years.

1. Noting how I feel. The first step I take in creating an anxiety map is recognizing and honing in on the physical sensation that I am experiencing. Sometimes the feeling will arise at inopportune times, but I have found that it is better to address it right away than to try and ignore it.
I remember creating one of my first anxiety maps during an English class in the fall of my junior year. I was sitting toward the back of the room when I felt the familiar aching sensation in my upper body drag my attention away from our discussion and into my own head. Giving up on taking notes, I turned to a blank page in my notebook and scribbled in its center, “Why do I feel this discomfort?” I circled this question, thereby creating the central node of my mind map.
2. Identifying areas of concern. After creating my diagram’s centerpiece, I recorded the various areas of concern that were occupying my mind. They included my schoolwork, the relationships in my life, and the daunting task of deciding whether or not to study abroad the following semester. I jotted these categories down on the page, creating a second layer of nodes that I connected with lines to the circled question in the middle.
3. Moving from the general to the specific. After my diagram took on a basic structure, I expanded it outward by adding subcategories, examples, and detail. Off my “schoolwork” node branched concerns about specific assignments with upcoming deadlines and classes in which I was concerned about my grade. In turn, my “study abroad decision” node spawned sub-nodes relating to my fear that I would miss out on something regardless of my choice.
4. Assessing and analyzing. After adding everything I could think of to my diagram, I read through it systematically and noted the effect that each component had on the discomfort in my chest. As I did so, I realized that some elements of my life were not fueling my anxiety at all, but rather contributed to my stress because they were clumped up with other worries in my mind. In turn, I found that other issues unsettled me in a deep way—when I read through those parts of my diagram, the pain in my chest twinged like my fallen-asleep foot does when I try walking on it before the blood has fully returned.
I have used this assessment method many times since, often discovering a single issue at the heart of my anxiety. This discovery empowers me to cast aside peripheral concerns, knowing I will return to them later with a fresher and stronger mind. I then attend to the core issue by asking myself why it is bothering me so much and devising a plan to overcome it.
The process of mapping out my thoughts has become an instinct, and I now find myself going through the steps in my mind during times when I am unable to create a physical diagram. Last weekend, riding in the passenger seat of my friend’s car and trying to fall asleep, I felt the familiar tightness of anxiety creep into my chest. Against the red-black backdrop of my eyelids, I visualized the sensation as a white circle that sprouted branches as I went through potential causes of my stress. While some of the branches faded almost instantly, others lingered, feeding the pinching in my chest and allowing me to identify the root cause of my concern.

The power of visual thinking
In a blog post I wrote last month, I discussed how mind mapping in Lucidchart helped me complete my senior thesis by transforming my scraps of writing and research into an intricately structured network of ideas. When I reviewed the diagram displaying this network, I saw patterns previously buried by cluttered thinking and recognized convictions that had been guiding my work all along.
Correspondingly, when I create an anxiety map, the mess of thoughts in my head and the vague discomfort in my chest converge into a structure that reveals the interconnectivity of my experiences, body, and mind. When I study these maps, I often see that the issues causing my stress transcend the circumstances of my immediate situation. Noticing parallels between current and past bouts of anxiety, I start to understand the persisting beliefs that trigger these experiences, an understanding that calms my stress and empowers me to think more clearly in the future.
Visual mapping widens our lens of perception, enabling us to look beyond the individual components of a system and see the bigger picture.