Spreadsheets are complex, visually overwhelming, siloed, and uncollaborative. But while they have challenges, they are necessary for a wide variety of work, and many of us use them every day.
The good news? You can have your proverbial cake and eat it, too, with Lucid. In this article, we’ll discuss the features and tools in Lucid that are perfect for using in conjunction with your go-to spreadsheets, so you can keep on using them—just in a better way.
7+ Lucid features perfect for supporting your spreadsheets
Intelligent diagramming features
Lucid offers several intelligent diagramming features that leverage data you’ve already collected (like in those spreadsheets!) to bring extra value and meaning to your work through data visualization, analysis, and more. These features save you time and also offer contextual clarity that spreadsheets just can’t.
Here is a rundown of these features:
Data linking and automation
Turn your diagrams into powerful tools for analysis by linking them to spreadsheet datasets. Once a diagram is connected to a particular spreadsheet, the diagram will update automatically as changes are made, so you always have the most recent resource available.
AI capabilities
Through Lucid’s AI capabilities, you can create a diagram faster than ever. All you have to do is submit a prompt to describe what you need to visualize and Lucid will do the work for you by crafting a diagram that you can then share or iterate on so it’s exactly what you need to get the job done.

Become a pro at communicating the most critical aspects of your datasets with our conditional formatting course.
Learn morePresentation Mode
Need to present important data to stakeholders? You don’t need to create an entirely new asset like a slide deck. Again, with Lucid, you can leverage the work you’ve already done. Once you’ve created a diagram from your dataset, flip on Lucid’s Presentation Mode to automatically create a polished presentation in seconds.
Smart Containers
Smart Containers allow you to group data linked to your diagram by unique attributes, qualitative or quantitative. Then you can format them by customzing their fill color, border color, font, and more so the data is easier to understand.
Dynamic shapes
Rather than dealing with the complex clutter of a spreadsheet, add values and formulas to a dynamic shape to convey important data visually. These shapes will automatically change depending on data updates, so you can always work confidently knowing you have them most updated information available.
Layers
Layers take your diagram organization to the next level. With layers, you can build levels of design to easily show iterative states, phases, or different possibilities. Rather than having to search to make sure you’re looking at the right aspect of a project, layers creates different page views to draw attention to certain pieces. Plus, once data doesn’t appear overwhelming, it’s easier to focus on and understand. We call that a win, win.
Integrations
It’s easy to import your data into Lucid using our integrations with Google Sheets and Microsoft Excel. Once you’ve connected your accounts, sync and represent your spreadsheet data across Lucid. Generate charts and diagrams from the data, such as wireframes, flowcharts, and more. From there, you can keep them in Lucid or embed those visuals back into your spreadsheets, so you’re getting Lucid’s clarifying functionality without giving up the key tools you’re already using.
Level up your spreadsheets with Lucid
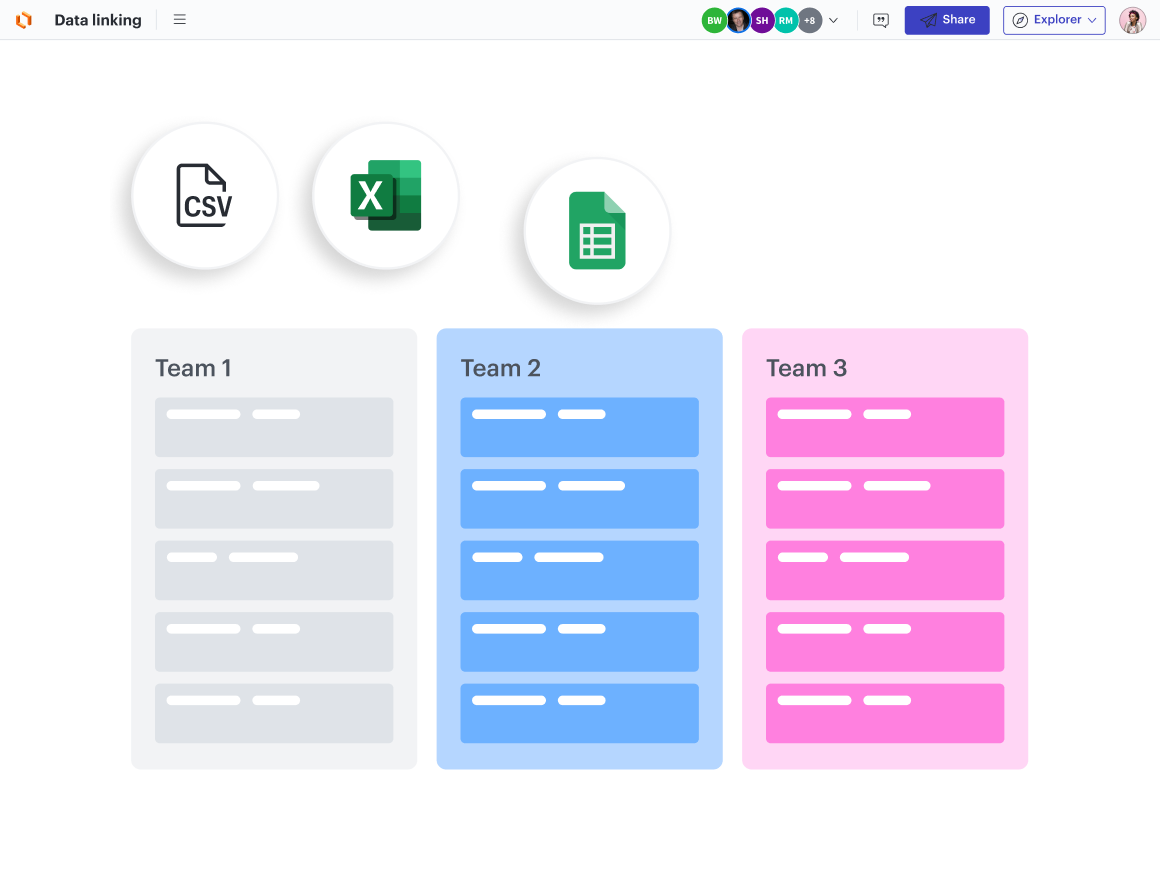
Spreadsheets were built to do a specific job, but Lucid offers a purpose-built solution for use cases that require deeper collaboration functionality. Connect the two to bring your data to life, save time, and gain clarity and context.

Consider the tasks and workflows you could automate by integrating your tools with Lucid.
Explore our integrations marketplaceAbout Lucidchart
Lucidchart, a cloud-based intelligent diagramming application, is a core component of Lucid Software's Visual Collaboration Suite. This intuitive, cloud-based solution empowers teams to collaborate in real-time to build flowcharts, mockups, UML diagrams, customer journey maps, and more. Lucidchart propels teams forward to build the future faster. Lucid is proud to serve top businesses around the world, including customers such as Google, GE, and NBC Universal, and 99% of the Fortune 500. Lucid partners with industry leaders, including Google, Atlassian, and Microsoft. Since its founding, Lucid has received numerous awards for its products, business, and workplace culture. For more information, visit lucidchart.com.
Related articles
Create diagrams faster using automation features in Lucidchart
Working visually shouldn’t mean more work for you. Find out how to automate your diagramming with Lucidchart to help your teams do more faster.
What is intelligent diagramming?
Intelligent diagramming refers to both a more intelligent way to diagram, as well as to the diagrams themselves, which are more intelligent and interactive.
Creating formulas in Lucidchart
Learn how to leverage formulas in Lucid to make your documents more dynamic and intelligent.
Next-gen diagramming: The difference between good vs. great diagramming software
Don’t settle for subpar diagramming software. Learn what characteristics differentiate run-of-the-mill diagramming solutions from next-gen ones.