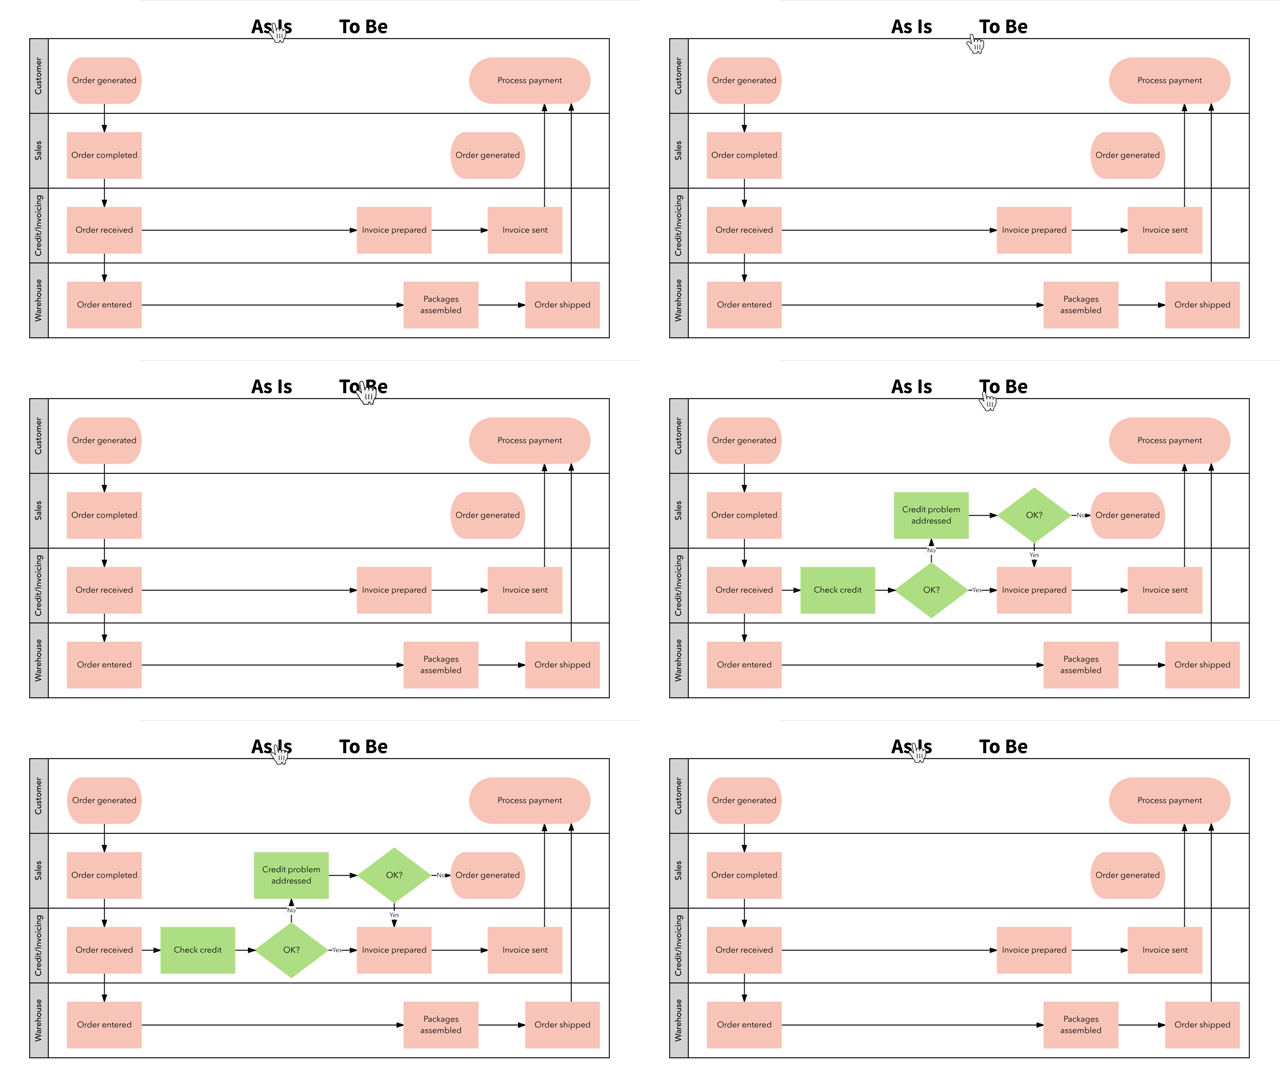
The power of visual communication
Lucid Content
Reading time: about 6 min
Topics:
In business, we tend to rely on email, instant messaging, and long text-based documents to describe ideas, information, and processes. Think about it—how often do you assign projects, describe projects, or make requests of colleagues in writing? If you answered “often,” you’re in a prime position to boost your team’s productivity.
Research shows that visual communication, instead of just text-based communication, provides an extremely effective way to share ideas, information, and processes. When you use visuals in addition to text, you can increase your team’s ability to synthesize information, grasp both the big picture and the details faster, increase their willingness to read, and drive innovation, productivity, and transparency.
In this article, you will learn how to leverage the benefits of visuals on your team with simple visual communication.
Improve your team’s ability to synthesize information
In the study Effects of Text Illustrations: A Review of Research, researchers W. Howard Levie and Richard Lentz aggregated the results of 55 studies to determine if visuals associated with text boost positive outcomes such as learning and comprehension. Overall, visuals that supported the text were beneficial in 98% of all of the studies and, on average, improved information synthesis by 36%.
So what happens when you leverage the power of visuals to lay out a project or an idea? It means that people understand your ideas more quickly. Direct reports can be more autonomous in executing on your vision, while executives can comprehend your plans faster and provide you with the resources you need to succeed.
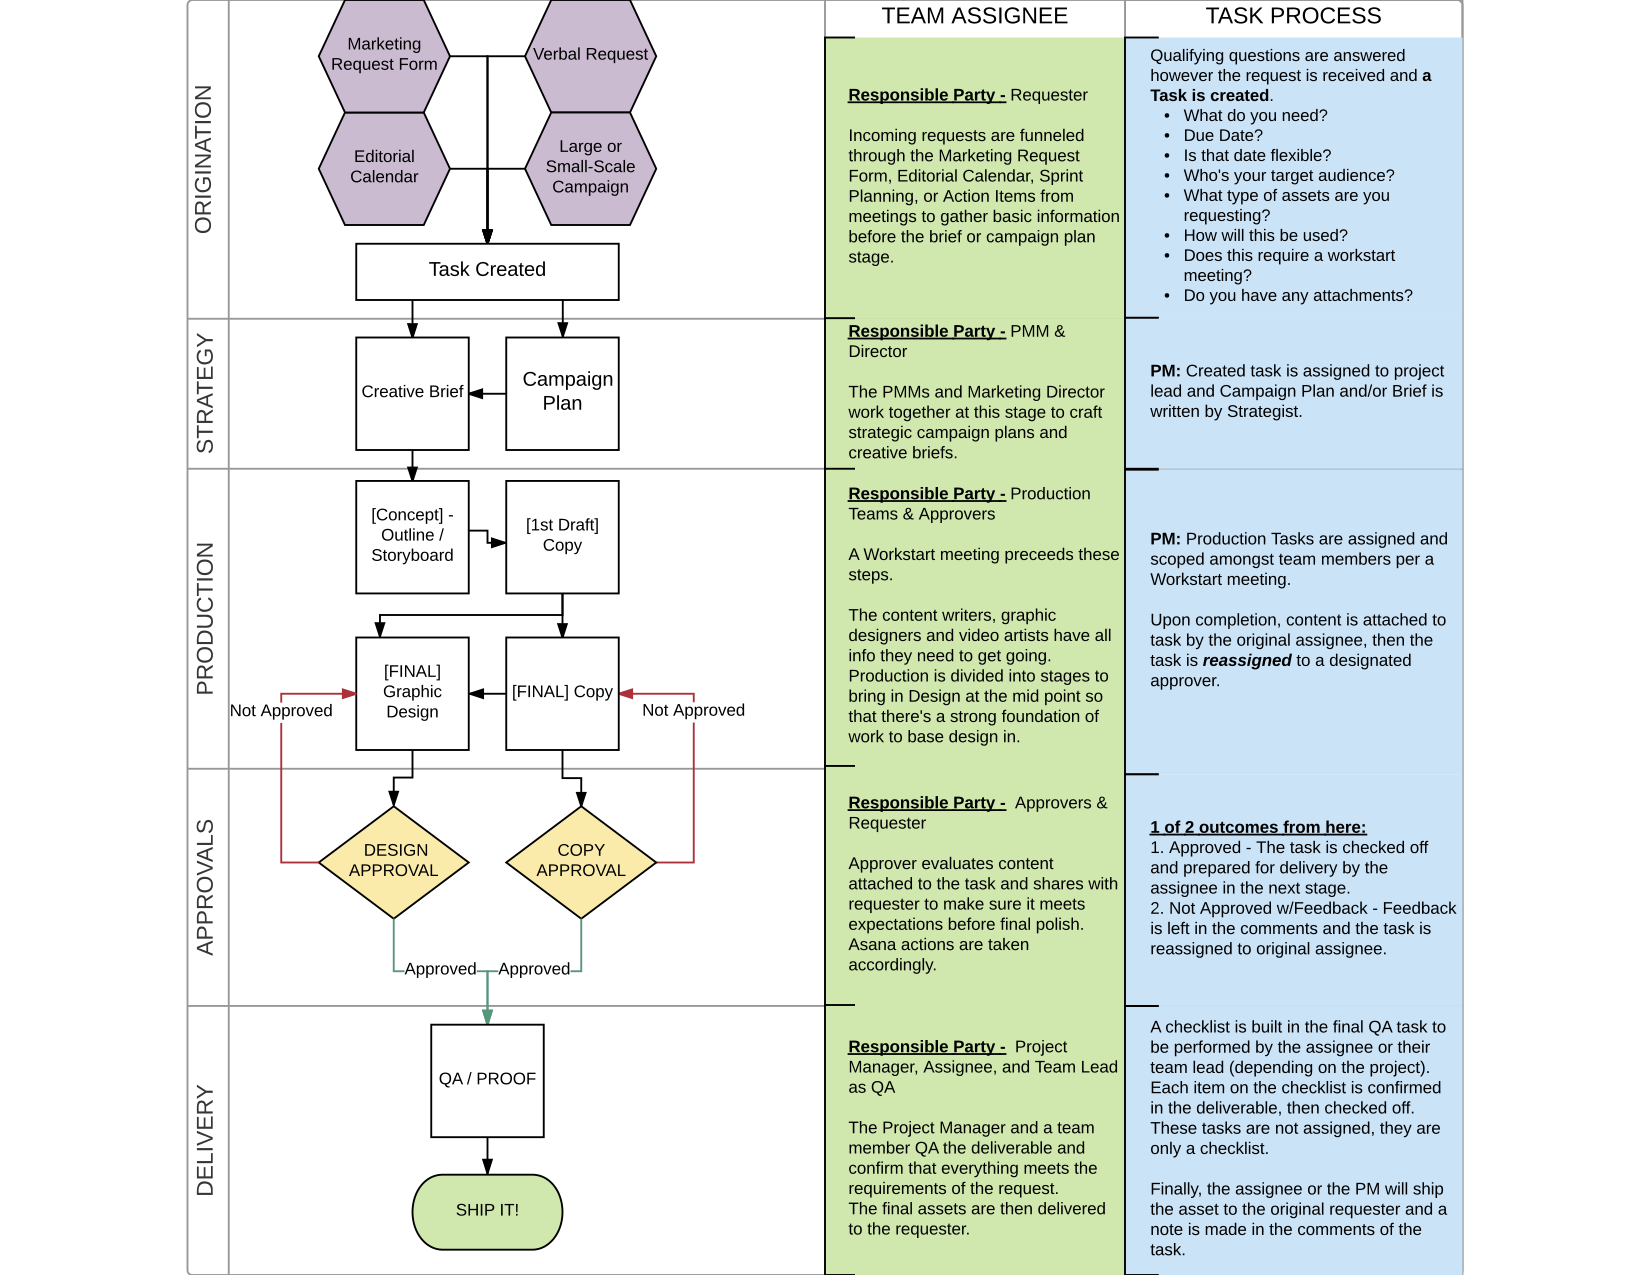
A visual project plan could look something like this:

With clearly defined roles and responsibilities and an execution plan, teams can quickly grasp the vision and execute it efficiently.
Break through the scanning barrier
With so much information at our fingertips, we’ve been trained to scan information instead of taking time to synthesize it. As part of a study, the Nielsen Norman Group examined 60,000 website page views to determine how long people spend on average reading the content on the page. The result? Most people only read 20-28% of the words on the page.
As web reading habits bleed into email reading habits, it’s no wonder that project details quickly get lost in a sea of text. Visuals can help people get to the point faster and can prevent details from being lost.
Help people see both details and the big picture
In the study Learning from Diagrams: Theoretical and Instructional Considerations by Winn and Holliday, the researchers concluded that visuals, specifically diagrams, can help:
- Direct attention to important information.
- Associate concepts.
- Generalize information.
- Discriminate between information.
To understand how diagrams impact the workplace, we spoke to Gabe Gloege , Director of Learning and Development at Pearson Publishing. At Pearson, sales reps create mind map diagrams that provide a quick overview of course content and how courses are linked together. Gabe describes the results as follows:
“It’s powerful, being able to see all that information at a glance, and the visual way that it changes your understanding and your perception of the content itself. Each course, when mind mapped, had a fingerprint that was unique to the knowledge of that course. And people started to remember and access it in that way. When you close your eyes and think back, ‘What is the information that I need to pull up in my head?,’ you see that mind map in your head. You go right to where it is. I think it’s a very powerful way for us to remember the information, access the information, and have a different relationship to it."
Gabe’s experience closely aligns with the research, showing that visuals clearly have a significant impact in helping people connect the dots and remember both the details and the big picture of a plan.
How this research stacks up against our findings
With clear external evidence for the power of visual communication, we wanted to see how diagramming stacks up as a visual communication method. We wanted to determine whether we’d see business-specific gains—such as increased innovation, productivity, and transparency—that supported external research on the effectiveness of visual communication.
In a survey, we asked 377 Lucidchart users about the benefits they’ve seen from using diagrams to convey ideas, information, and processes. These users confirmed that visual communication improves innovation, productivity, and transparency.
Innovate faster
Across a wide variety of roles and organizations, people said that they could innovate 40% faster when they used Lucidchart diagrams to communicate vs. traditional communication methods.
How would you explain those results? After further interviews with customers, we found that when people can map out a process or a system, it’s much easier to make connections between seemingly unconnected thoughts and find new and better ways to solve problems.

But it’s not just about finding innovative solutions to small problems. Nate McBride, CIO and head of the Innovation Architects Group at AMAG, explains how Lucidchart diagrams help him drive innovation at his company:
“We’re able to make decisions that we couldn’t make without Lucidchart because we can see all the potential outcomes. Each one of those decisions can have a multi-hundred thousand dollar or million-plus dollar effect.”
As Nate visually maps project outcomes, he finds innovative ways to solve problems and make better decisions. From identifying opportunities to optimizing processes to getting the next hot startup off the ground, working visually can help drive innovation at every level.
Increase productivity and transparency
Lucidchart diagrams, on average, drove productivity gains of 38% and transparency gains of 43%. When we talked to Jen Zagofsky, Senior Director of the Program Management team at DocuSign, she said that it all came down to increasing transparency and productivity for her geographically dispersed teams.
Jen wanted to improve the Development organization's planning cycle. Particularly, their increment planning. This process only worked if participants were physically in the same room as it required attendees to be hands-on.
“We would be in there all day, overwhelmed by this giant poster chart and simply trying to keep everyone sane until the end of the day,” recalls Kunal Arora, Senior Program Manager at DocuSign.
With visual communication and virtual whiteboarding, Jen and her team were able to drastically cut down their planning time and increase visibility into projects.
Kunal also mentions, “Lucidchart is absolutely required for our process now. I don’t know how we would get this information ready and in front of the executive team without the use of this tool. We are very excited about this process and how it is working for us,”.
We heard this feedback repeated over and over again—with real-time collaboration and streamlined communication, companies all over the globe are using visuals to increase productivity and transparency.
Implement visual communication
To reap the full benefits, you’ll need more than just emojis. You’ll need a platform that can connect to the places where you communicate. You’ll need a fast, easy way to build out your ideas. If you want to bring your ideas to life and see and build the future, a visual communication platform like Lucidspark is essential.
Whether you opt for whiteboarding or a digital solution, the benefits of visual communication are there for the taking. Will your team be the one to benefit from the visual edge?

Level up your next brainstorming session with Lucidspark.
Sign up for freeAbout Lucidchart
Lucidchart, a cloud-based intelligent diagramming application, is a core component of Lucid Software's Visual Collaboration Suite. This intuitive, cloud-based solution empowers teams to collaborate in real-time to build flowcharts, mockups, UML diagrams, customer journey maps, and more. Lucidchart propels teams forward to build the future faster. Lucid is proud to serve top businesses around the world, including customers such as Google, GE, and NBC Universal, and 99% of the Fortune 500. Lucid partners with industry leaders, including Google, Atlassian, and Microsoft. Since its founding, Lucid has received numerous awards for its products, business, and workplace culture. For more information, visit lucidchart.com.
Related articles
Communicate Visually and Solve Business Problems With Lucidchart Templates
Lucidchart offers hundreds of templates to help you communicate without needing to be a designer or data scientist. Let’s dive in and explore how the Lucidchart template gallery can help you create clear and compelling visuals quickly.
How visual collaboration changes the way your team works together
In this blog post, we’ll uncover the many benefits of visual collaboration, and the best practices for collaborating visually with your team.
How to design a process infographic (+ free templates)
In this blog post, we will explain what a process infographic is and how to create your own. Includes free templates!
Bring your bright ideas to life.
By registering, you agree to our Terms of Service and you acknowledge that you have read and understand our Privacy Policy.