
Communicate Visually and Solve Business Problems With Lucidchart Templates
Marie-Reine Pugh
Reading time: about 9 min
Topics:
We’ve got so many ways to tell our friends and family how we feel without using many (or any) words––emojis, selfies, memes, GIFs, and just plain old pictures. Another reason people fire off funny memes rather than typing out what they mean is because it’s a time saver. Do a quick search and voilà! You’ve found something that says just what you mean to say (and a bit more besides).
Communicating quickly and effectively at work, however, requires a bit more complexity than a couple of praying hands emojis. So how can you make your big data sets intelligible to executives? How do you synthesize your research for your customer? How do you convert your hand-scribbled notes into a clear, appealing visual? You need process flows, org charts, mind maps, dashboards, infographics, customer profiles, journey maps, and the list goes on.
All of this can feel overwhelming to tackle by yourself. But don’t worry––Lucidchart’s got your back.
Lucidchart is a visual workplace with hundreds of templates to help you communicate without needing to be a designer or data scientist. In addition, we recently launched our new template gallery and several automated features to make it faster than ever to get you diagramming.
Let’s dive in and explore all the ways that Lucidchart’s templates can help you create clear and compelling visuals quickly to step up your professional communication.
Our template gallery
Whether you’re new to Lucidchart and need some guidance to get started, or you already use Lucidchart but haven’t taken advantage of our most recent features, the template gallery can help you find what you need and show you what’s possible.
There are several ways to browse the new template gallery. First, the categories on the side refine your search. Depending on the type of diagram or the subject matter, you’ll be able to limit the number of templates you look through and find what you need more quickly. On the other hand, if you know just what you want or you want to limit your search using keywords that don’t appear in any of the categories, use the search box at the top of the gallery.
But the template gallery is more than just a list of our templates––it also shows you what each template will look like and tells you a little bit about what you can expect in terms of features, use case, and level of detail for each template. When you click on the thumbnail, you’ll see a larger preview of the template and a short description.
Pro tip: Look for our data icon in the top right-hand corner of the thumbnail. Templates with this icon have linked data in them.
To get started and find all the templates you need, watch a tutorial of Lucidchart's template gallery.
Navigating the gallery by template title
To find specific shape libraries: Search for templates that have “blank” in the title. These will be blank canvases with preselected shape libraries. We have several such templates available for our most popular shape libraries:
- AWS
- Floorplan
- Flowchart
- Org chart
- And more!
To find extra details and inspiration: Search for templates with the word “example” in the title. These templates model a fully realized diagram and include sample content. They may also include icons, conditional formatting, linked data, etc.
To find preformatted shapes with no content: If you’re want something in the middle, then the rest of our templates are for you, Goldilocks. They contain preselected shape libraries we think you might need and basic design elements, such as preformatted shapes, lines, and fonts but won’t have sample content.
Visit our template galleryPro tip: When opening any template, look to the resource bar for more details on how to use and customize it. If you need more direction, the resource bar also includes links to relevant tutorials, help center articles, and blog posts.
Use templates to solve your business problems
Lucidchart has over 700 templates to make the most of your workday. We’ve highlighted a few of our most popular templates as examples of the different use cases we offer.
Process mapping
Technical and systems management
Product development
People management
Event planning
Space planning and management
Customer profiling and analysis
Sales and customer relationship management
Project management
Process mapping
Everyone wants to be faster and more productive at work, and we all likely have procedures, routines, or protocols that we follow for that purpose. But is everyone on the same page as to what they have to do? Can you tell if they’re helping or hurting you?
Clear up all that confusion with our flowcharts. Use them to implement better workflows and improve how you get work done. Make them do more of the heavy lifting by combining them with swimlanes and other shapes libraries, like Dynamic Shapes or Smart Containers.
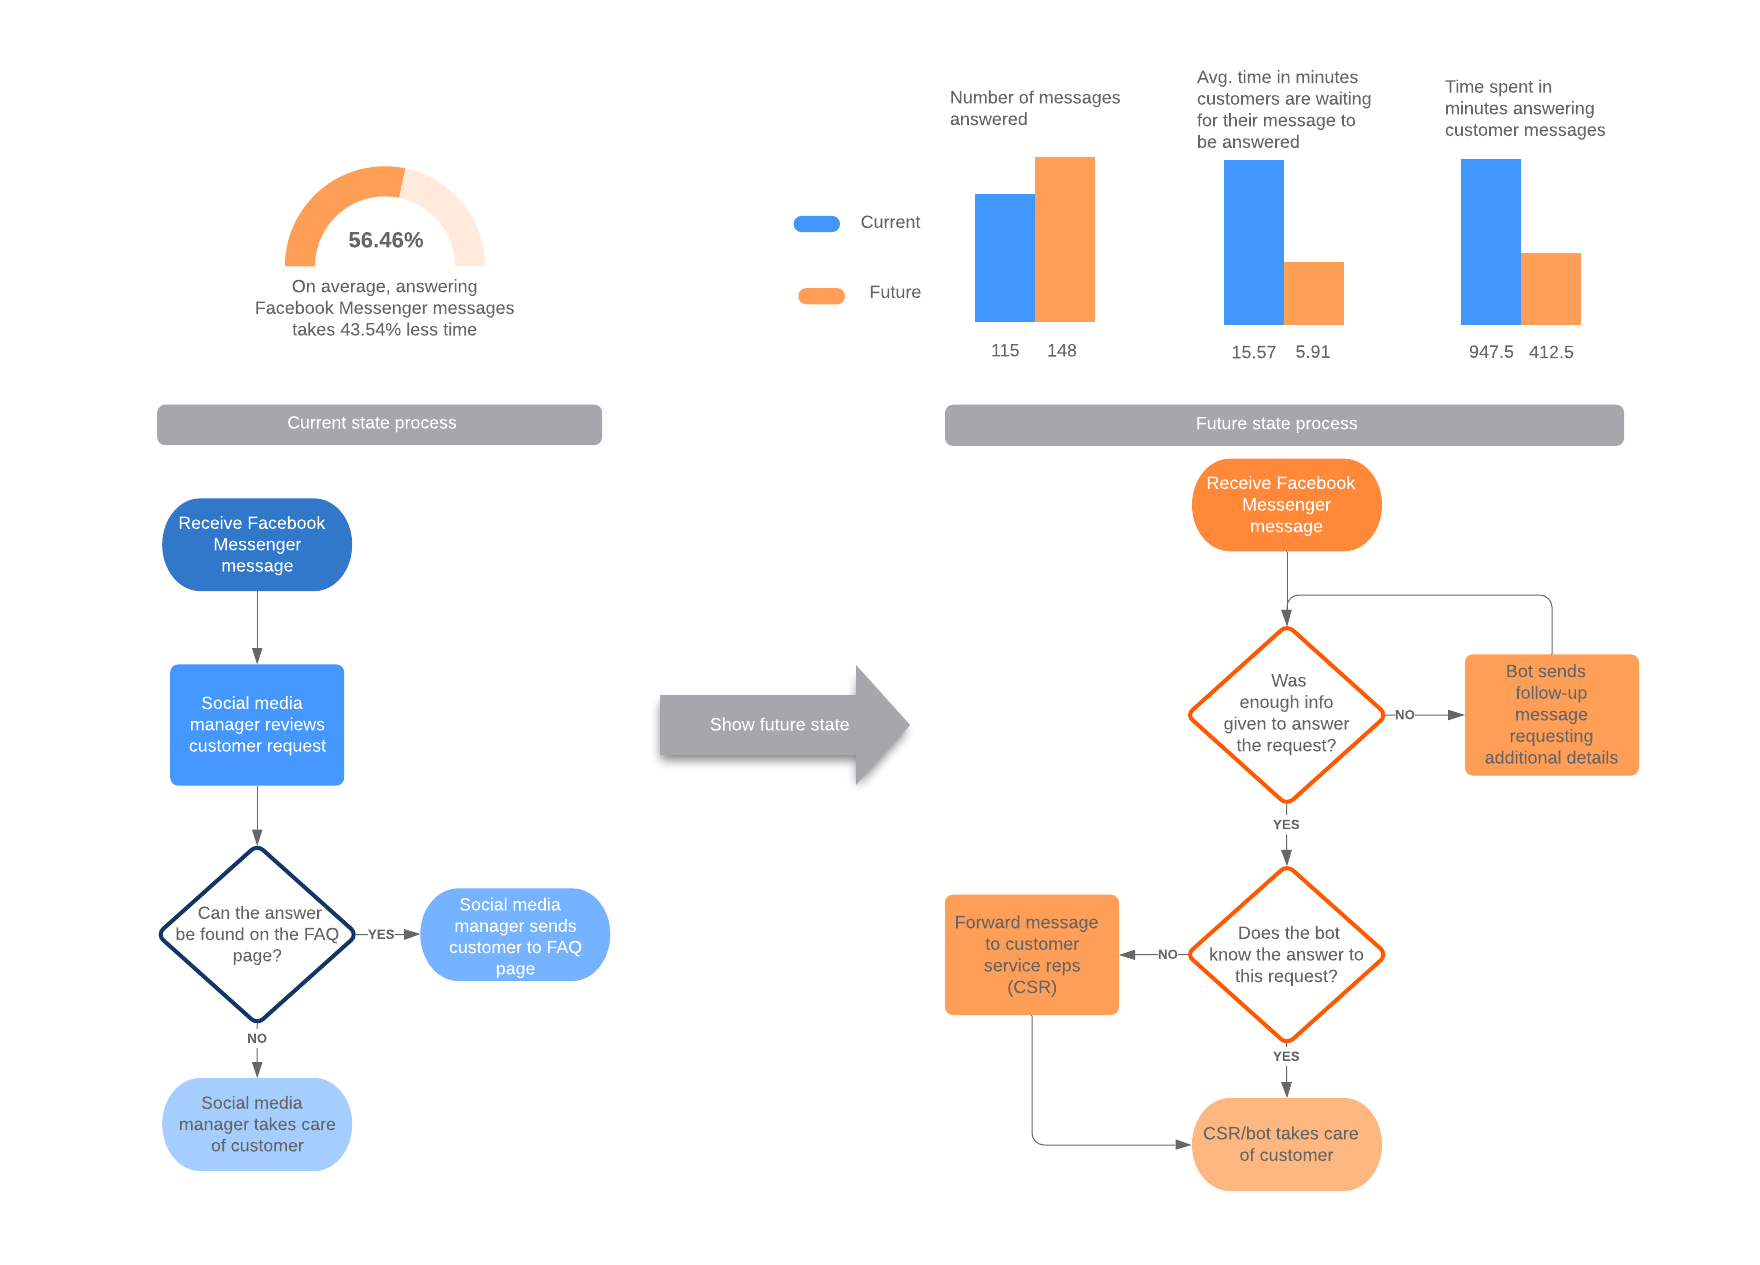
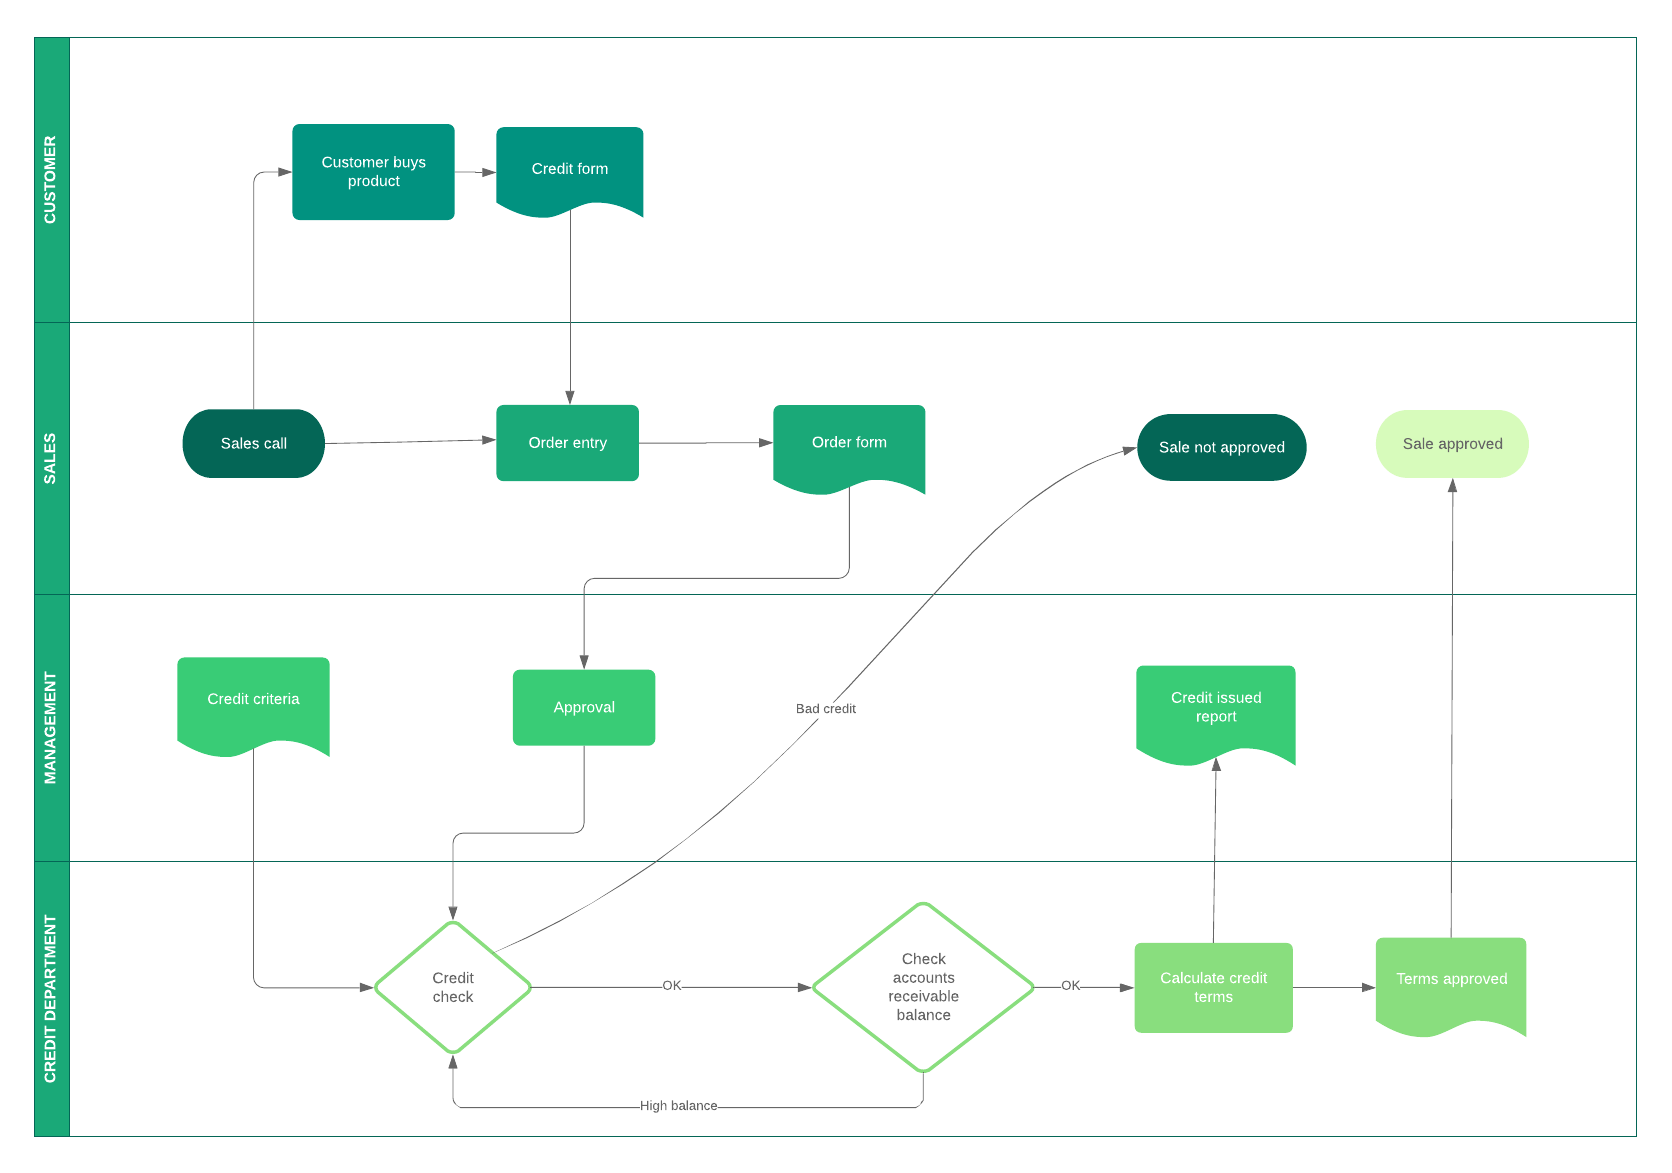
Technical and systems management
Keep your organization nimble and secure by mapping out your systems in Lucidchart. Whether you’re implementing a specific system or just need to see what’s going on inside your data, our templates make it easier to interpret, resolve, and communicate about problems with our shape libraries and advanced features, like conditional formatting and Smart Containers.
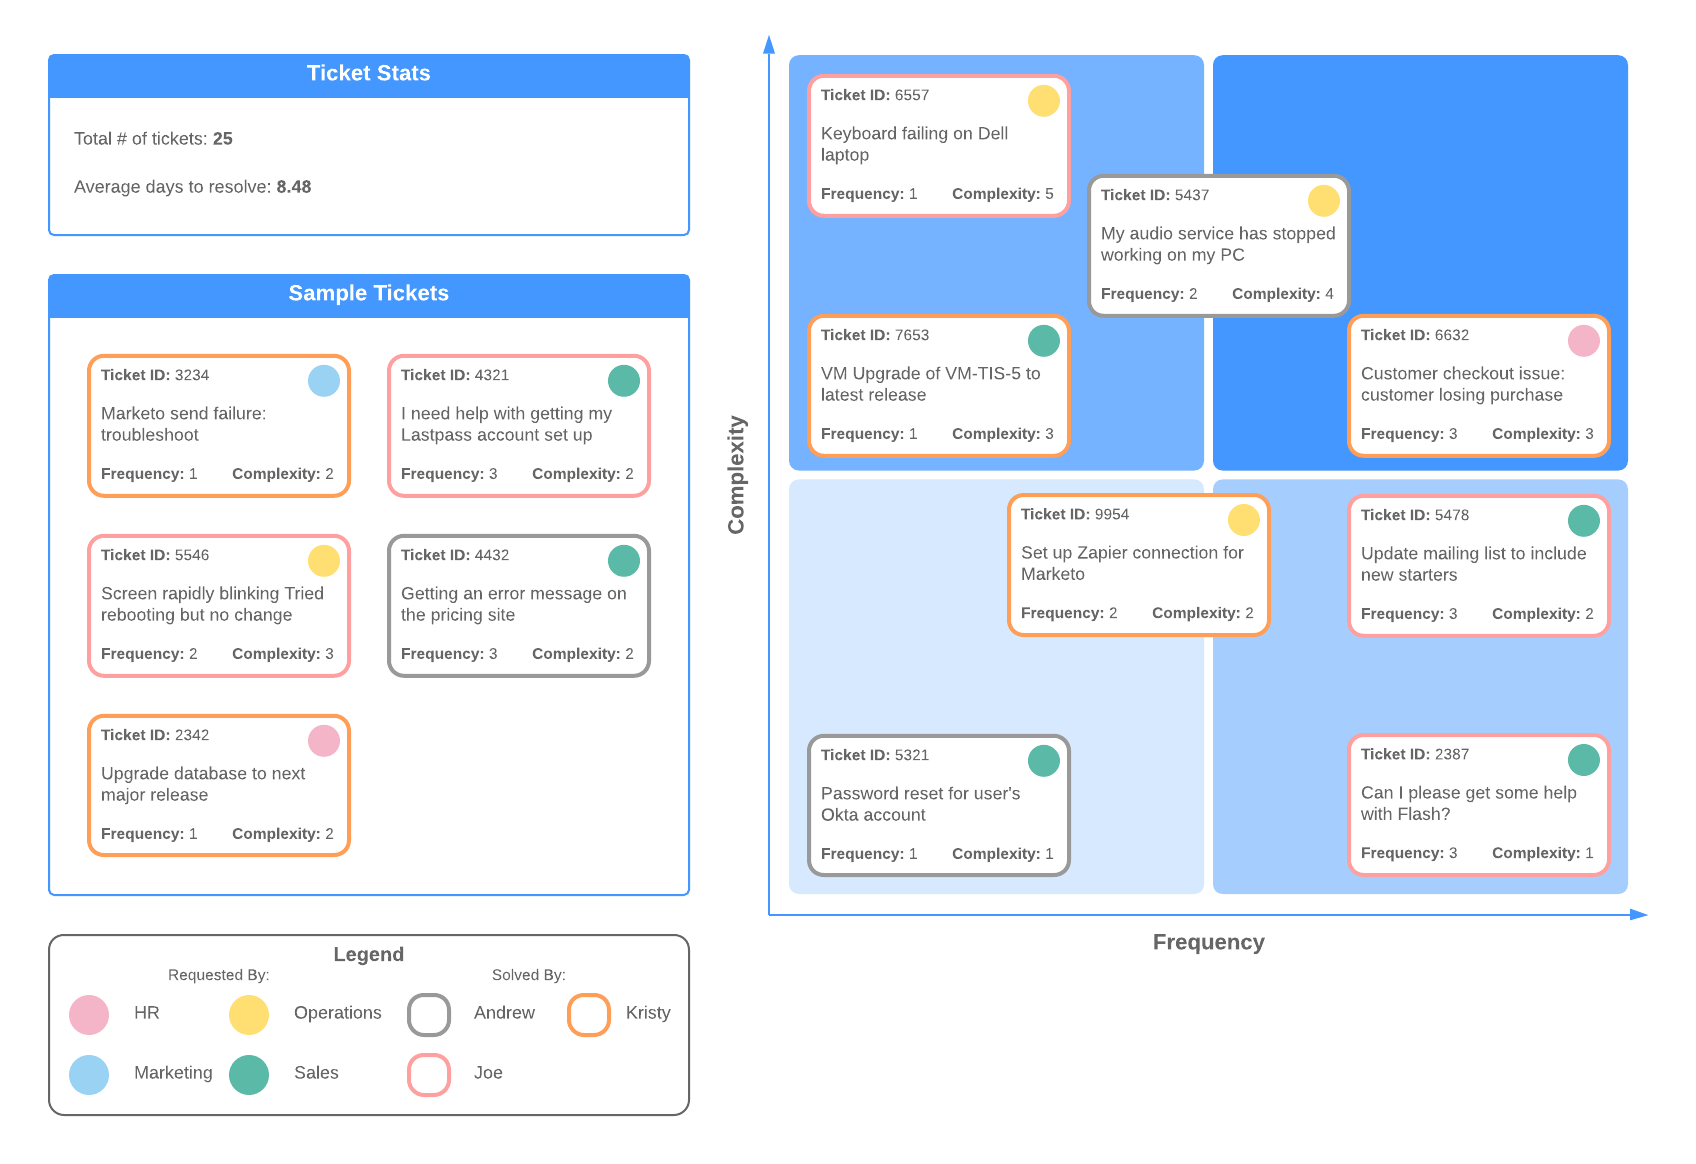
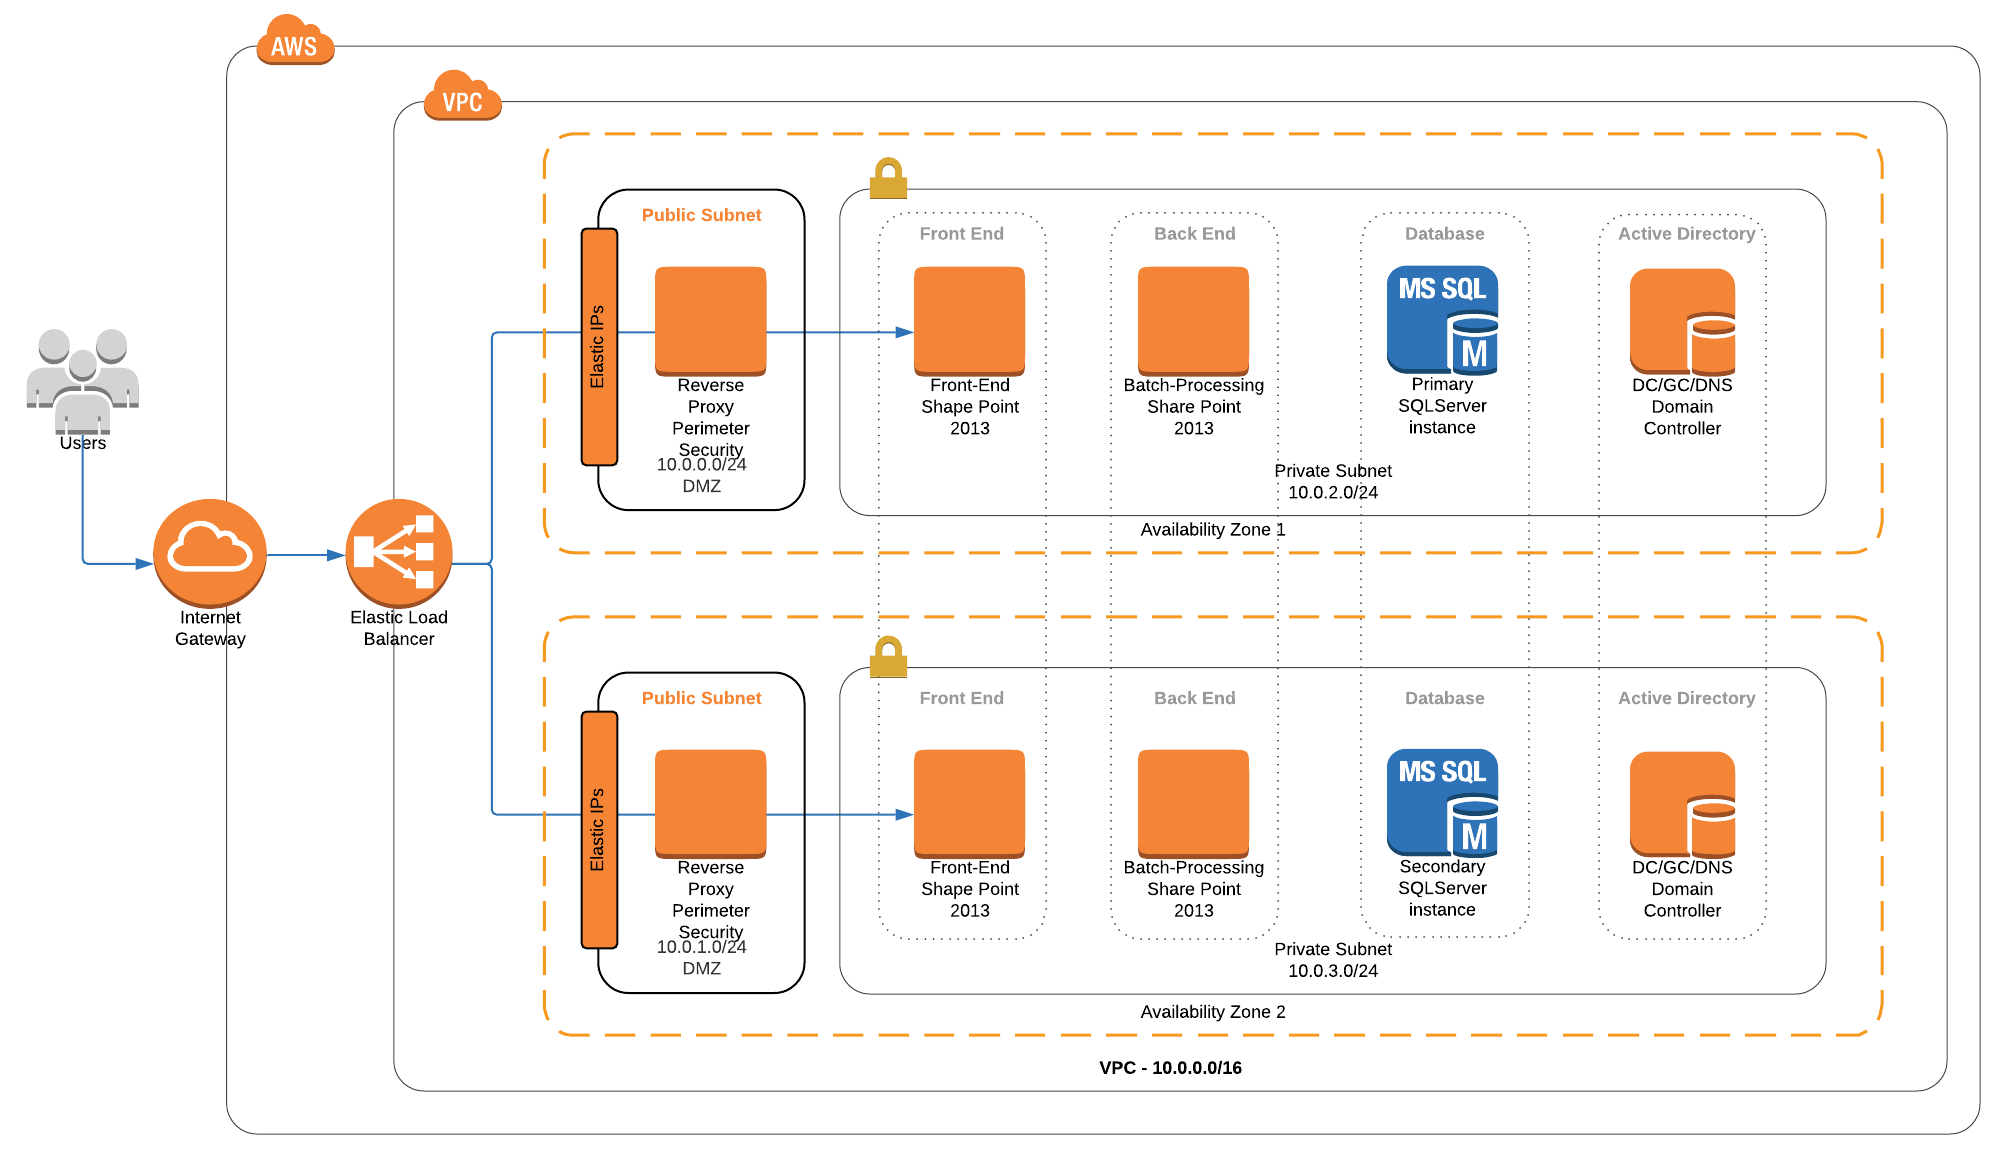
Product development
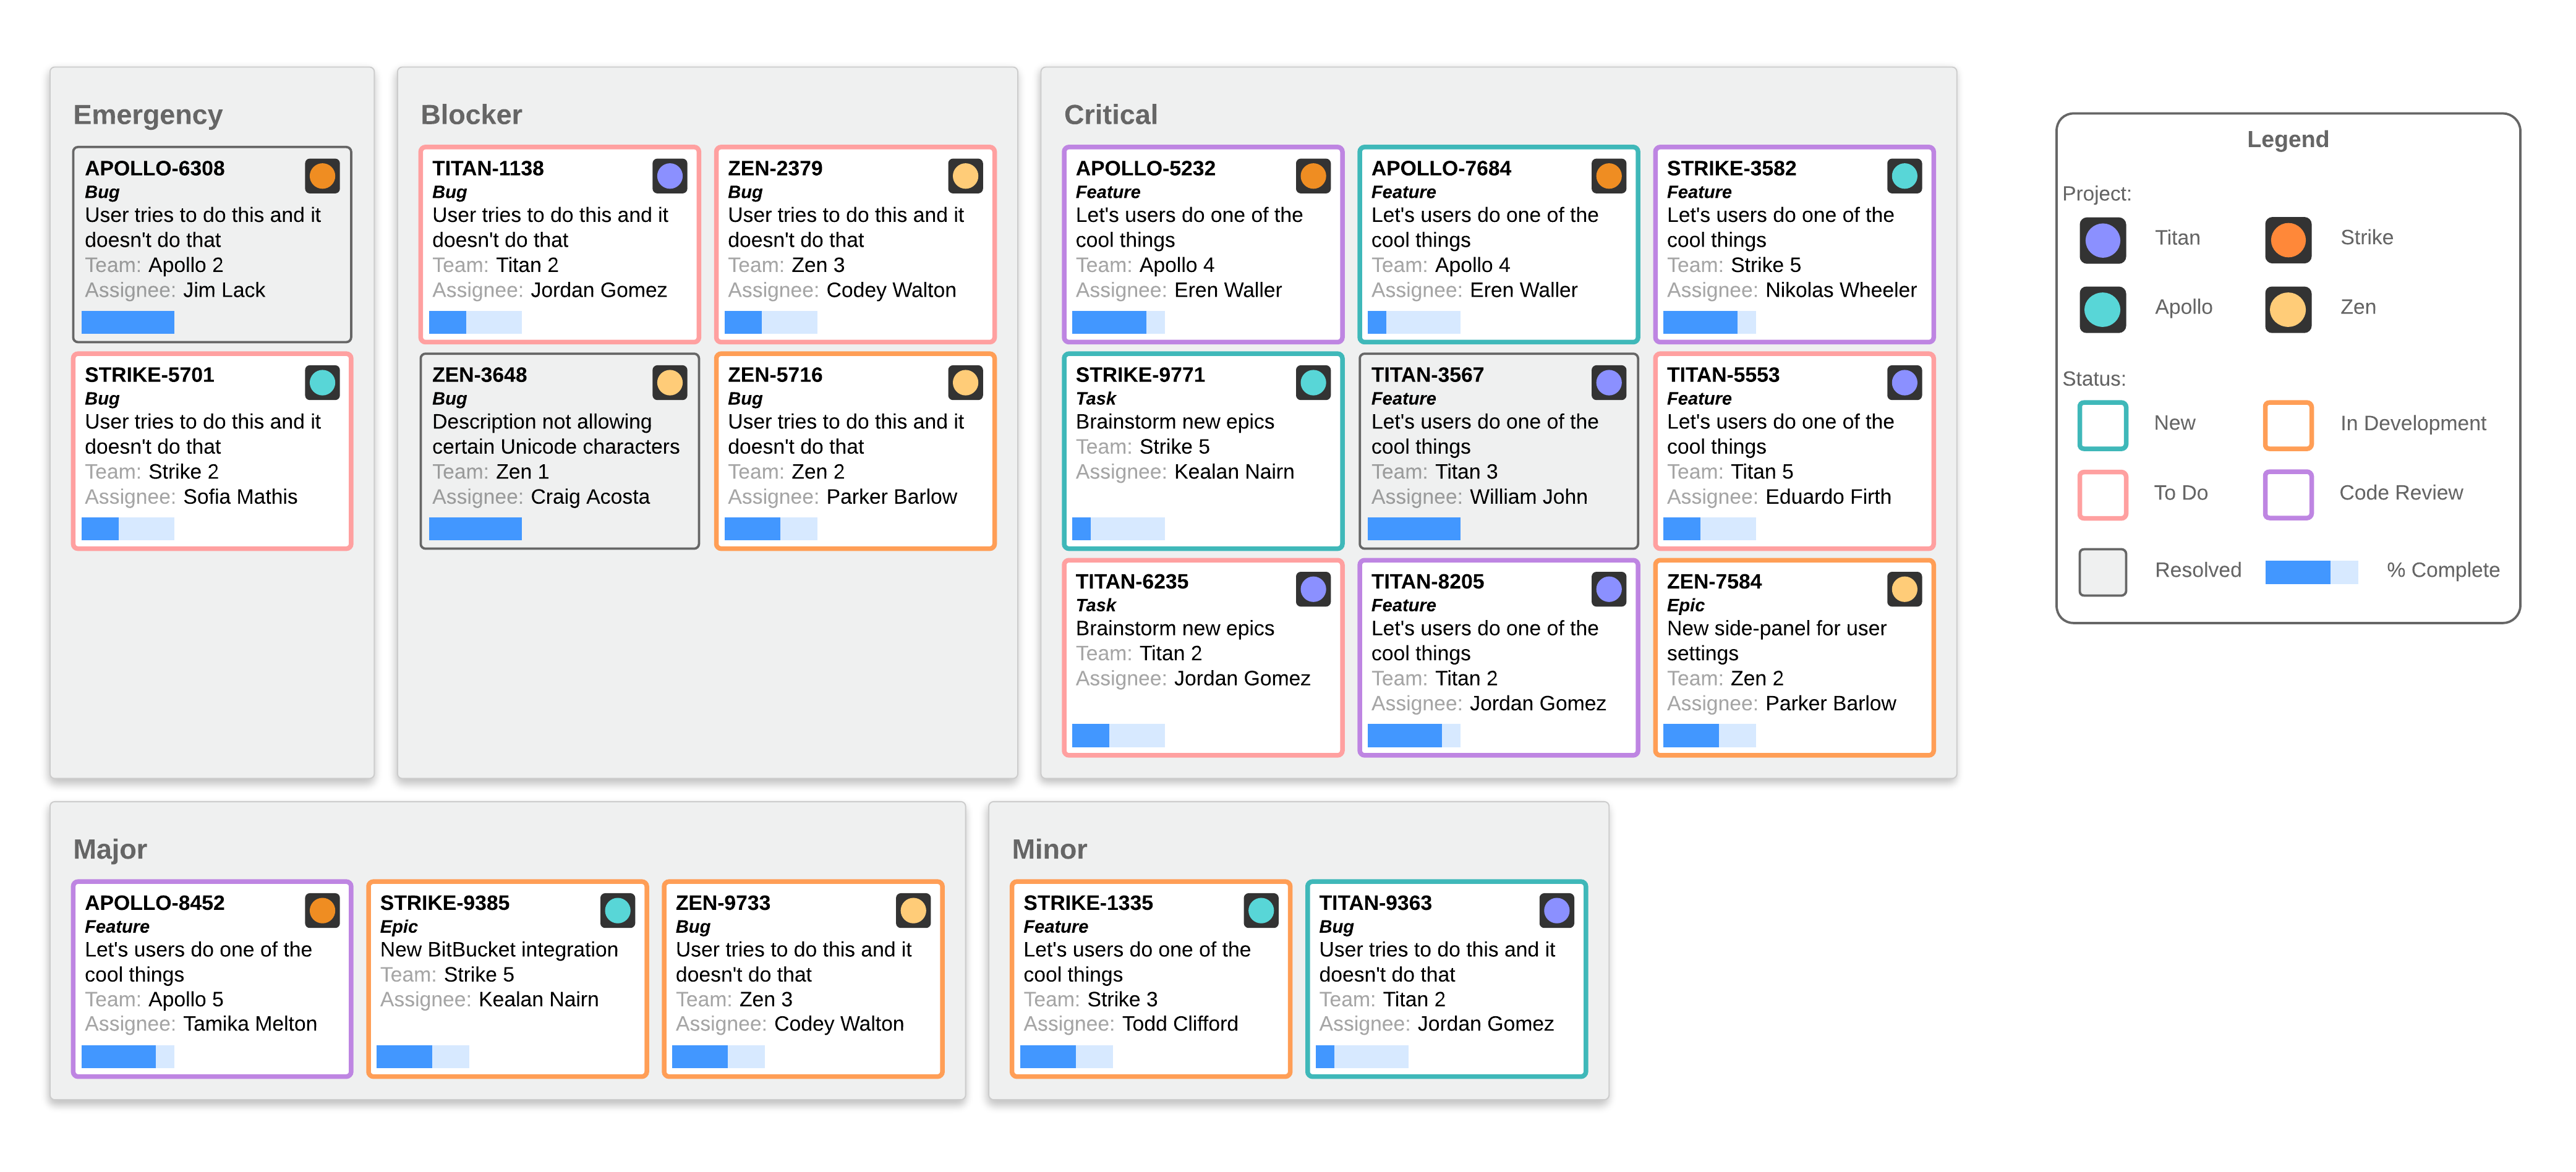
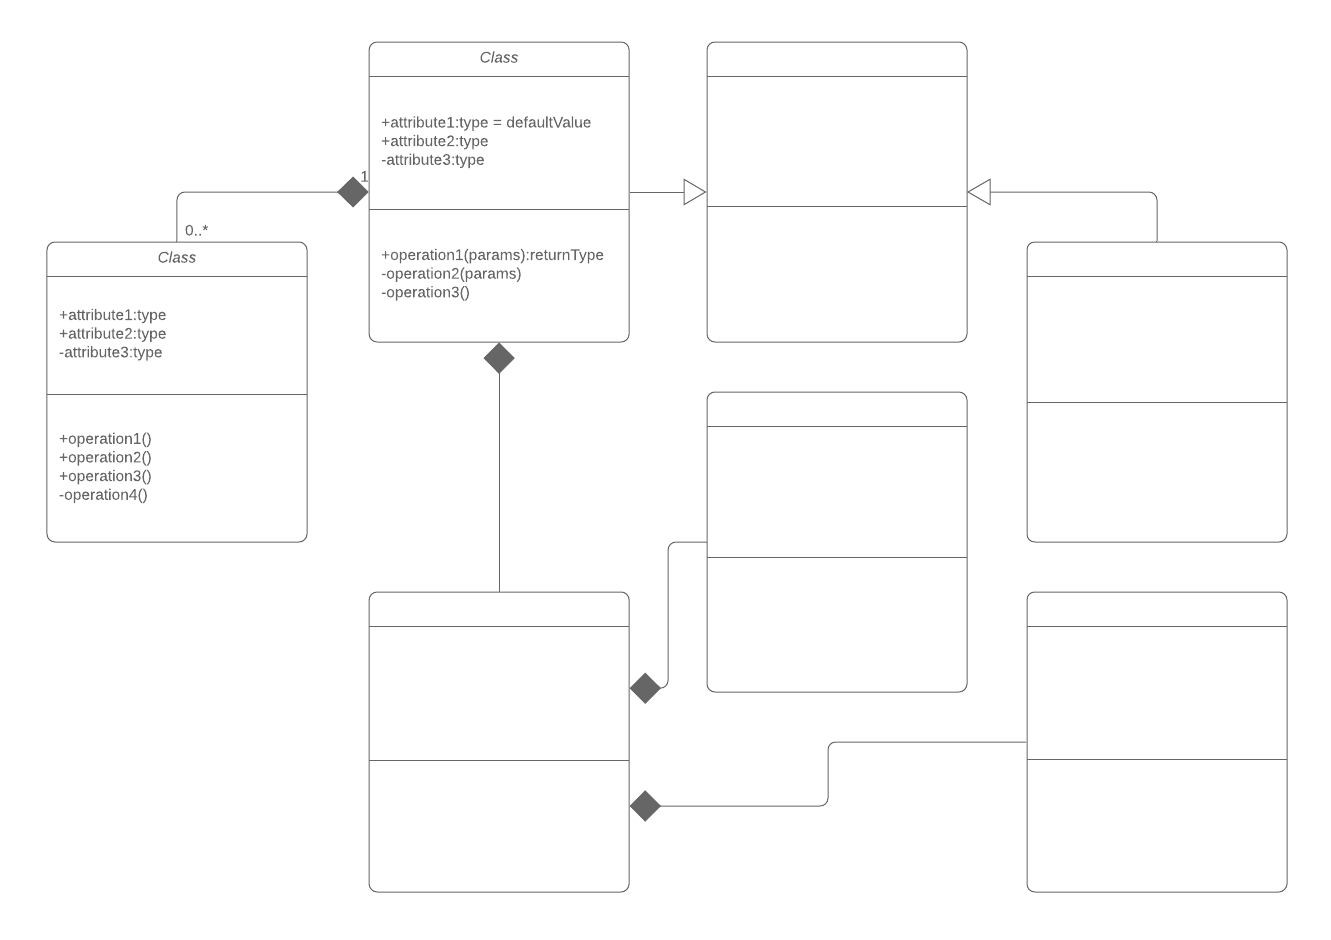
Users want a seamless, bug-free product, and they want it yesterday. With this much at stake, you need to be able to see what’s going on in your development process, coordinate between different development teams, tracks bugs and features, and enforce quality. Use our autolayout, importing capabilities, and integrations to stay on track.
People management
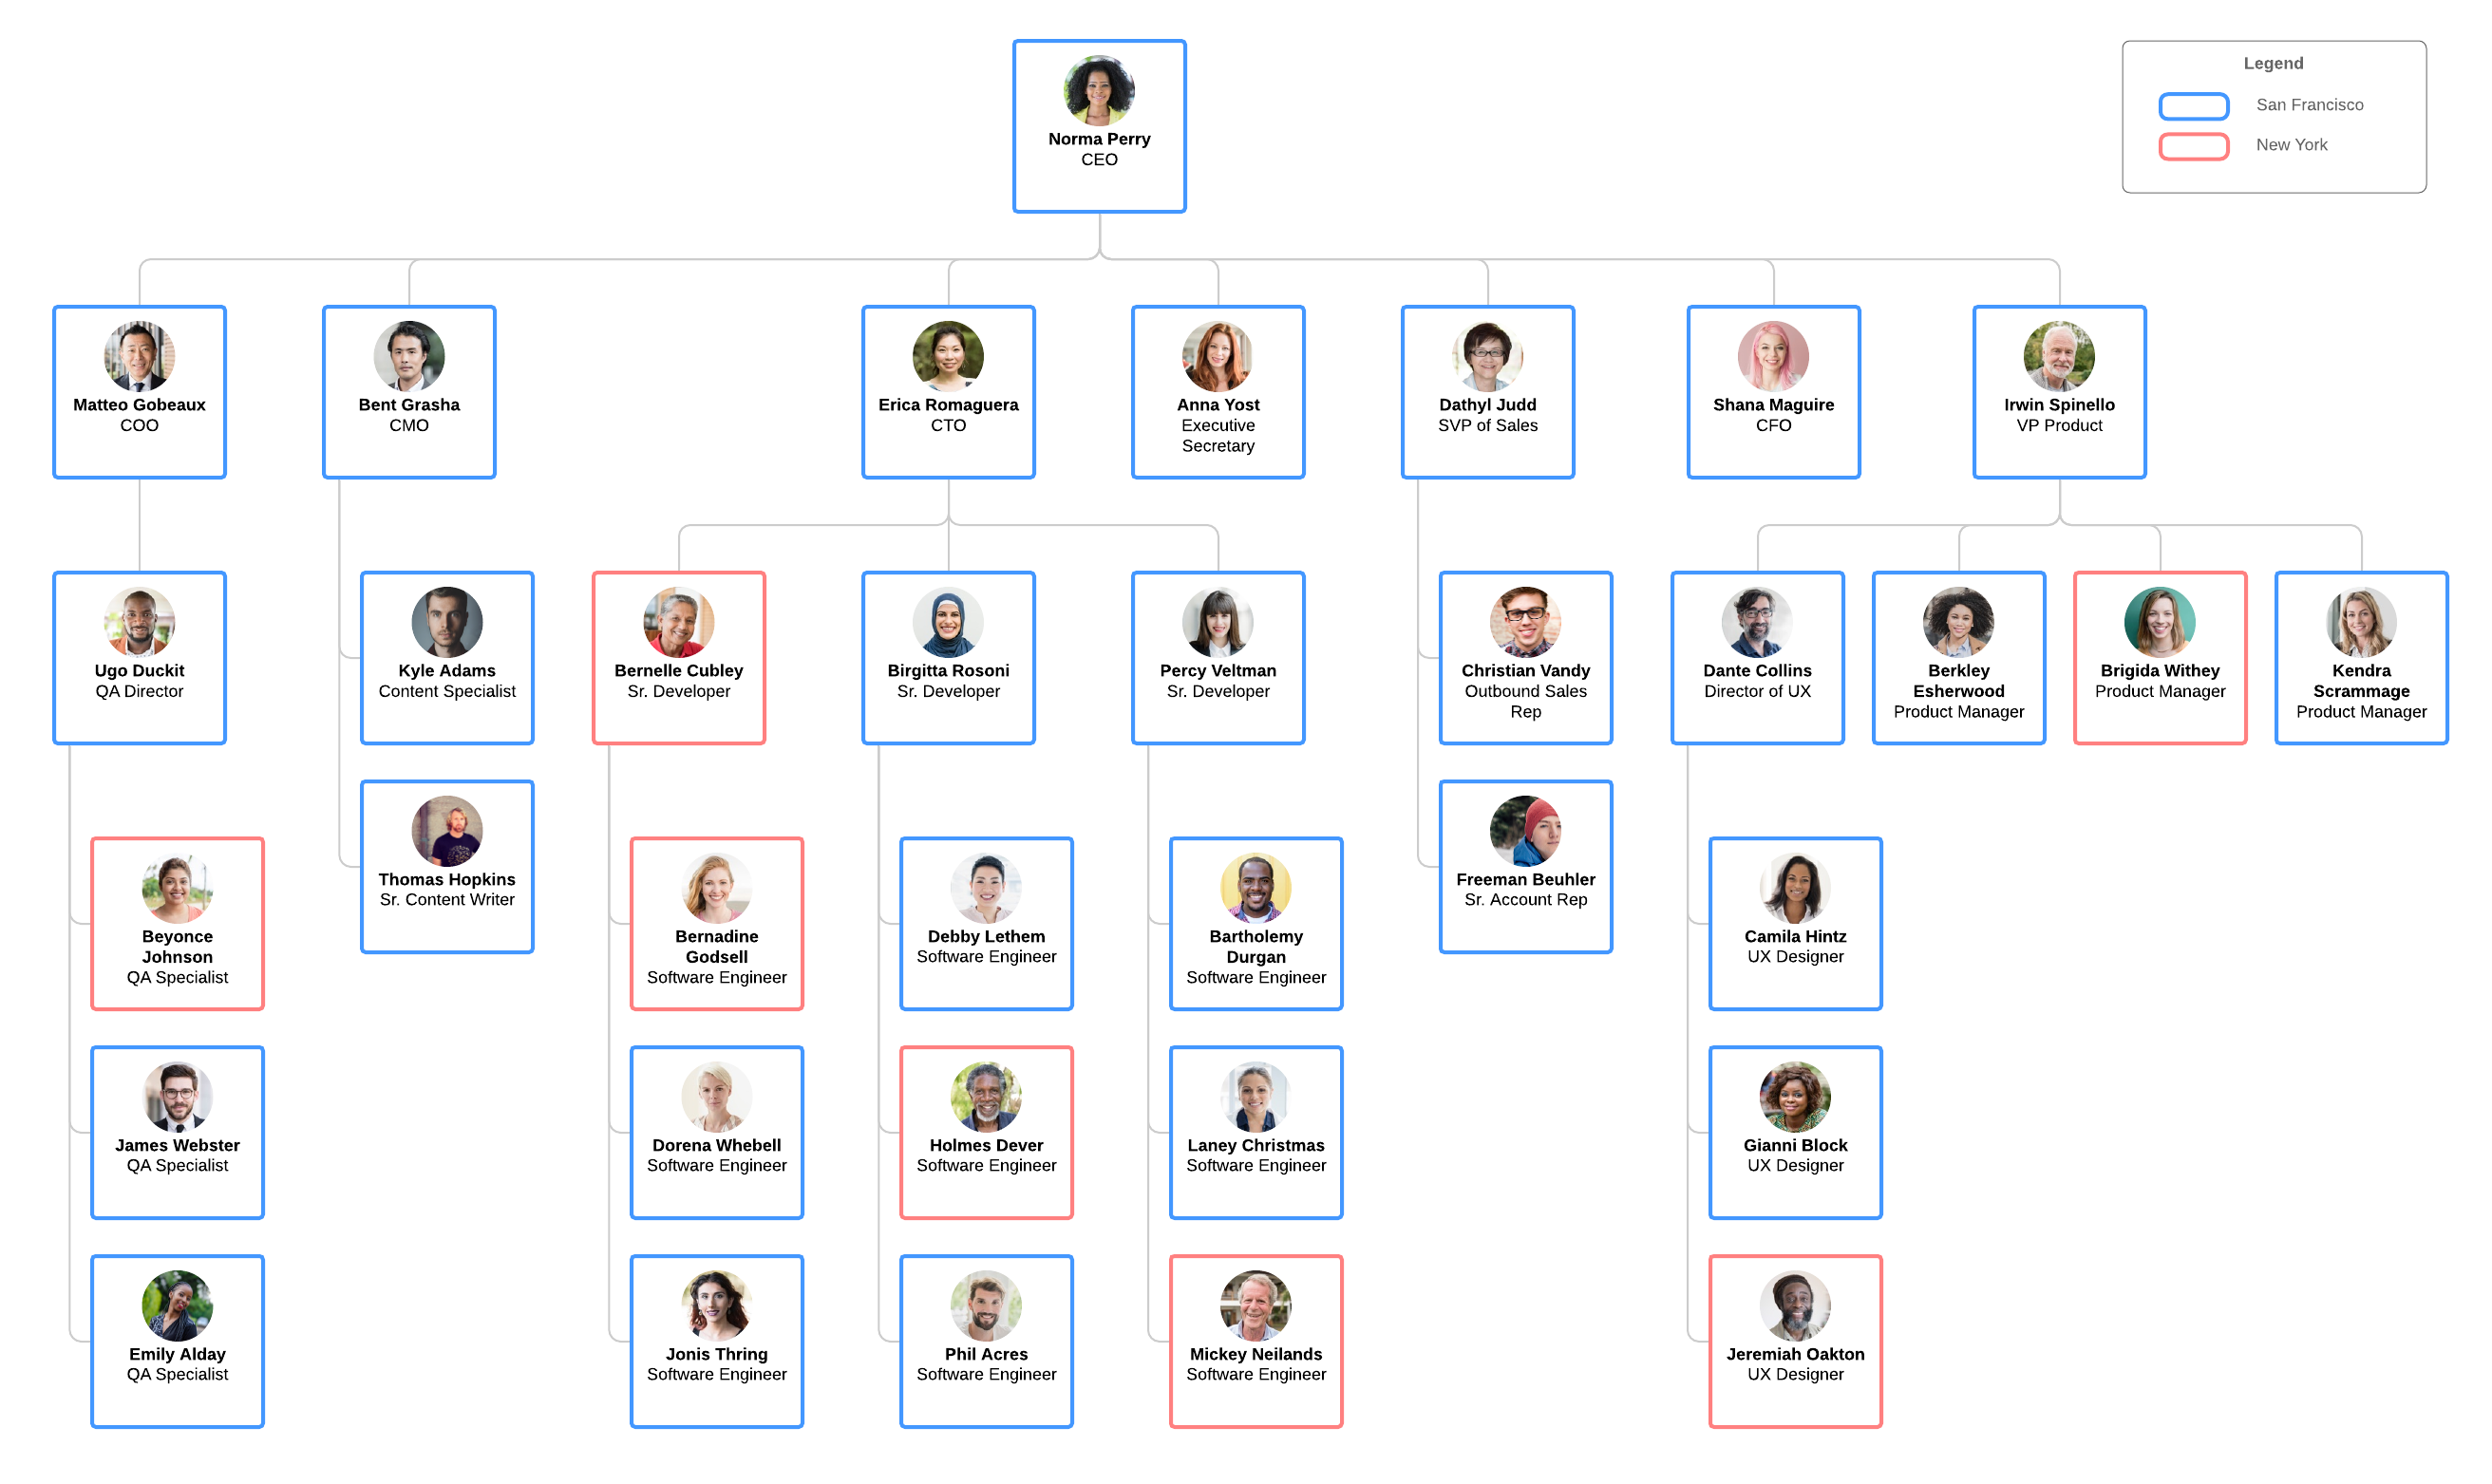
If you work in HR, operations, or management, part of your job revolves around keeping track of your people: who does what, who they do it for, where they work, how to contact them, and how they’re doing. Lucidchart’s org charts help you lay out all that information in one place, even allowing you to overlay different data sources and download changes you make in Lucidchart to a CSV.
Event planning
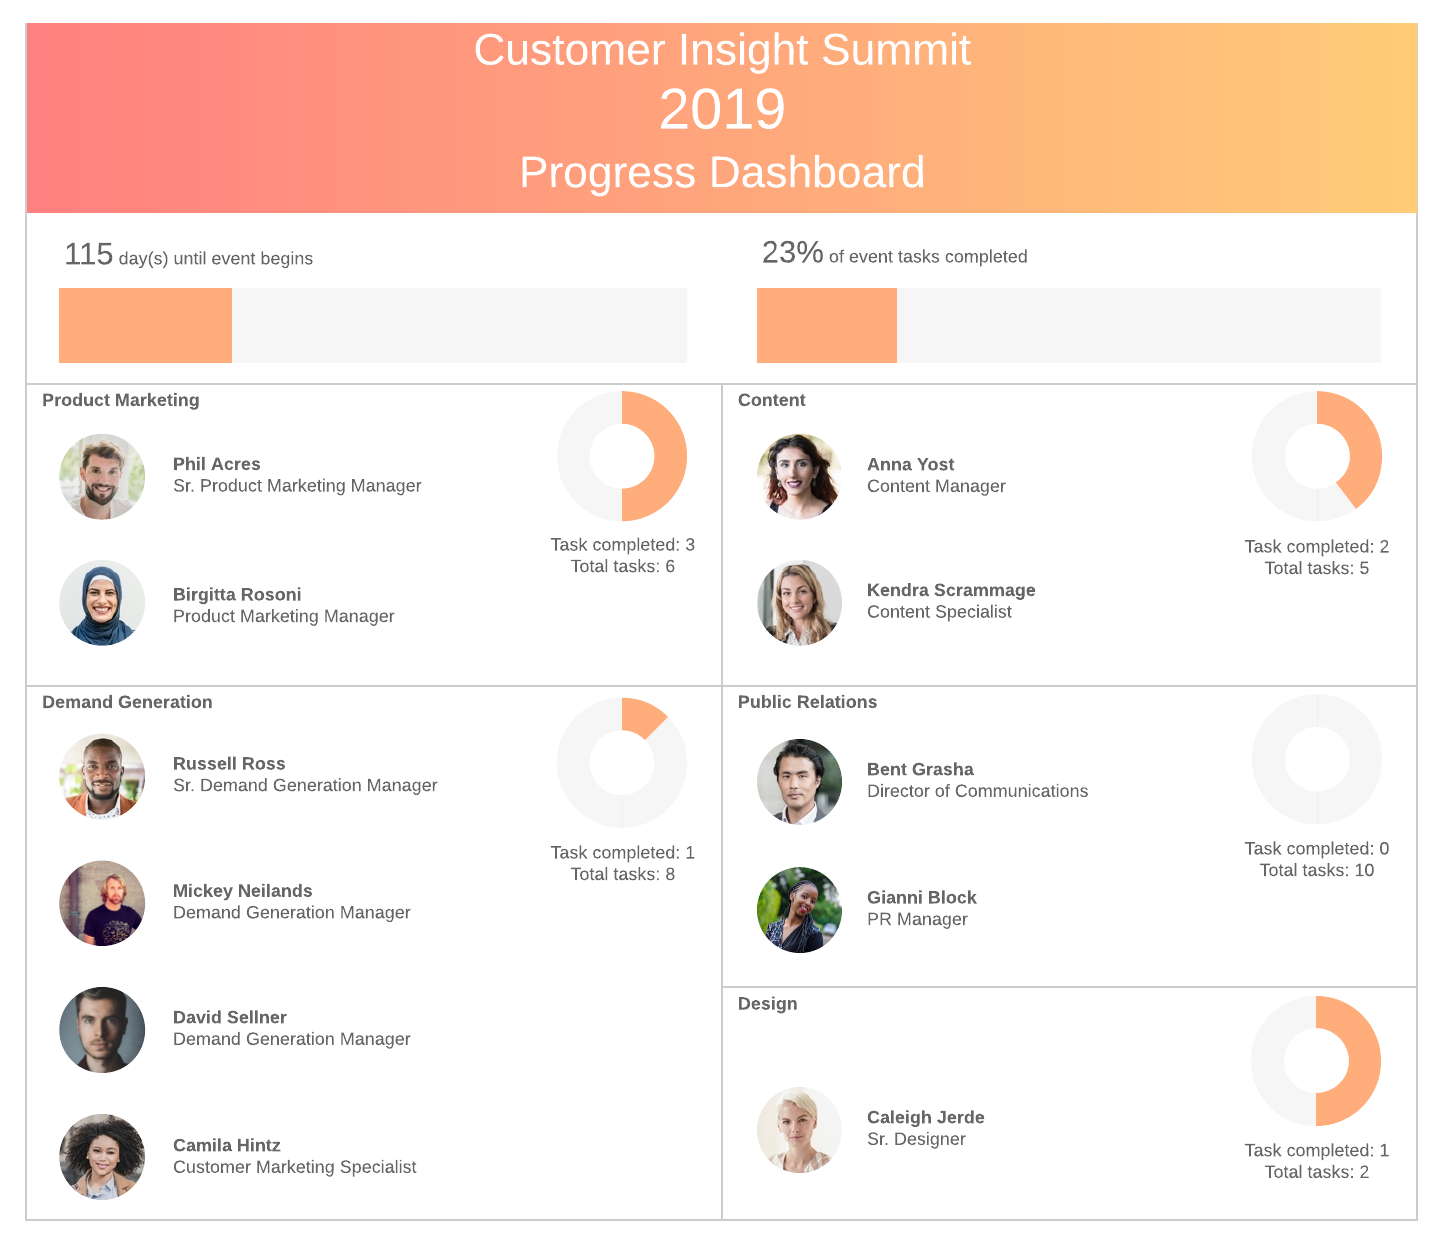
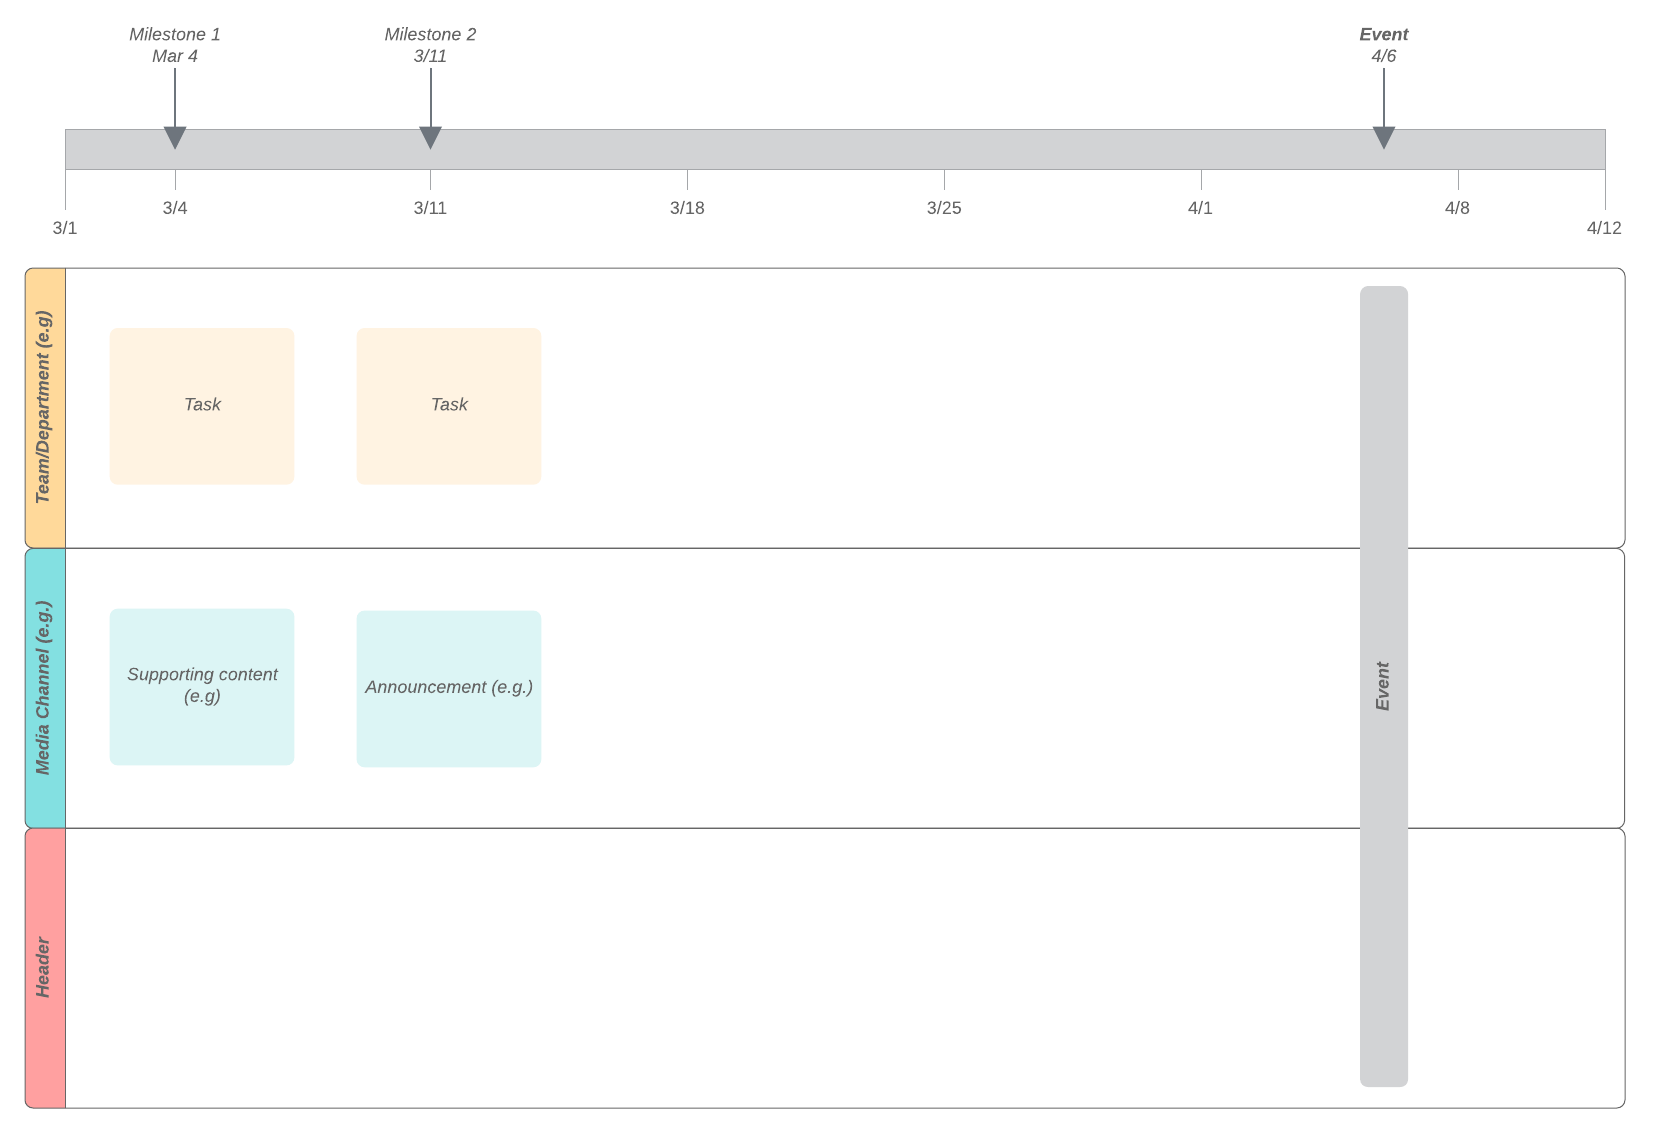
Anytime you plan an event, there’s always lots of preparation and coordination involved in making sure things go off without a hitch on the big day. Get all the different teams on board and track your project’s overall progress with our dashboards with dynamic shapes.
Space planning and management
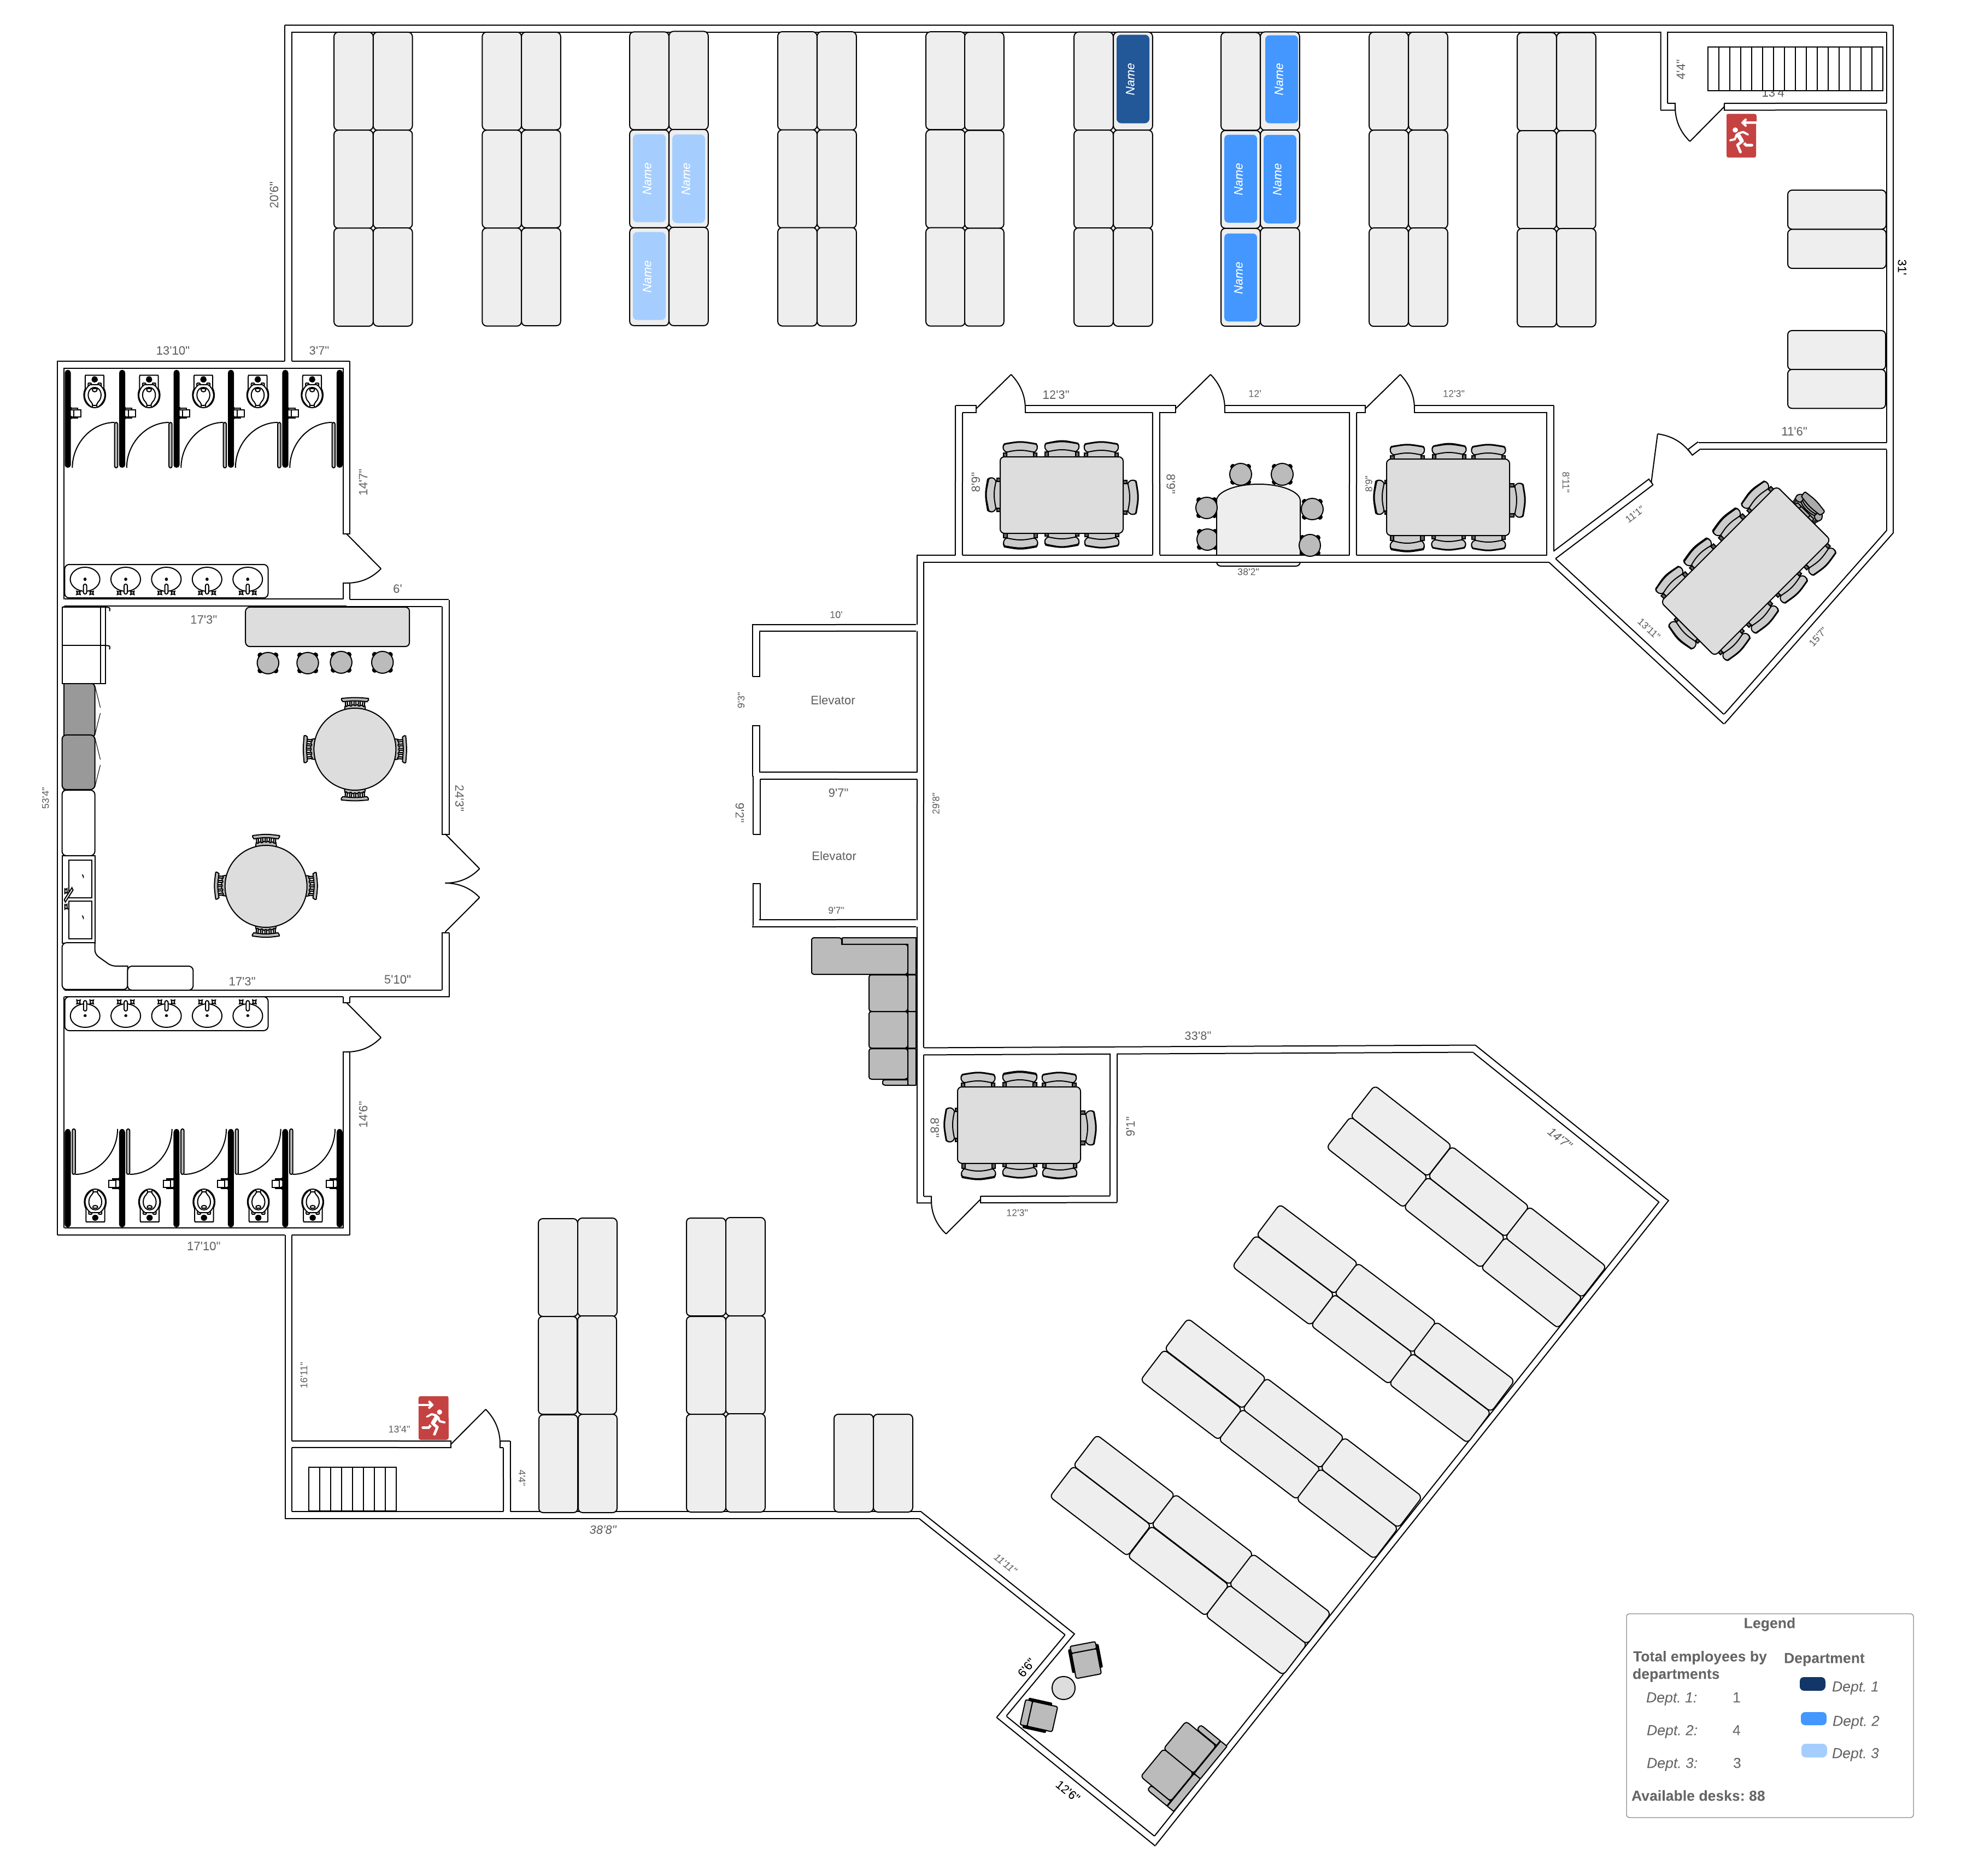
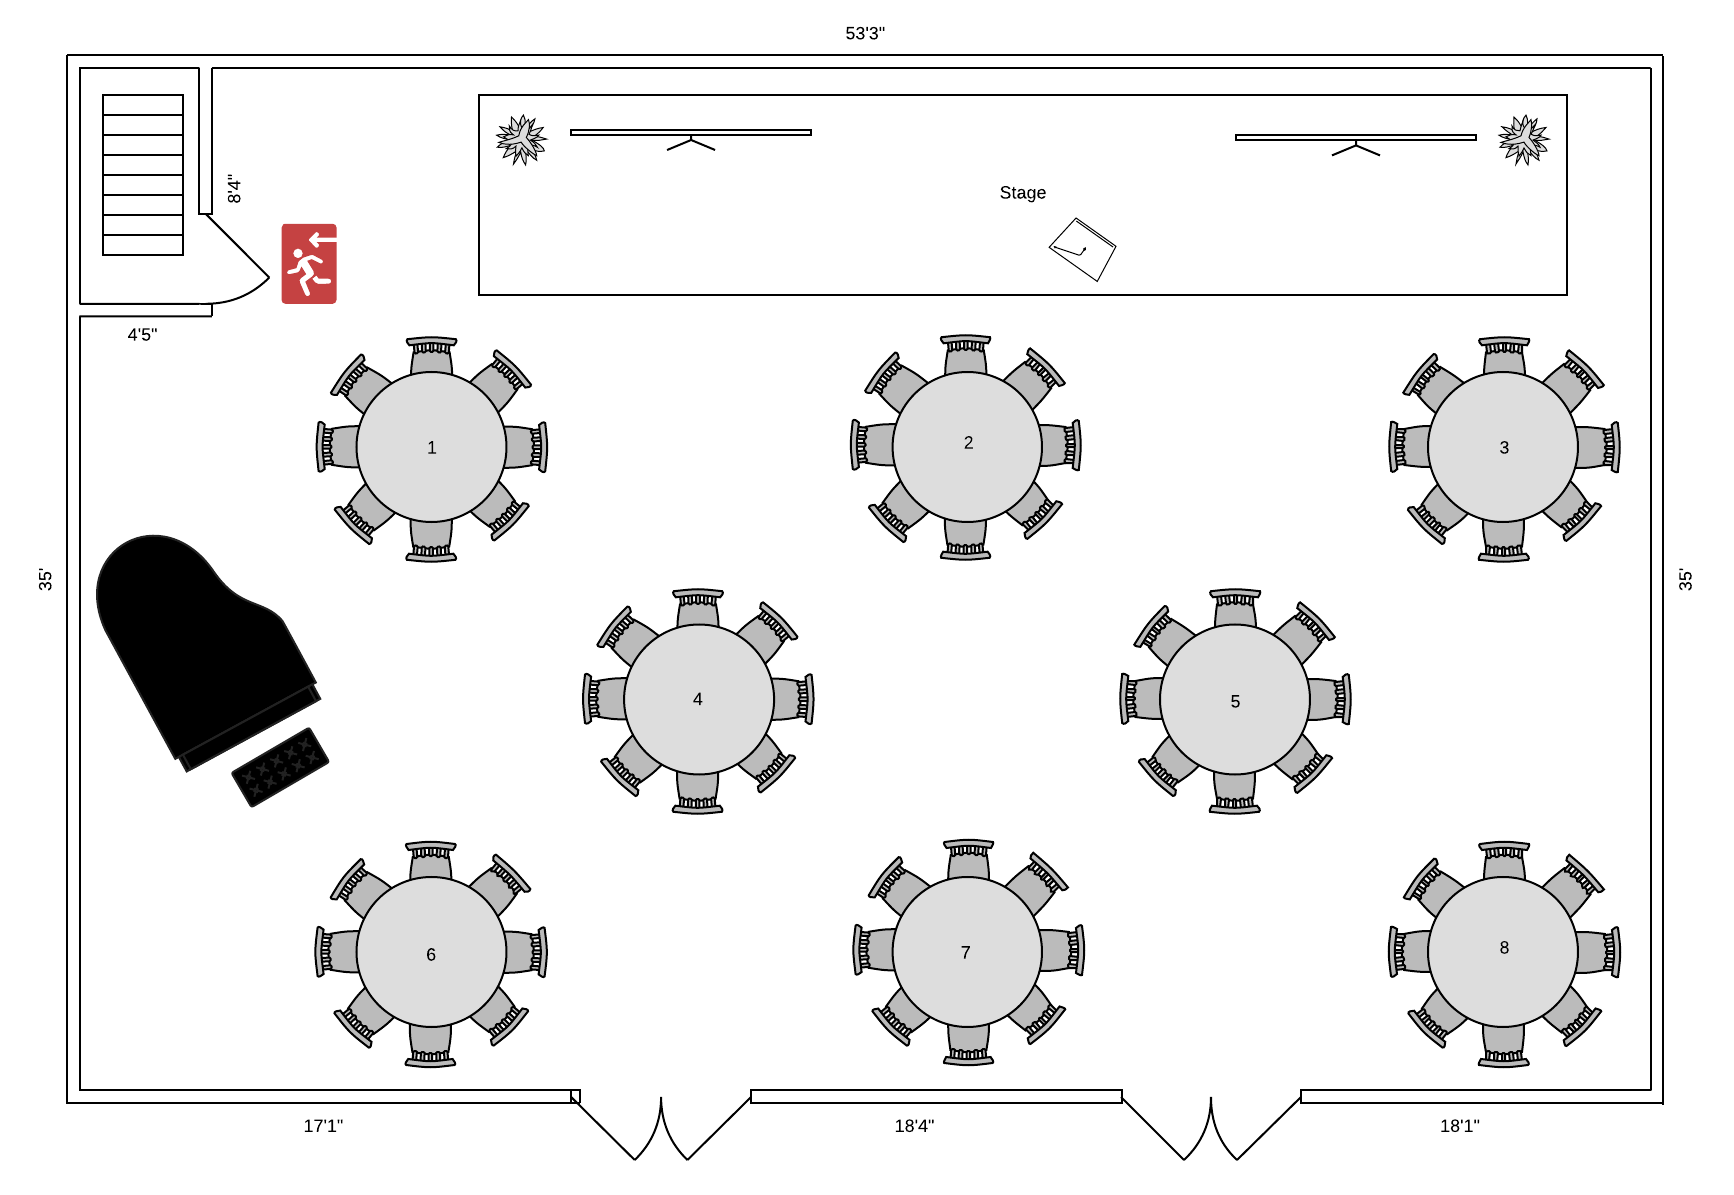
Organizing a space is also key in managing people and planning events. Our floor plan templates and shape libraries can help you visualize your space and avoid awkward surprises, like not having enough chairs for your attendees or ordering the wrong sized furniture for your new offices. These floor plans help you iron out details ahead of time.
Customer profiling and analysis
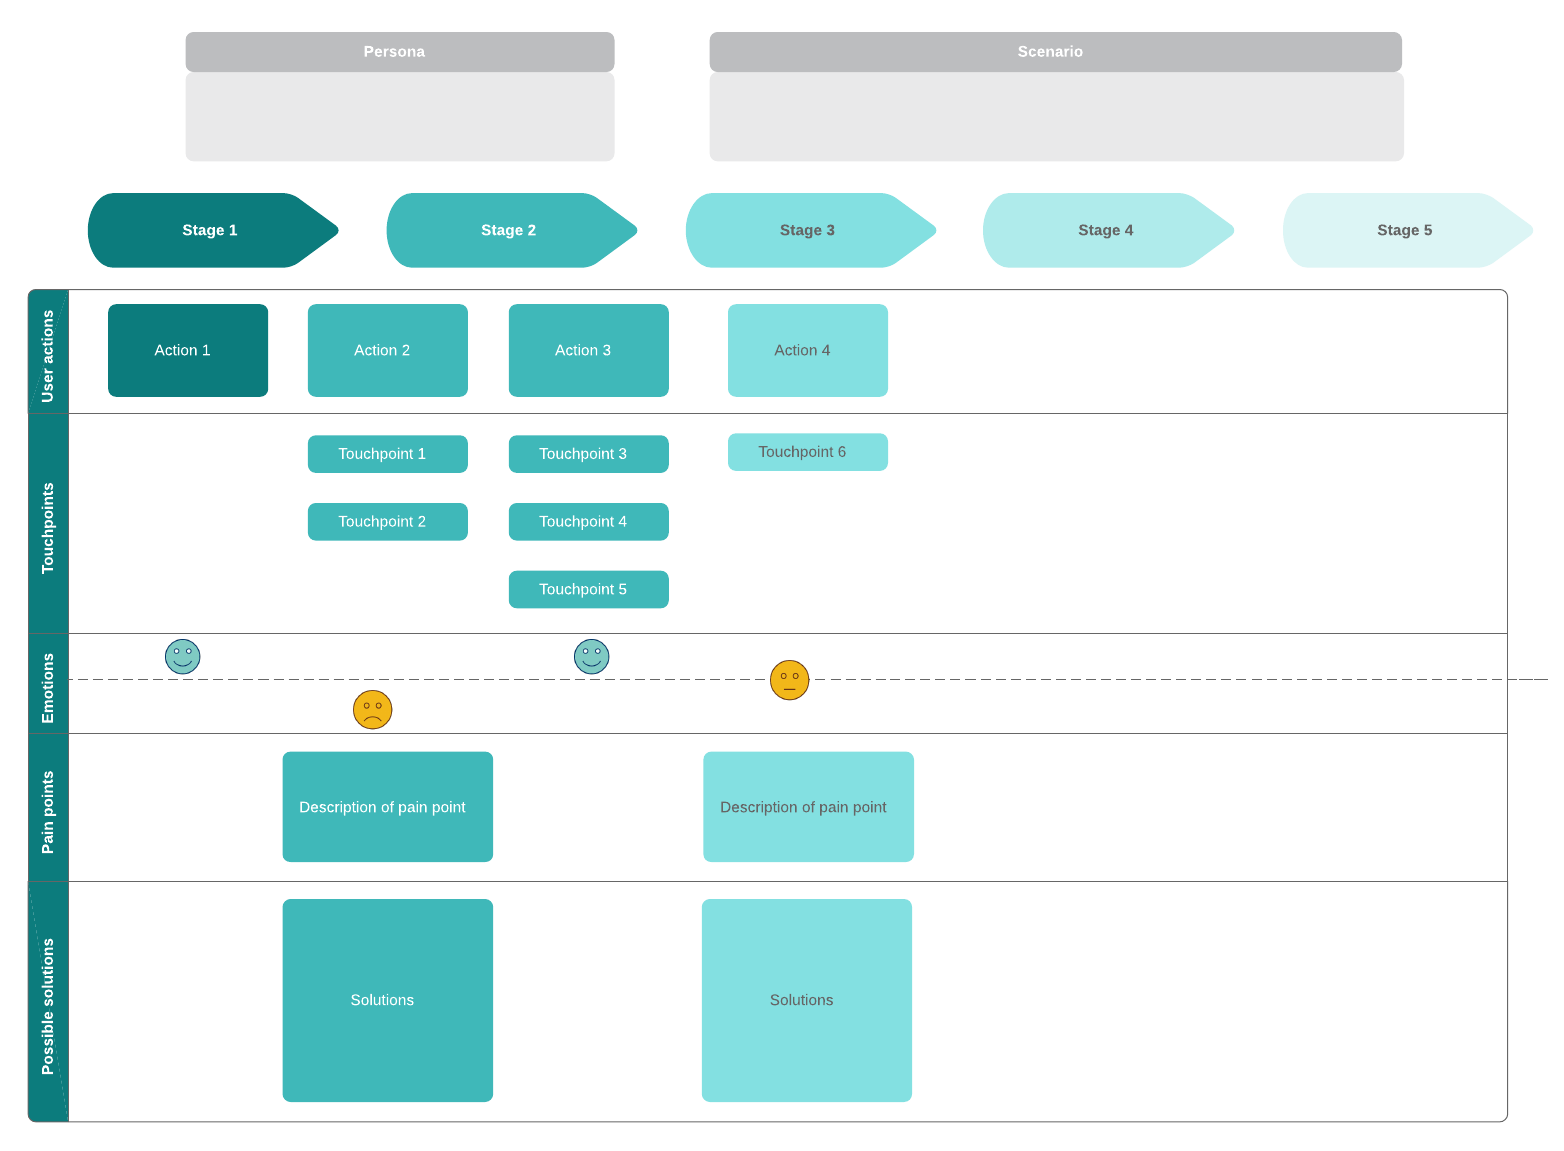
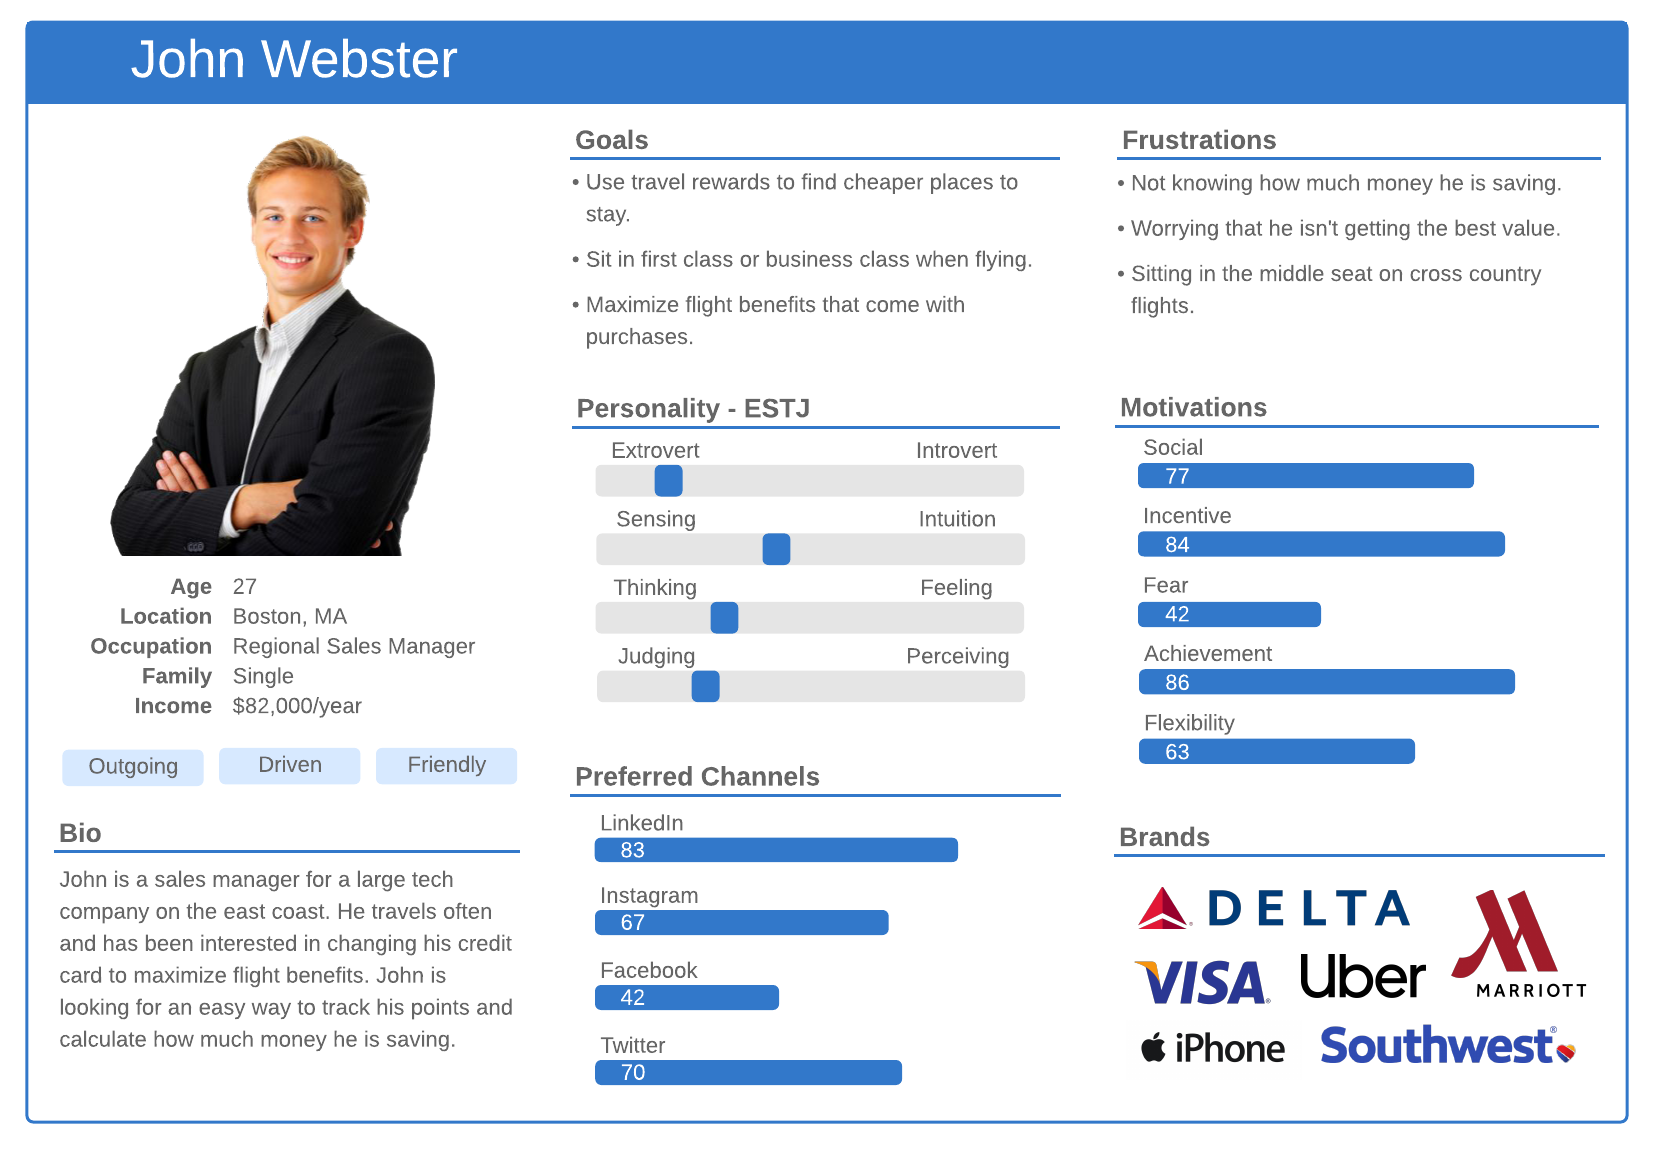
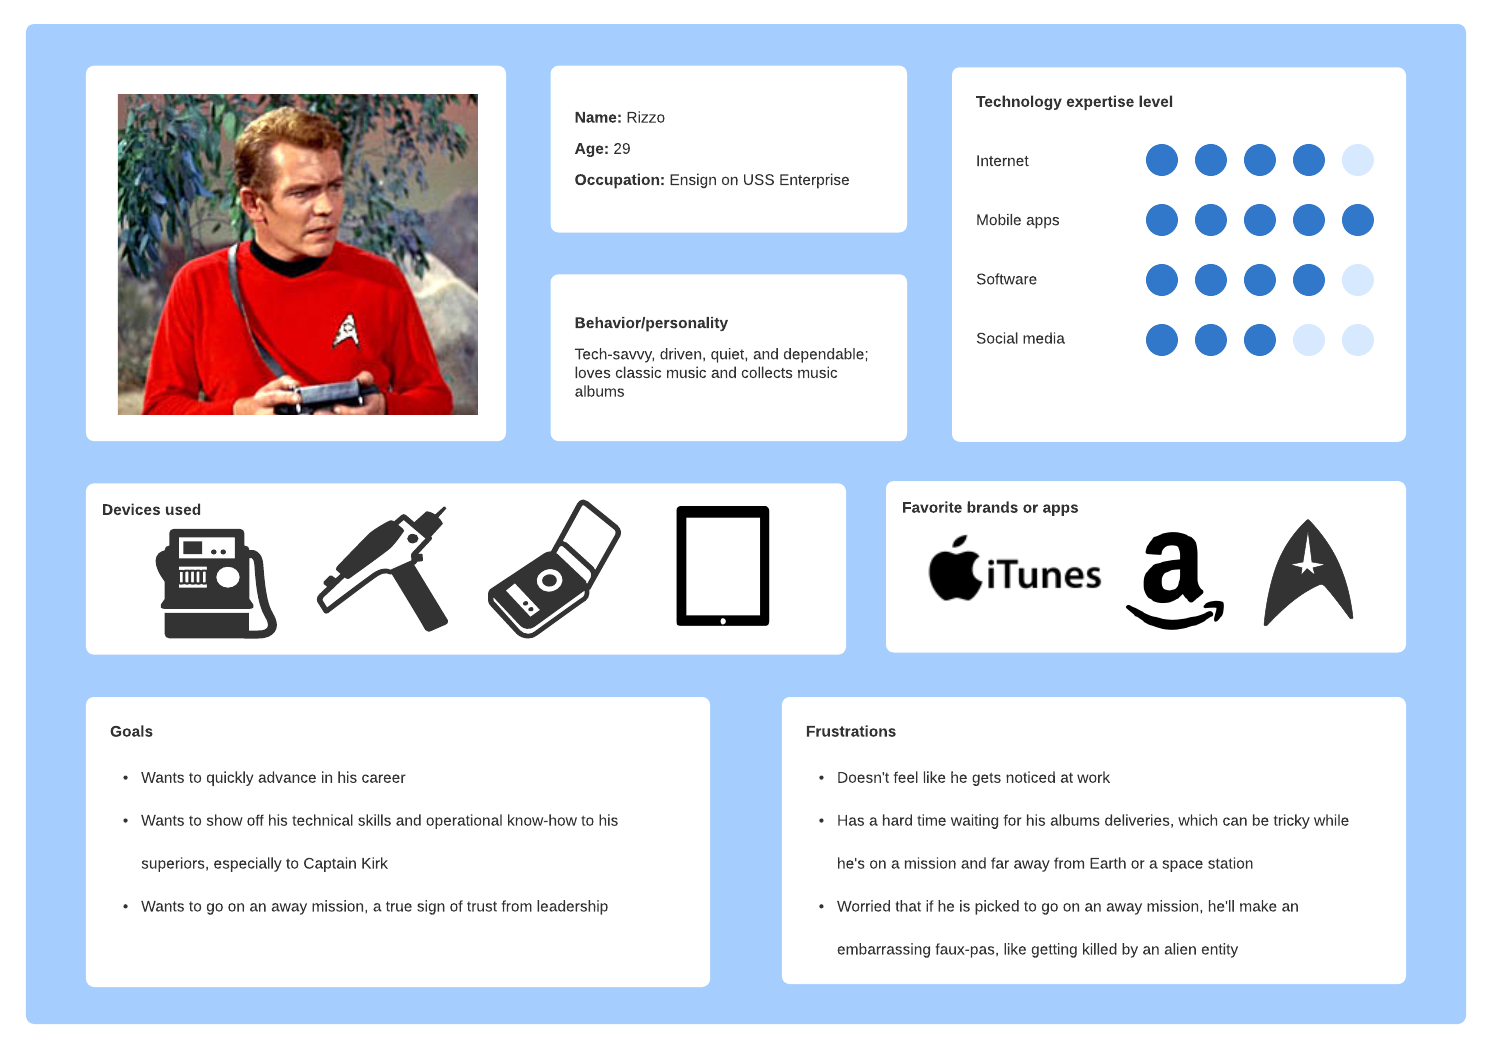
Understanding who your customers are and how they use your products and services is crucial to growing your business. It doesn’t matter how well you think you’re doing if that’s not what customers are experiencing. Similarly, you can’t successfully appeal to them without seeing them in context. Organize your research and distill more insight using customer journey maps and user persona cards so you can be more empathetic and responsive.
Sales and customer relationship management
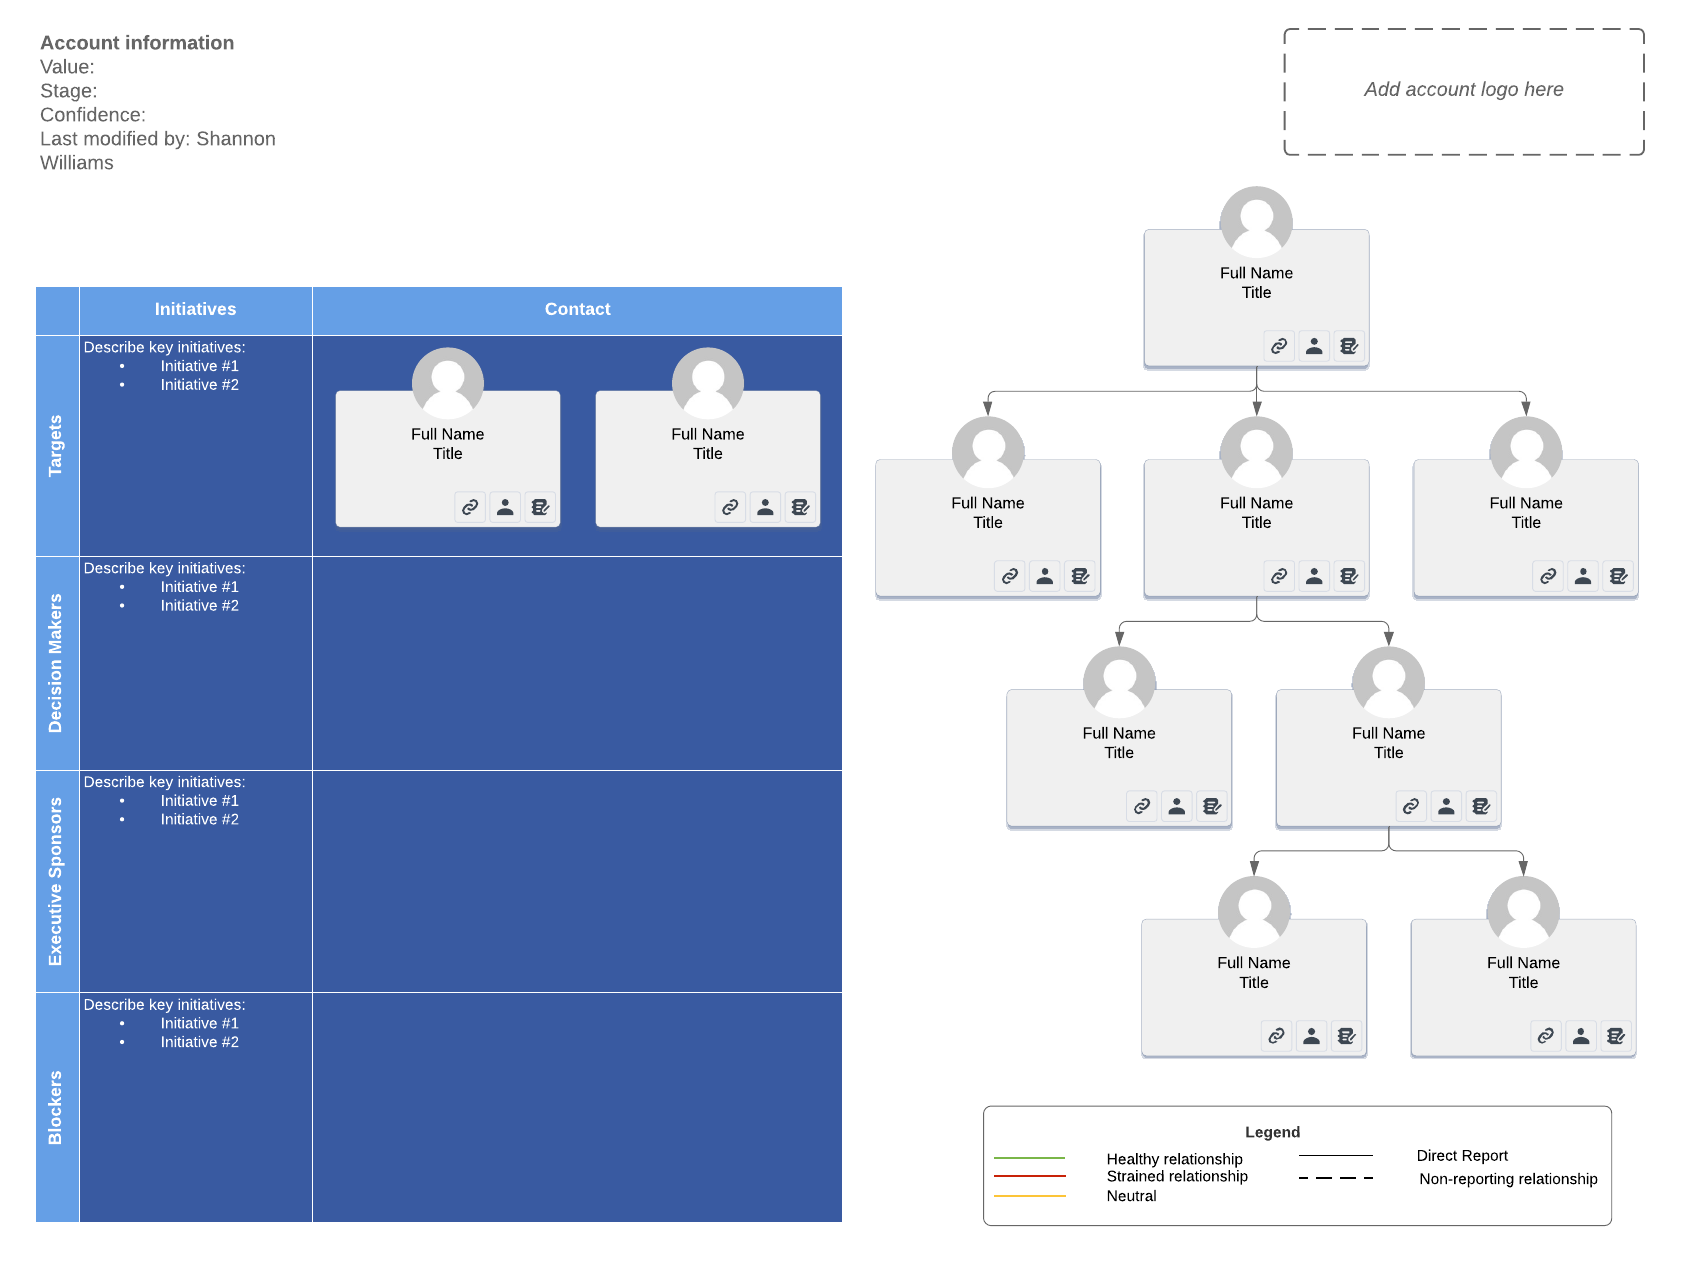
Raise your selling game with our templates designed in partnership with Winning By Design, a cutting-edge sales consultant agency, or one of our templates designed to cover other top sales methodologies like MEDDIC.
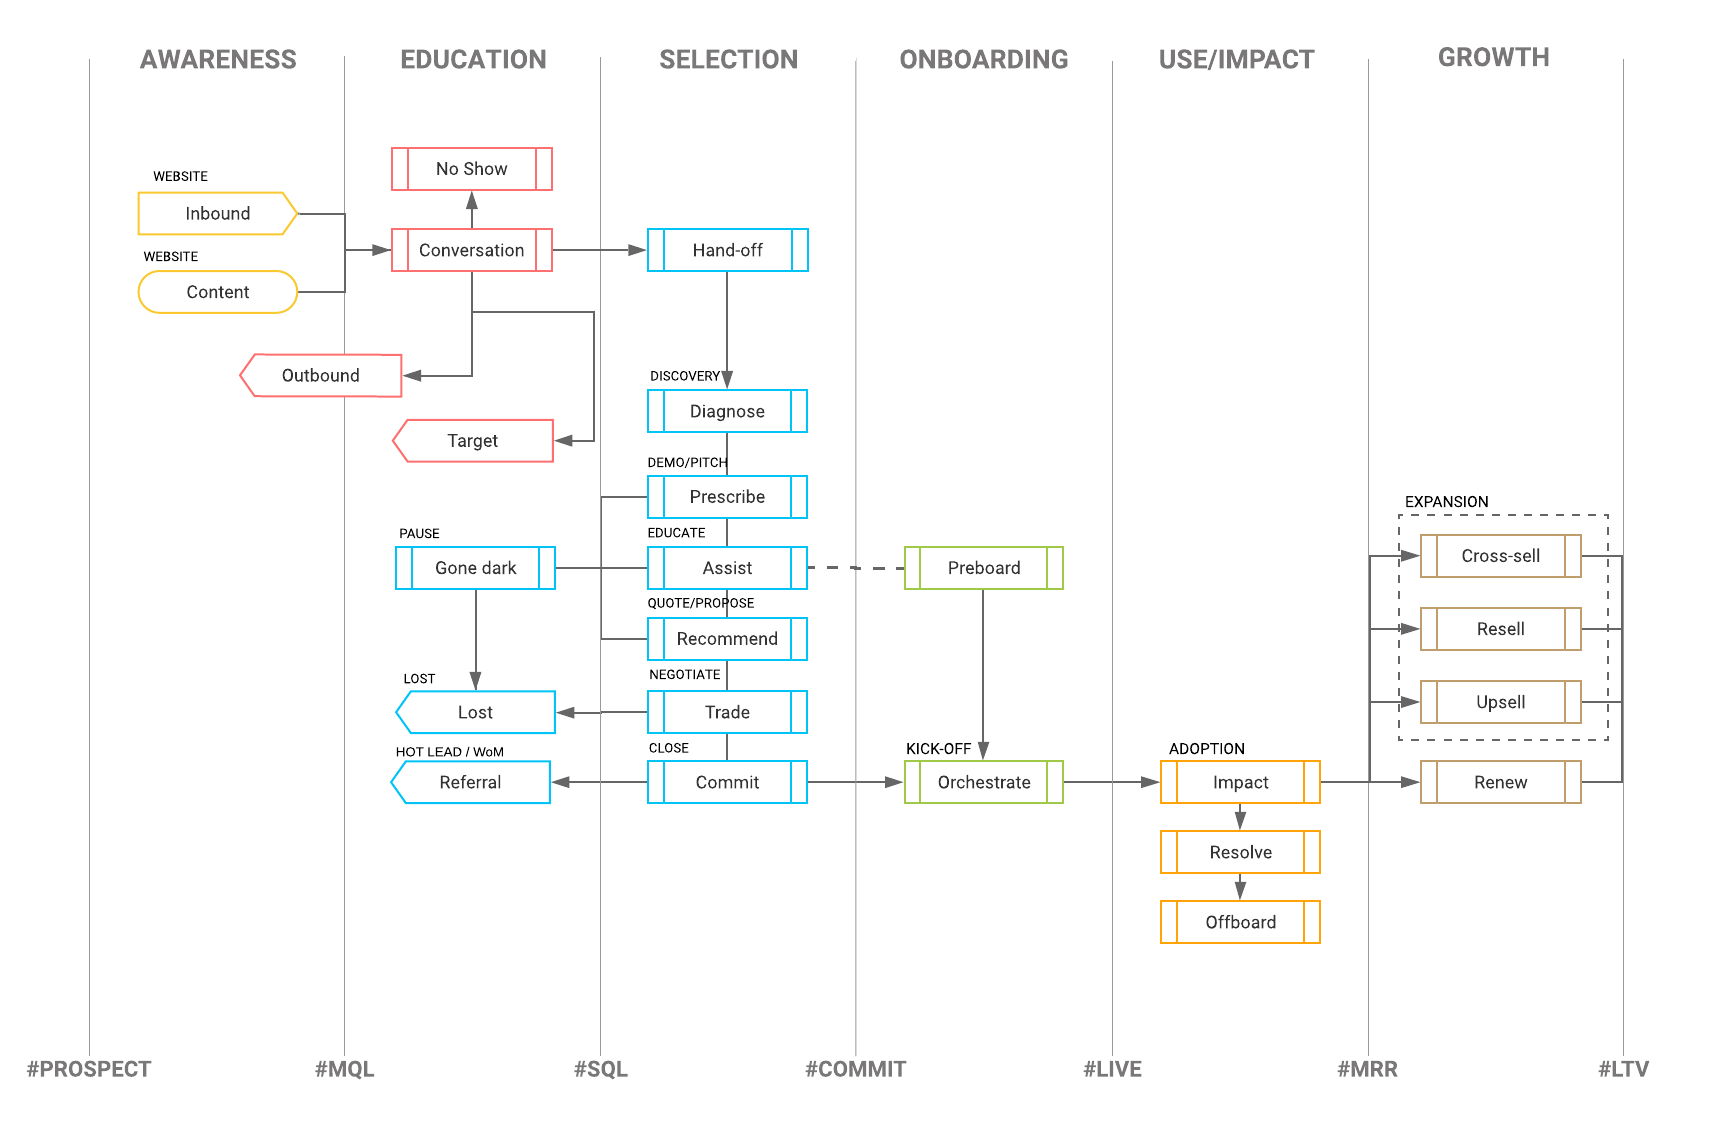
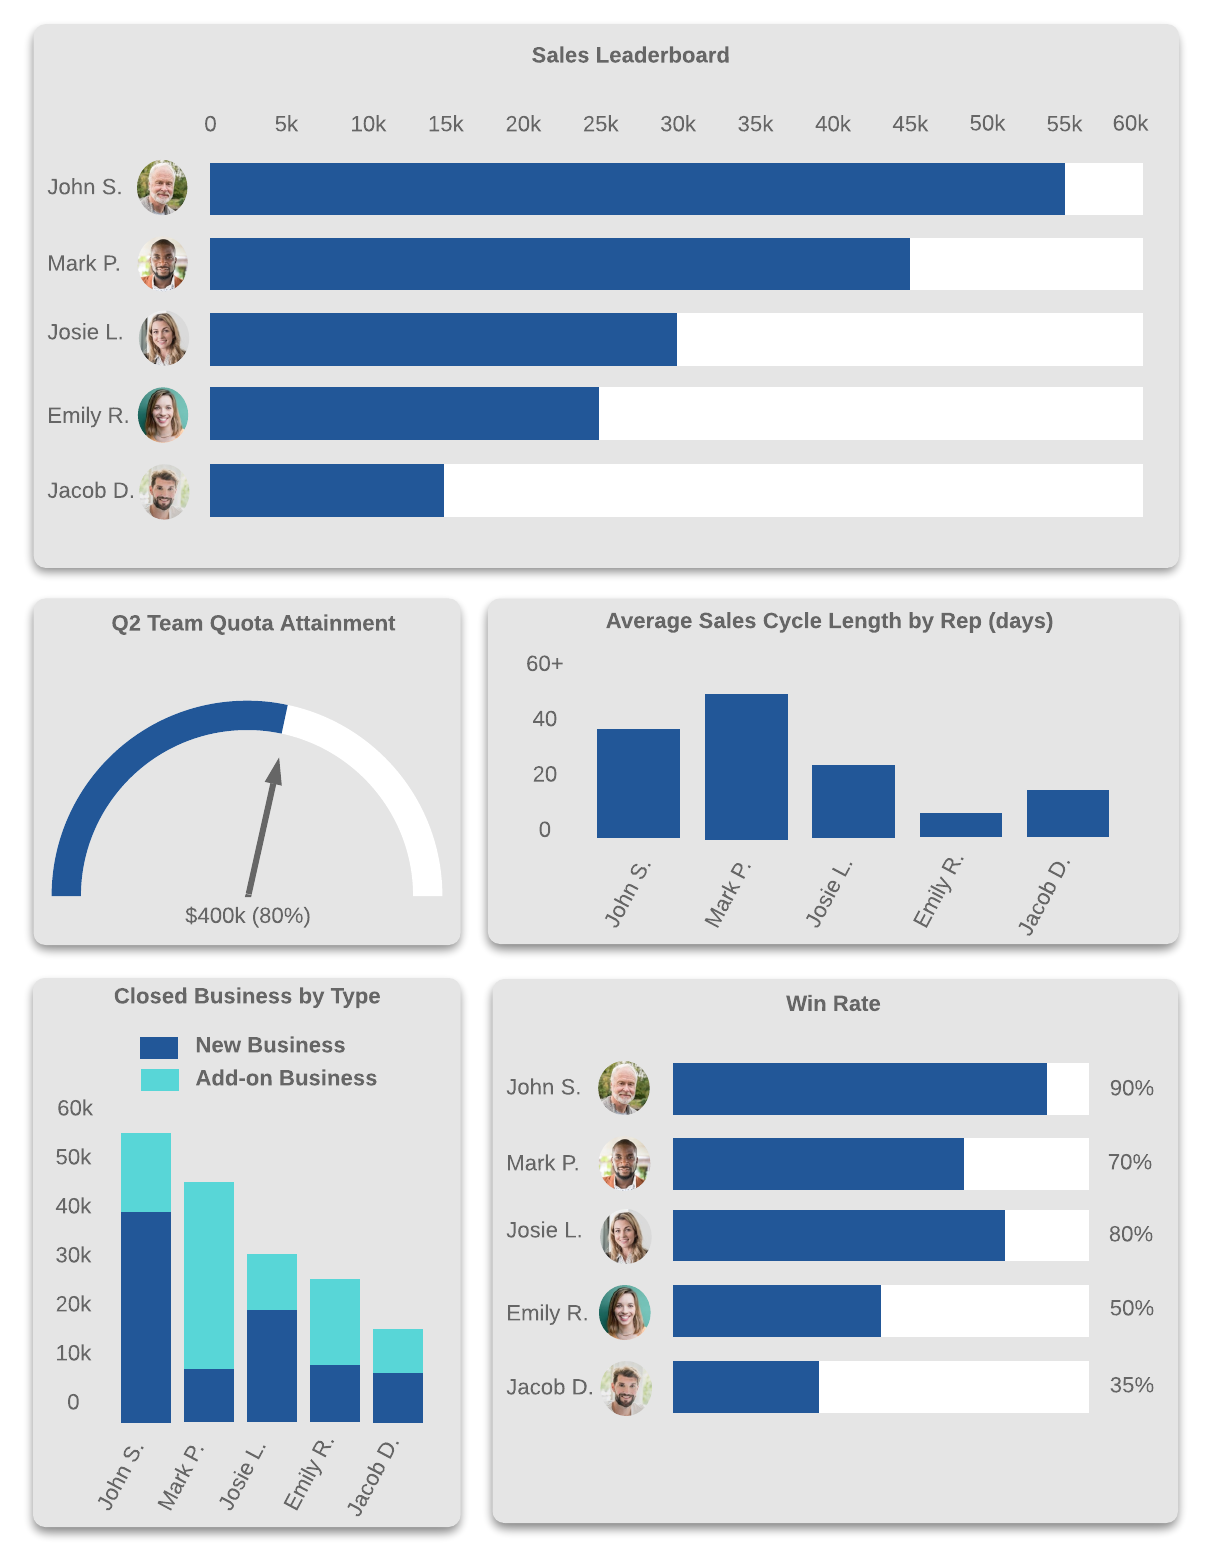
Our sales templates also clarify the best path to sale so you can speed up your sales cycle. Get more insight into your CRM and sales activities with our account maps and dashboards.
Project management
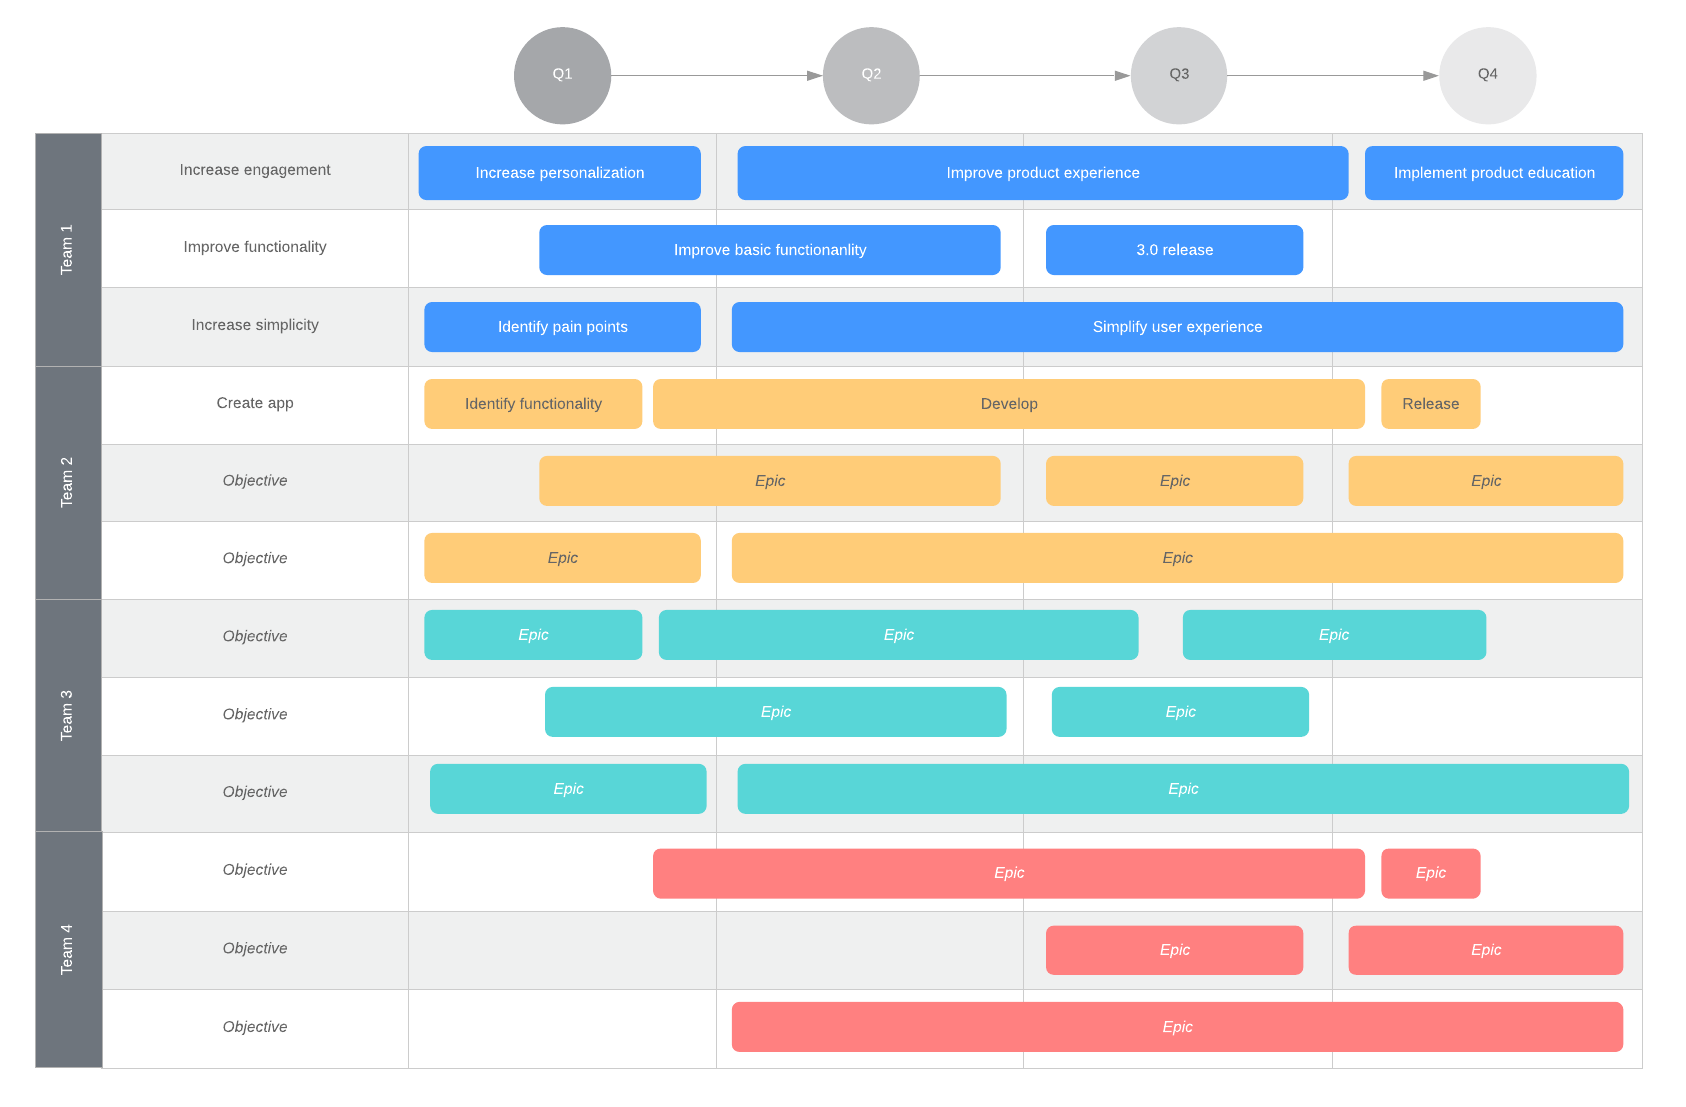
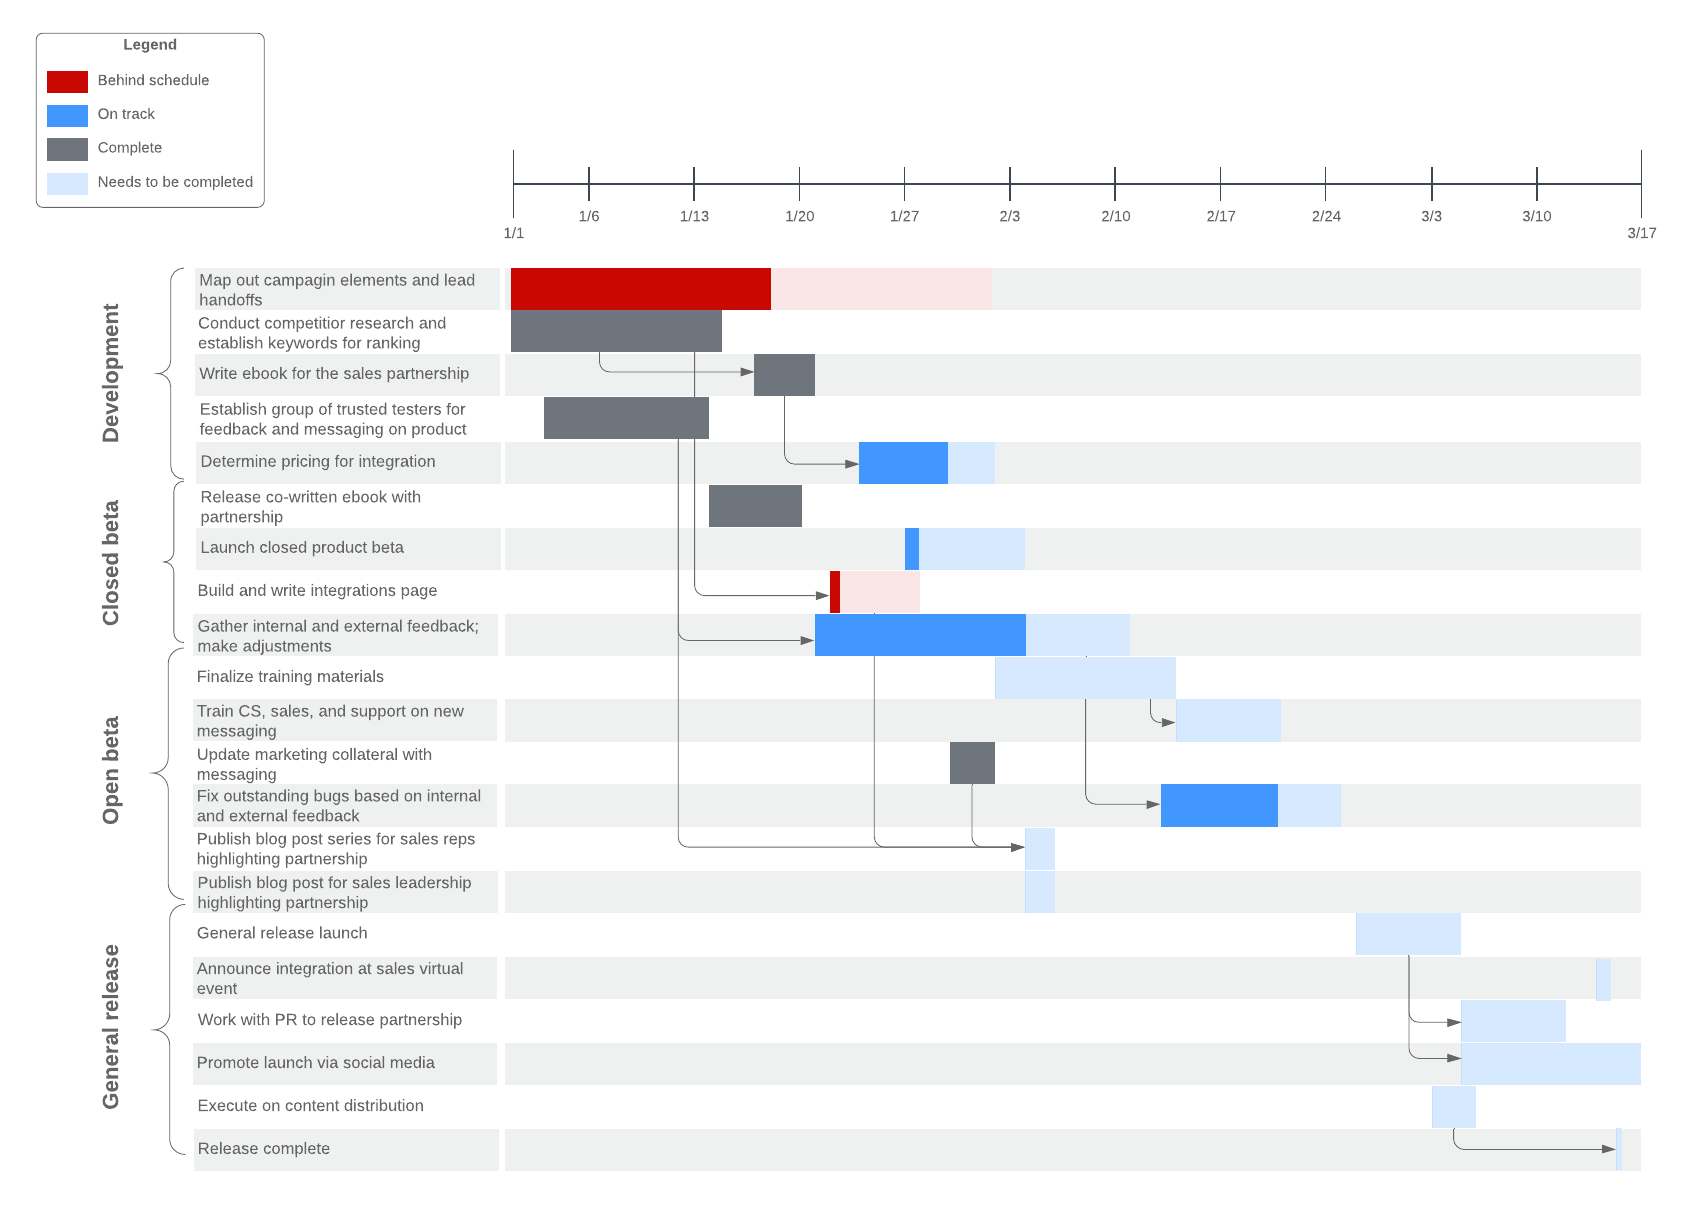
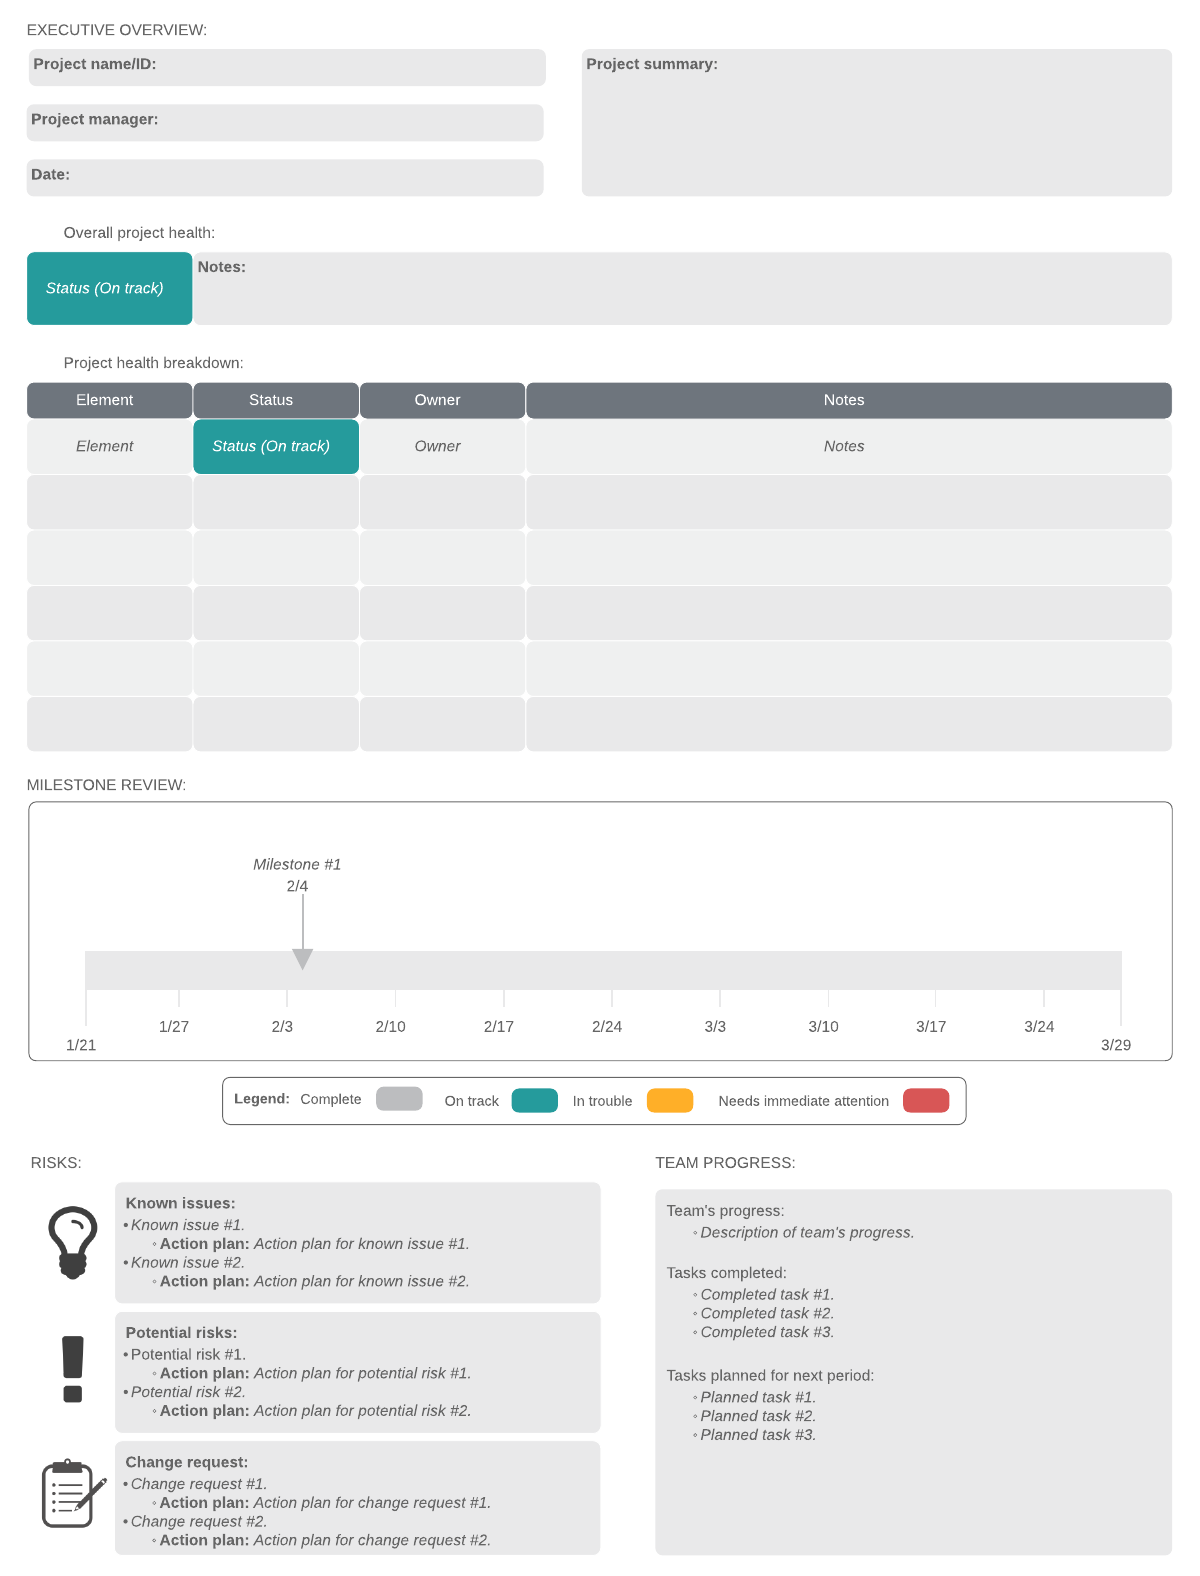
To keep projects from going off the rails, you need to collaborate with all the relevant teams and stakeholders, control the project’s scope and budget, and stick to your deadlines. All these elements depend on a well-organized approach to project management. Our templates help you do just that. Try one of our roadmaps, Gantt charts, or reports to make your project planning and execution go more smoothly.
How to make Lucidchart templates your own
Here are a few tips for making the most of our templates. For more detailed instructions, watch our tips and tricks video.
- Change the default shape formatting: Our templates tend to have the most commonly used shape as the default formatting for all shapes. If you need a different font, color, or outline style for most shapes, get one shape just the way you want it, right-click, and then select “Set Default Style.”
- Select all shapes, lines, or everything on the canvas: Need to make a global change but don’t want to spend forever selecting each individual shape or line? Go to “Select” in the menu bar to select what you want.
- Match a specific color: Have a specific color that you want to match? As long as it’s on the canvas, you can copy any color and apply it to shapes, lines, or text with the eyedropper tool (under “Fill Color” in the properties bar). Select the shape you want to color, click the eyedropper, and exactly match any color you want.
- Change conditional formatting rules: You can dictate formatting depending on the content or data in a shape. Add icons, a progress bar, or change the color and line style as part of that conditional formatting. As some of our templates make use of these rules, make sure to go to the dock and change those to fit your specific use case.
- Replace data in data linked templates: Many of our example templates have linked data, meaning that an outside data source, usually a spreadsheet, has been imported and some of the information has been put into shapes. These will automatically update whenever you make changes to the data sheet. Follow the instructions in the resource bar to make a copy of the data source if you want to use it as a template.
Come explore all the ways that Lucidchart templates can help you see more, know more, and do more.
Open the template galleryAbout the author

Marie-Reine Pugh works on finding diagramming solutions as a template specialist at Lucid. With a background in English, she is also fairly obsessed with all kinds of writing and storytelling. She spends her free time perusing books at her local library, watching movies, and baking.
About Lucidchart
Lucidchart, a cloud-based intelligent diagramming application, is a core component of Lucid Software's Visual Collaboration Suite. This intuitive, cloud-based solution empowers teams to collaborate in real-time to build flowcharts, mockups, UML diagrams, customer journey maps, and more. Lucidchart propels teams forward to build the future faster. Lucid is proud to serve top businesses around the world, including customers such as Google, GE, and NBC Universal, and 99% of the Fortune 500. Lucid partners with industry leaders, including Google, Atlassian, and Microsoft. Since its founding, Lucid has received numerous awards for its products, business, and workplace culture. For more information, visit lucidchart.com.
Related articles
Org chart templates and examples
Need to create an organizational chart to define roles and responsibilities within your group? Get started with these org chart templates and examples! You'll also learn how to create an org chart in Google Docs and how to automatically import org charts with Lucidchart.
Lucidchart flowchart templates and examples
As you may have noticed from user stories on our blog and our creative flowcharts, you can build a flowchart for just about any purpose to visualize any idea or process. Get started with these flowchart templates and examples!
How to design a process infographic (+ free templates)
In this blog post, we will explain what a process infographic is and how to create your own. Includes free templates!