
Block diagram maker
Visualize systems and how they interact with Lucidchart. Create a free block diagram online with our intelligent diagramming software and get an overview of your entire system—no matter how complex.


By registering, you agree to our Terms of Service and you acknowledge that you have read and understand our Privacy Policy.


Block diagram software made simple
Learn how our block diagram generator can help you create block diagrams, including functional block diagrams, with ease.
Use built-in shapes

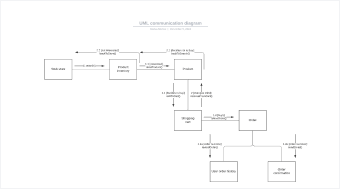
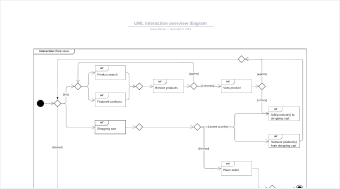
Try a block diagram template

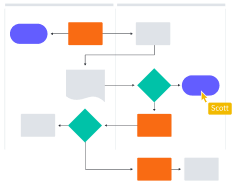
Collaborate with ease

Work anywhere

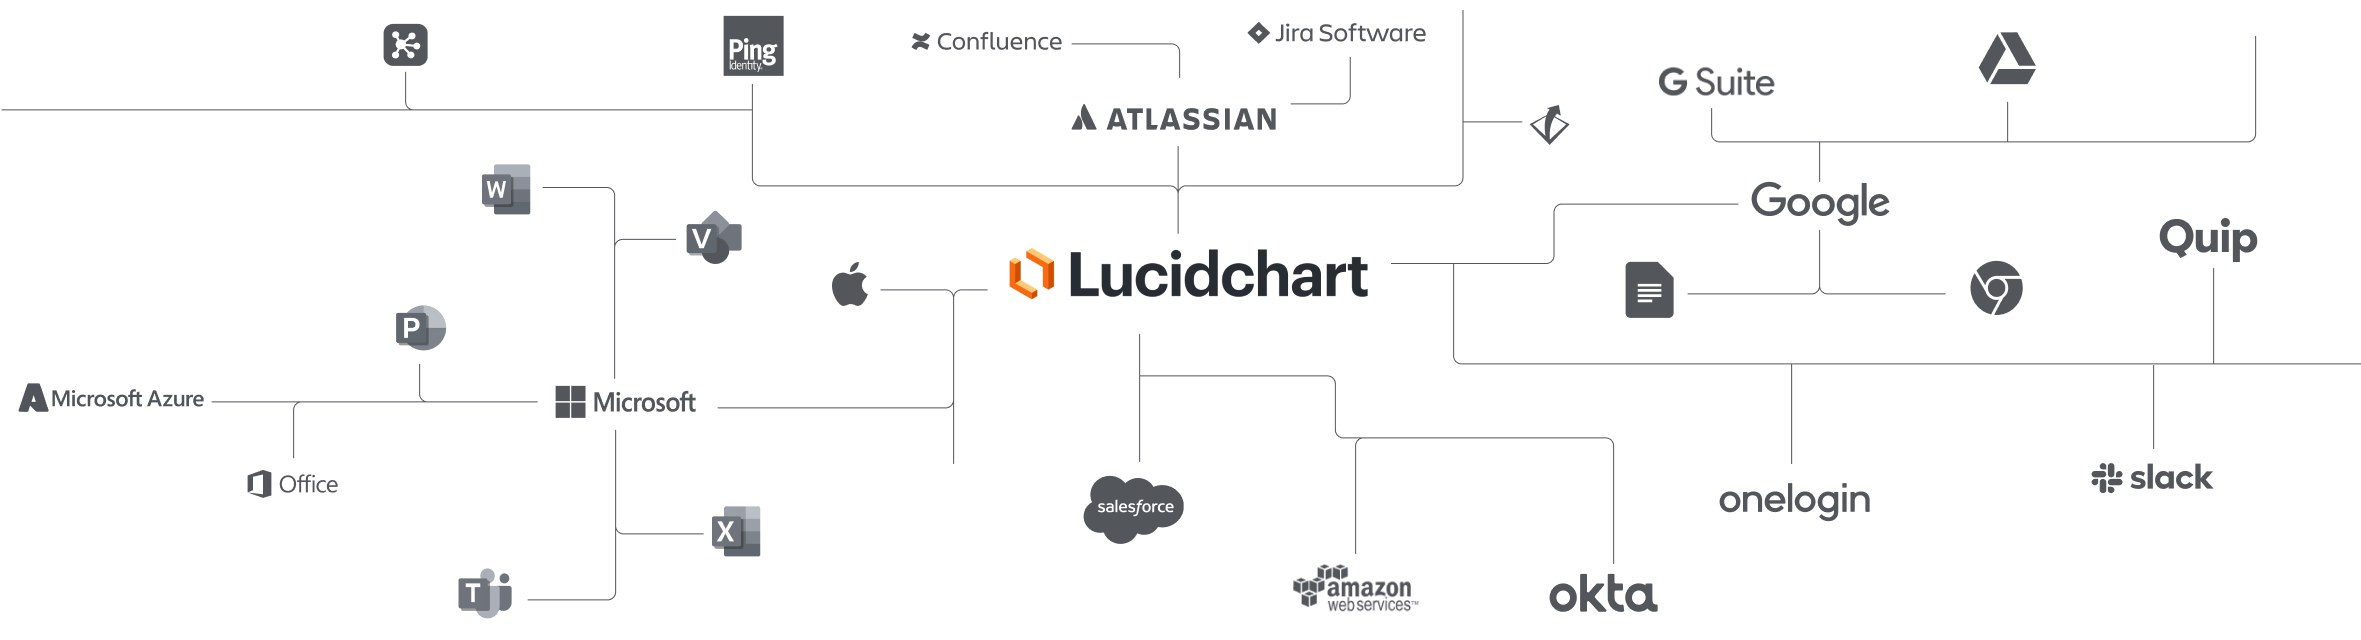
Leverage Lucidchart’s integrations

Trust our excellent reviews
Just 3 minutes to learn to use Lucidchart
master the basics of Lucidchart in 5 minutes
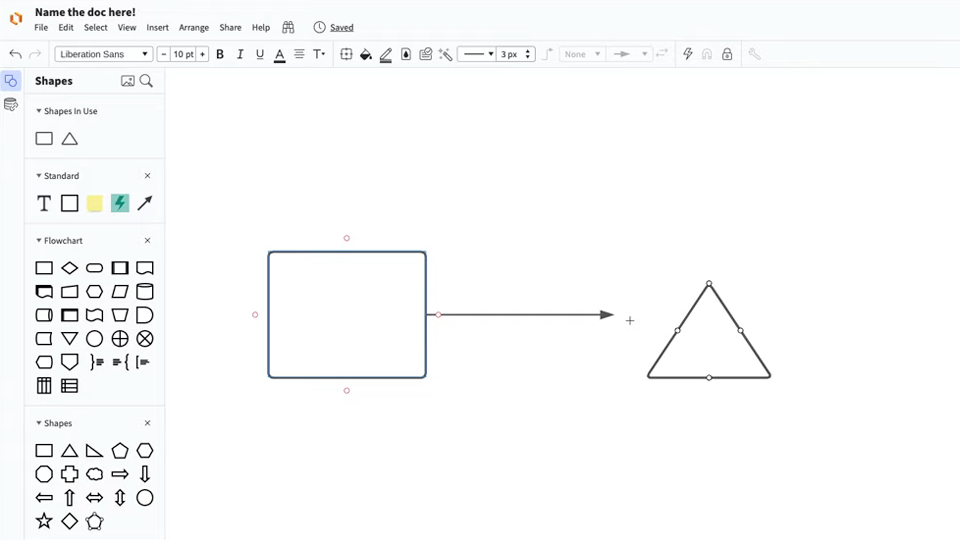
- Create your first block diagram. You can start from a blank canvas, or you can get a head start by using a template or importing a document.
- Fill out your diagram with shapes and connecting lines, then write in text to describe what they represent.
- Format your diagram and adjust the styling to make it look just right.
- When you need to find a feature, use Feature Find to locate it right away.
- Share your diagram with your team to get their feedback, or invite them to collaborate on it with you.
Block diagram templates
Use a free template from our gallery to start working on your block diagram.
Lucidchart integrations
Connect Lucidchart to your favorite industry-leading apps.
See why teams use Lucidchart as their block diagram maker
Diagram, visualize data, and collaborate all in one platform.

Collaboration
Clarity
Alignment

Better together
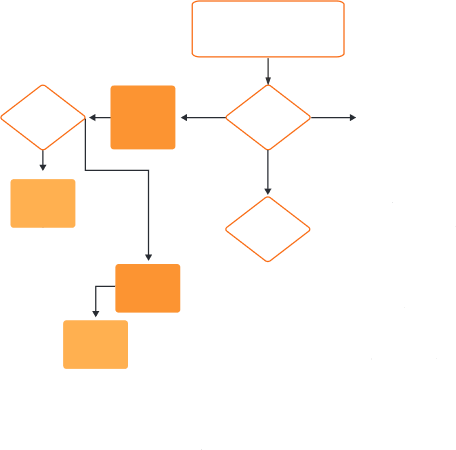
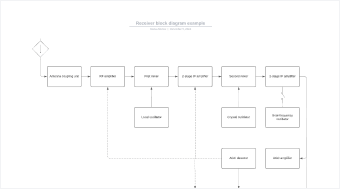
What is a block diagram?
A block diagram is a specialized flowchart that engineers use to visualize systems and how they interact. Block diagrams give you a high-level overview of a system so you can account for major system components, visualize inputs and outputs, and understand working relationships within the system. Use Lucidchart’s block diagram creator to tackle complex system overviews when designing hardware or software and implementing process improvements.
How to make a block diagram
Start to visualize the system
Begin with a blank canvas or one of our templates. Identify the components, inputs, and outputs of the system you’re diagramming.
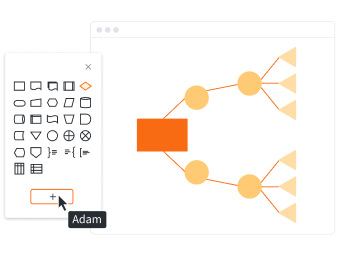
Add symbols
Drag and drop symbols and notations from Lucidchart’s shape library onto your canvas. Connect the shapes in your block diagram with arrows to indicate the flow of data.
Label inputs and outputs
Identify and label the input at the beginning of your block diagram and do the same for the output at the end.
Present, publish, or share
Present your block diagram directly from Lucidchart with Presentation Mode or share it. You can send it to others as a published link or by using one of our supported integrations.