Even before the COVID-19 lockdowns, the hybrid work model was starting to take shape. A lot of organizations were already hosting virtual meetings and finding ways to collaborate across time zones. COVID-19 didn’t invent the hybrid work model, but it did accelerate its evolution.
In the past three years, managers have learned that remote employees can be very productive—and they aren’t looking back. Currently, 12.7% of full-time employees work from home, with another 28% working a hybrid model. Now, companies are finding that a whopping 98% of workers want to work remotely, at least part of the time.
However, despite many of the benefits of remote work for both employees and businesses, managers are facing some challenges.
- Disconnected workforce. Working in different locations means less face-to-face meetings, which can create communication barriers.
- Silo mentality. Cross-team collaboration can be difficult when employees are separated from each other.
- Scheduling difficulties. When working with teams that are spread across multiple time zones, it’s hard to schedule a time that works for everybody.
- Communication breakdowns. Communication is a major key to success. If the team doesn’t communicate enough, it’s difficult to understand what everybody is working on, what the current status of the project is, and what dependencies exist.
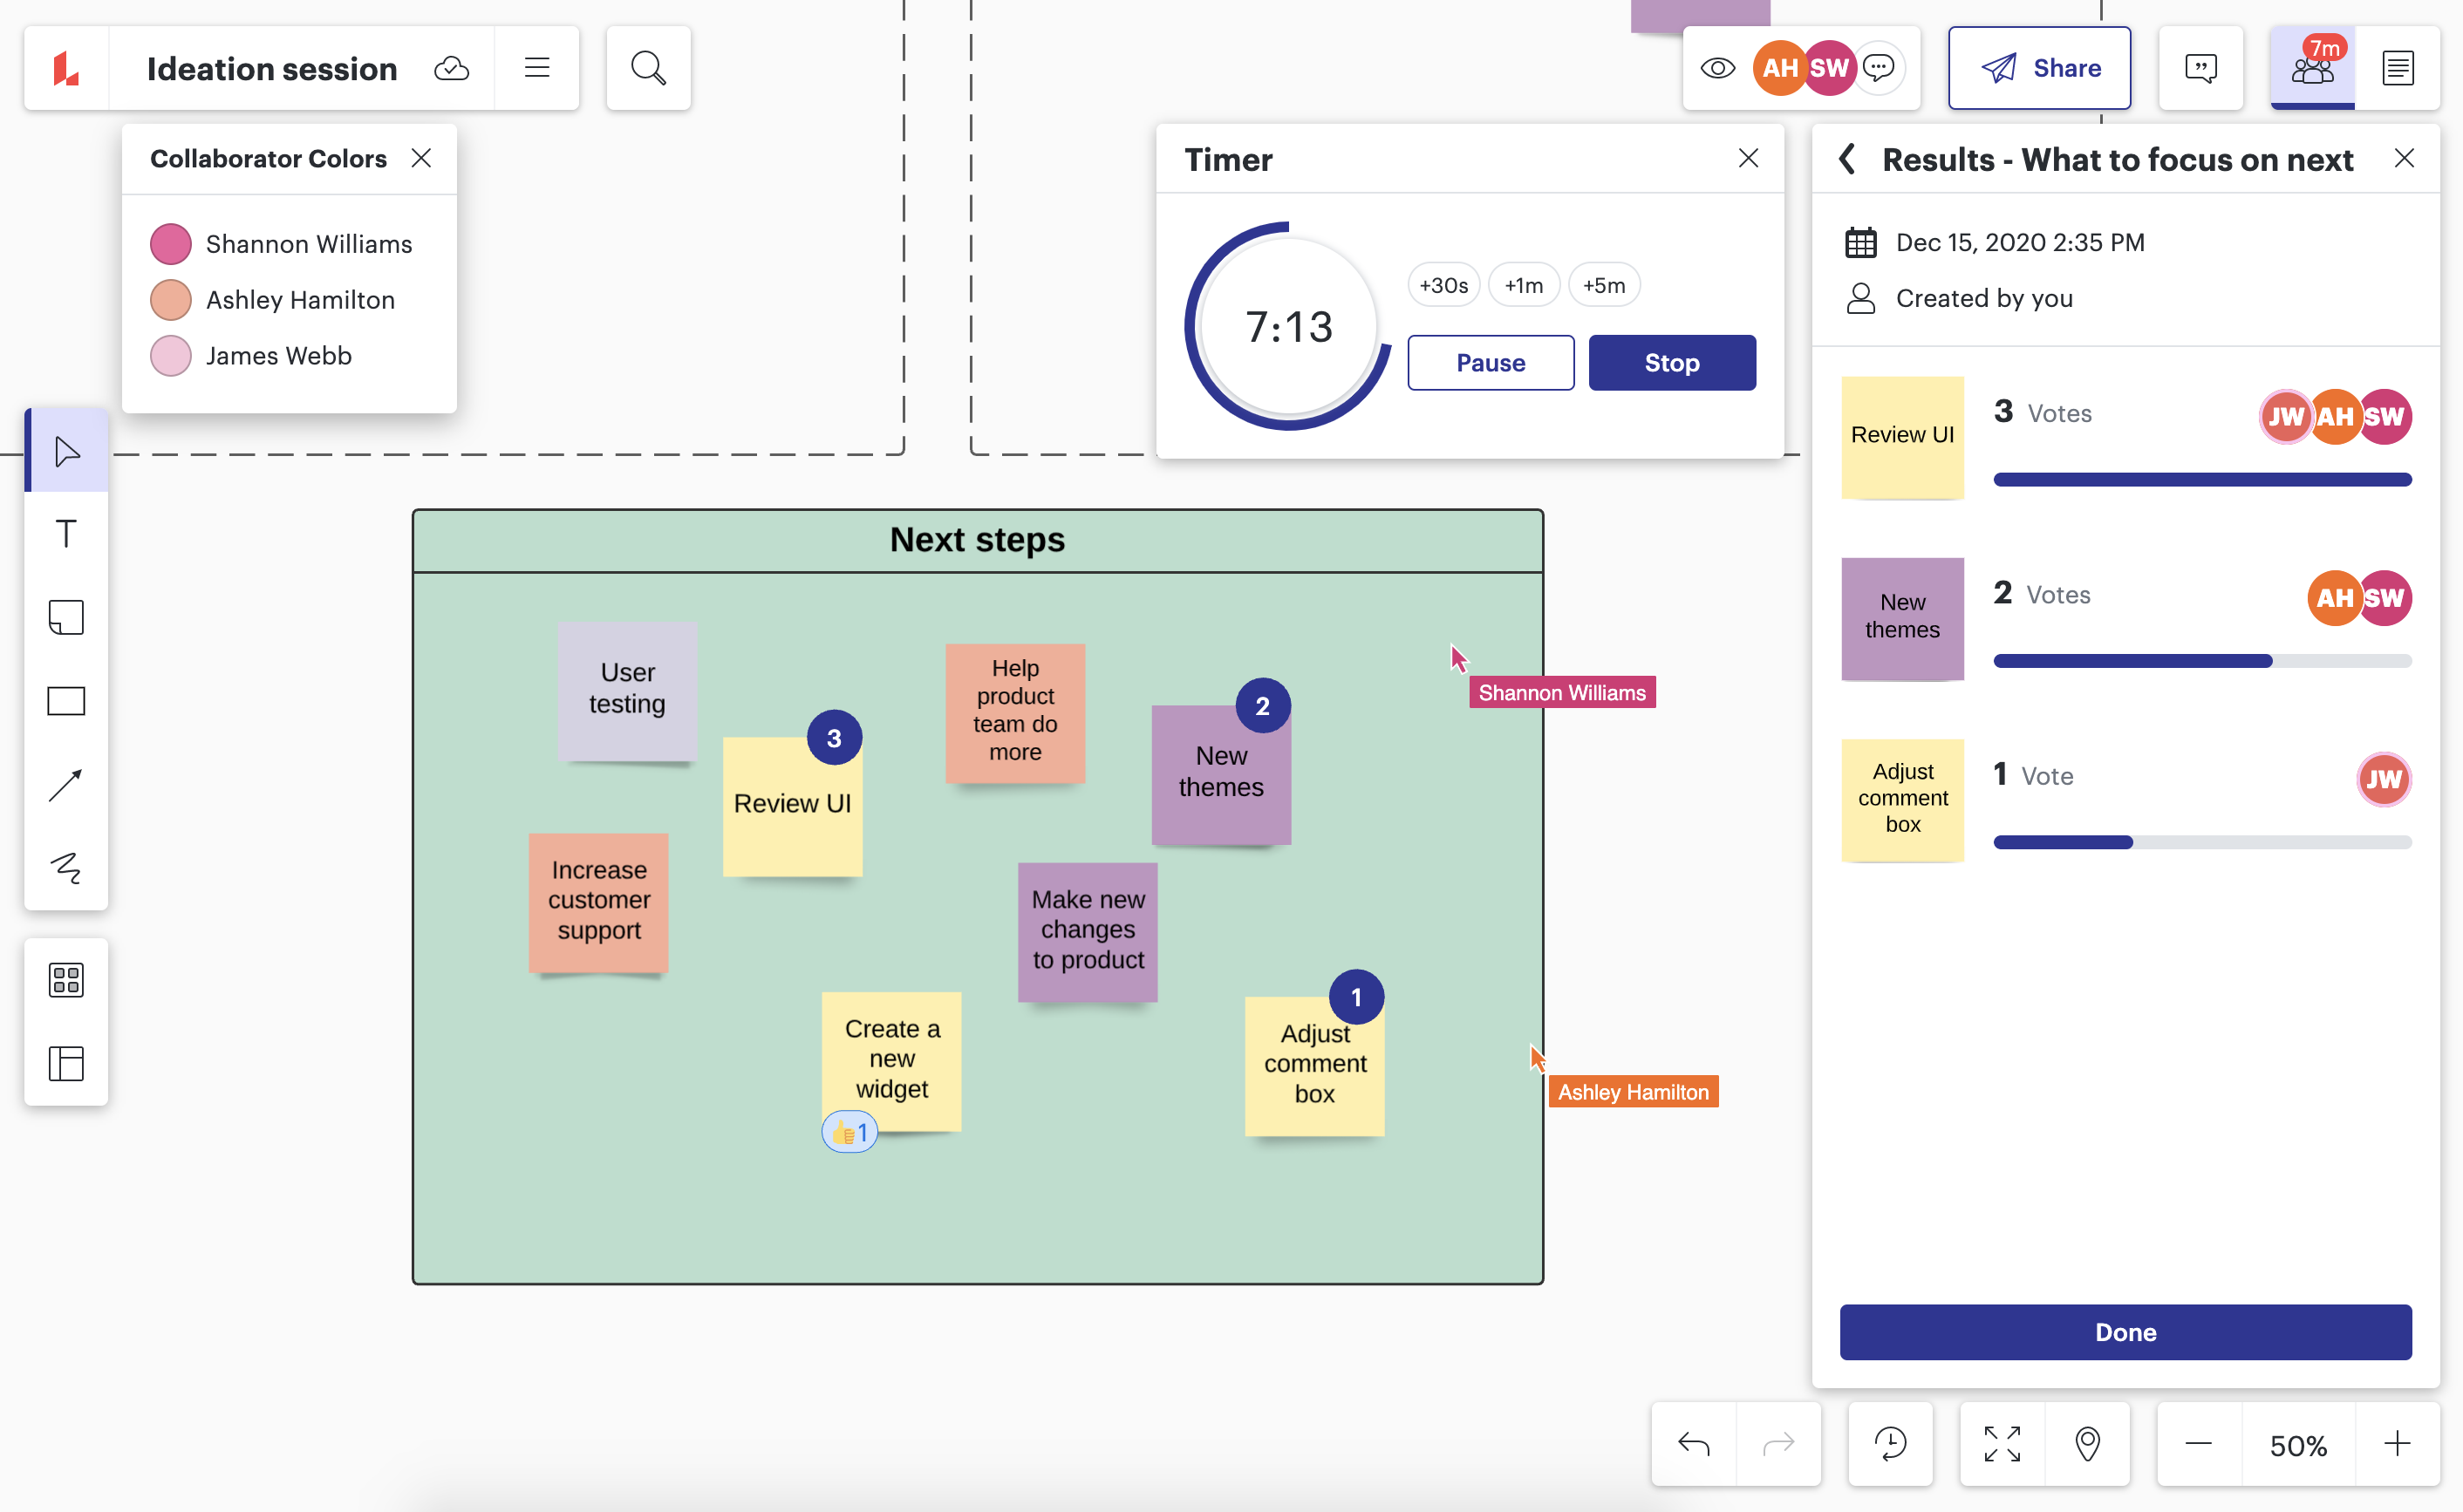
- A decline in collaboration and creativity. The lack of a visual element such as a whiteboard makes it hard for team members to brainstorm and ideate.
In this article, we’ll talk about how using visuals in your virtual meetings can help you to overcome these challenges and spur hybrid team engagement from any location.
Why are visuals effective for aligning hybrid teams?
Have you ever sat through a meeting where information is exchanged only verbally? It’s harder to concentrate on what is being said. You try to take notes, but maybe you miss important information because you’re thinking about writing down what the speaker just said rather than concentrating on what is currently being said. Maybe it’s harder to retain the knowledge after you leave the meeting.
In general, our brains work better as image processors than word processors. Words are abstract, while images are concrete, which makes them easier to interpret and remember. In fact, neuroscientists at MIT found that the brain can process full images seen for only 13 milliseconds. This makes sense because we live in a visual world. Our eyes shift gaze up to three times per second as we interpret the world around us and often have to make quick decisions based on what we see.
Studies show that 65% of people are visual learners. That’s why people in meetings often use whiteboards, presentations, and other visual aids to illustrate their ideas. It’s much easier to show somebody what you mean than it is to try to tell them what you mean. Other team members can easily add their ideas to a collaborative visual space, helping teams build creative solutions.
The hybrid work model and virtual meetings don’t naturally include these visual elements that inspire collaboration. A presenter can share a monitor and provide some visuals, but other team members typically don’t have access to add ideas or modify the document. According to Lucid research, 75% of employees believe that collaboration in team meetings suffers the most in a hybrid work environment.
To be more effective, hybrid teams need a way to take the type of collaborative experience they get in the office and simulate it in a virtual setting. The right set of visualization tools can help you to replicate in-person meetings and keep remote workers aligned.
How the Lucid Visual Collaboration Suite can help align hybrid teams
Visuals can bring documents to life and make them more interesting. Well-placed images, shapes, colors, and photos can draw attention to important information, hold someone’s interest, and encourage active collaboration. Basically, using visual tools improves your overall work experience. According to 451 Research, the use of visual collaboration tools:
- Helps you to get the right information to the right people so they can quickly resolve issues and make decisions.
- Keeps employees engaged because there is less tedium and fewer distractions.
- Helps your team to be more productive because there is greater engagement among all employees.
- Encourages a more creative and enjoyable work experience because of the flexibility and customization the tools offer.
The Lucid Visual Collaboration Suite helps teams come together to work on the same projects in real time, no matter where they are in the world.
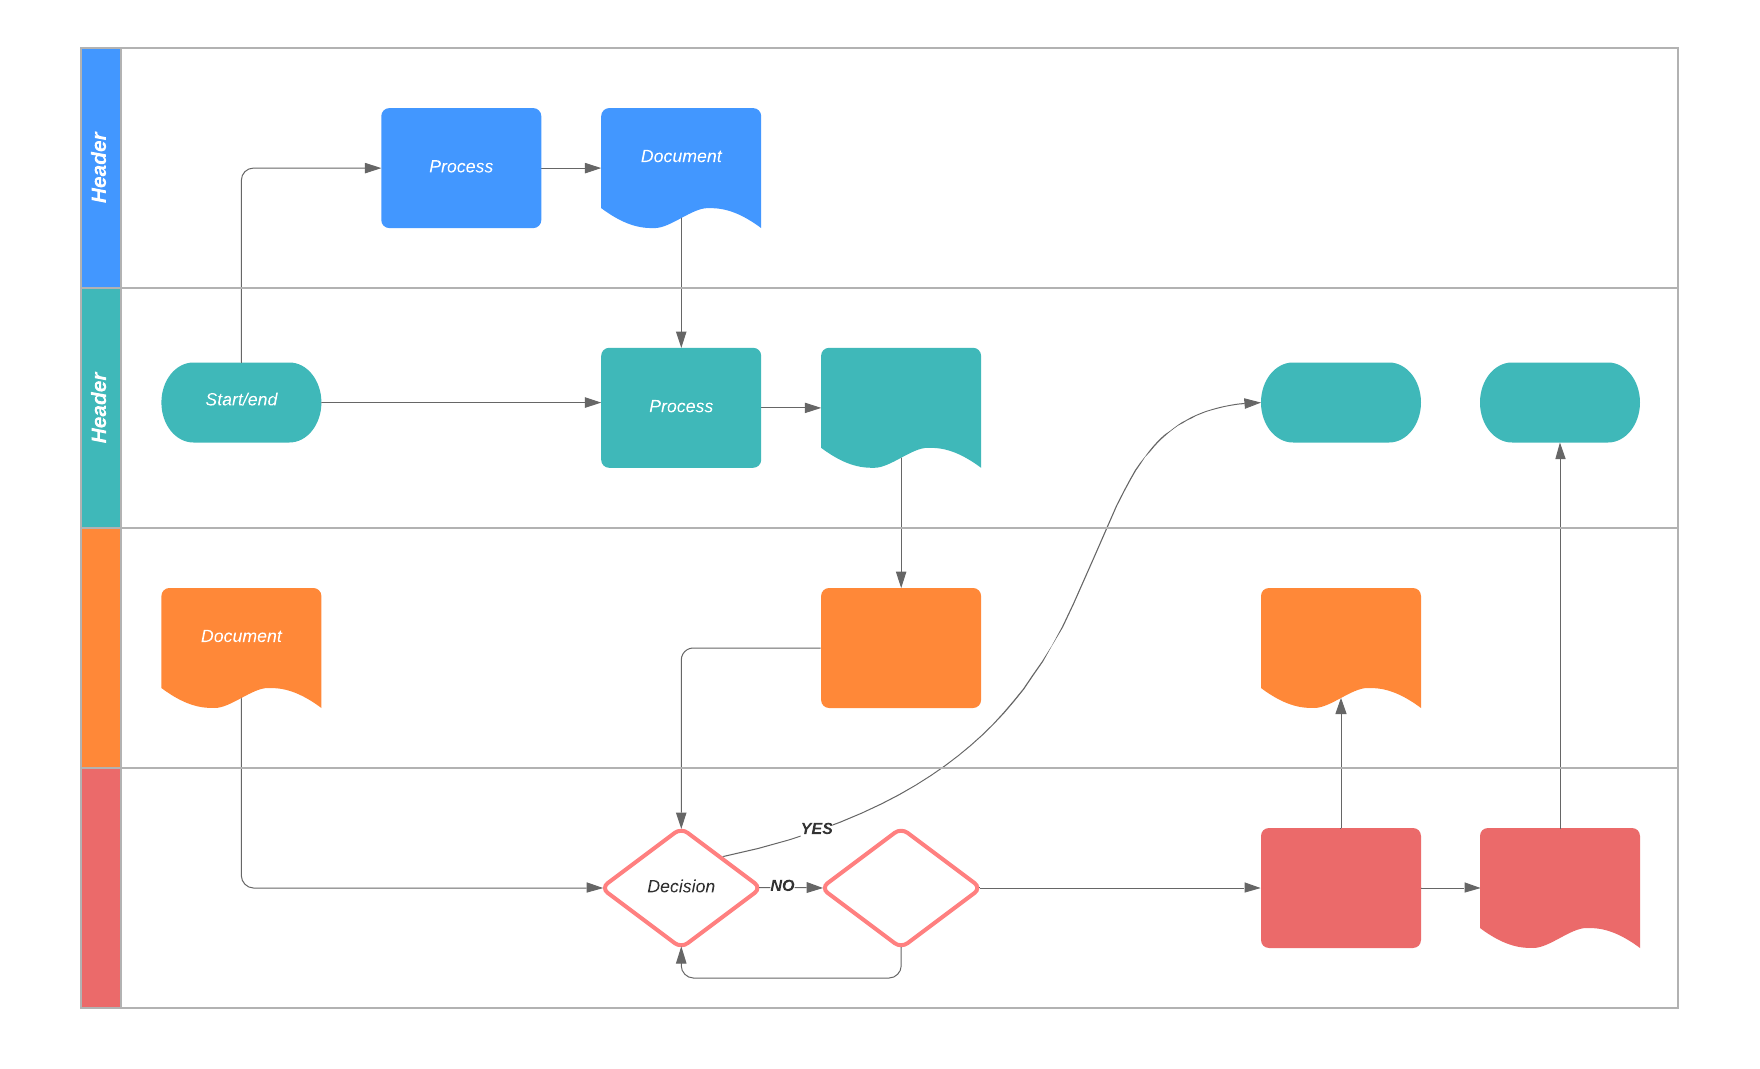
Flowcharts
Lucidchart is an easy-to-use intelligent diagramming platform that you can use to map processes that are difficult to explain verbally.
For example, you can create flowcharts that help:
- Make complex processes easier to understand and follow.
- Identify problem areas such as duplication of work, unnecessary work, and bottlenecks.
- Provide a common visual language that can be easily understood across different departments across the organization.
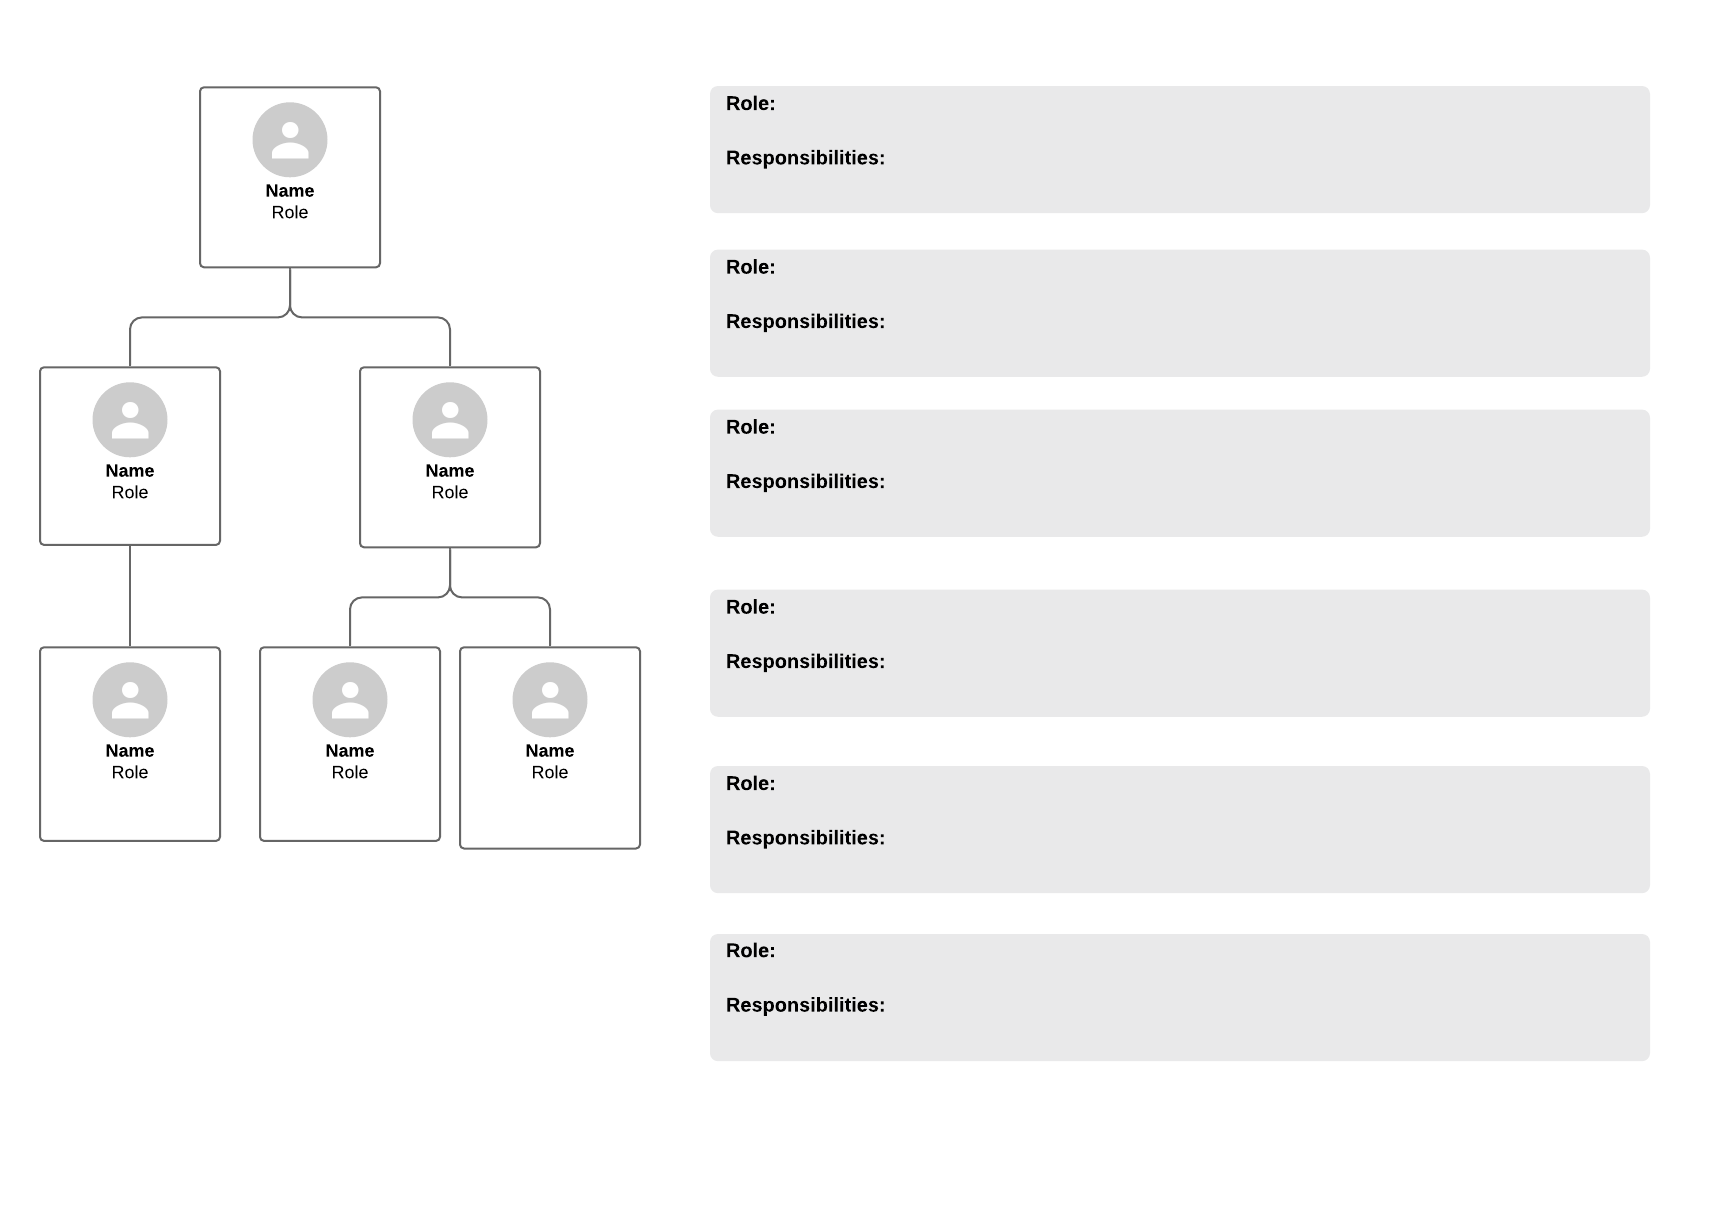
- Give team members a better understanding of roles and responsibilities.
- Design and optimize processes.