value stream mapping DevOps

How to Use Value Stream Mapping in DevOps

Reading time: about 7 min

Topics:

  • IT and Engineering
  • Product development

Competitors go head to head over more than what products and services they offer, but over how rapidly they can deliver quality results that provide value to customers.

For businesses to remain competitive and valued, they need to develop good ideas swiftly, with few errors, and deliver them to end users to acquire feedback. With the help of DevOps and value stream mapping (VSM), organizations can scale DevOps adoption and accelerate paths to implementation and iteration without compromising the caliber of the product.

What is value stream mapping and why use it?

Rather than deep dive into VSM methodology, you simply need to know that value stream mapping is a flowchart method used to illustrate, analyze, and improve the steps required to deliver a product or service to customers—especially in complex environments. The stream reflects both tasks and information flows, mapped as either adding or not adding value from a customer’s standpoint.

The benefits of VSM derives from Lean principles to identify and eliminate waste. Traditionally, it has been used in manufacturing, but the principles are actually quite useful in more areas than assembly lines, such as IT and operations initiatives.

DevOps value stream map
DevOps Value Stream Map (Click on image to modify online)

Why use VSM in DevOps?

DevOps is a culture where everyone is responsible for continuous delivery, from the planning and software development life cycles (SDLC) to production monitoring and continuous improvement. Basically, it’s more than a handoff: It is an ongoing, cross-functional approach, rooted in Agile and Lean principles.

Value streams are a visual tool that allows organizations to objectively measure and track what is most important to them and what they believe will actually bring value to customers in the end.

Here is a non-exhaustive list of why your DevOps teams should utilize VSM:

  • Helps identify bottlenecks and pain points
  • Manages errors and defects, such as bugs
  • Creates greater visibility and traceability throughout the entire cycle
  • Eliminates redundant and wasteful processes
  • Fosters cross-functional collaboration
  • Reveals opportunities for automation
  • Fuels faster, integrated feedback
  • Provides context and process clarity with data and visuals
  • Emphasizes results and KPIs

Use value streams to gain insight and guide necessary improvements to ensure you have the bandwidth to support functionality and the documentation to put it into place.

How to use VSM in DevOps

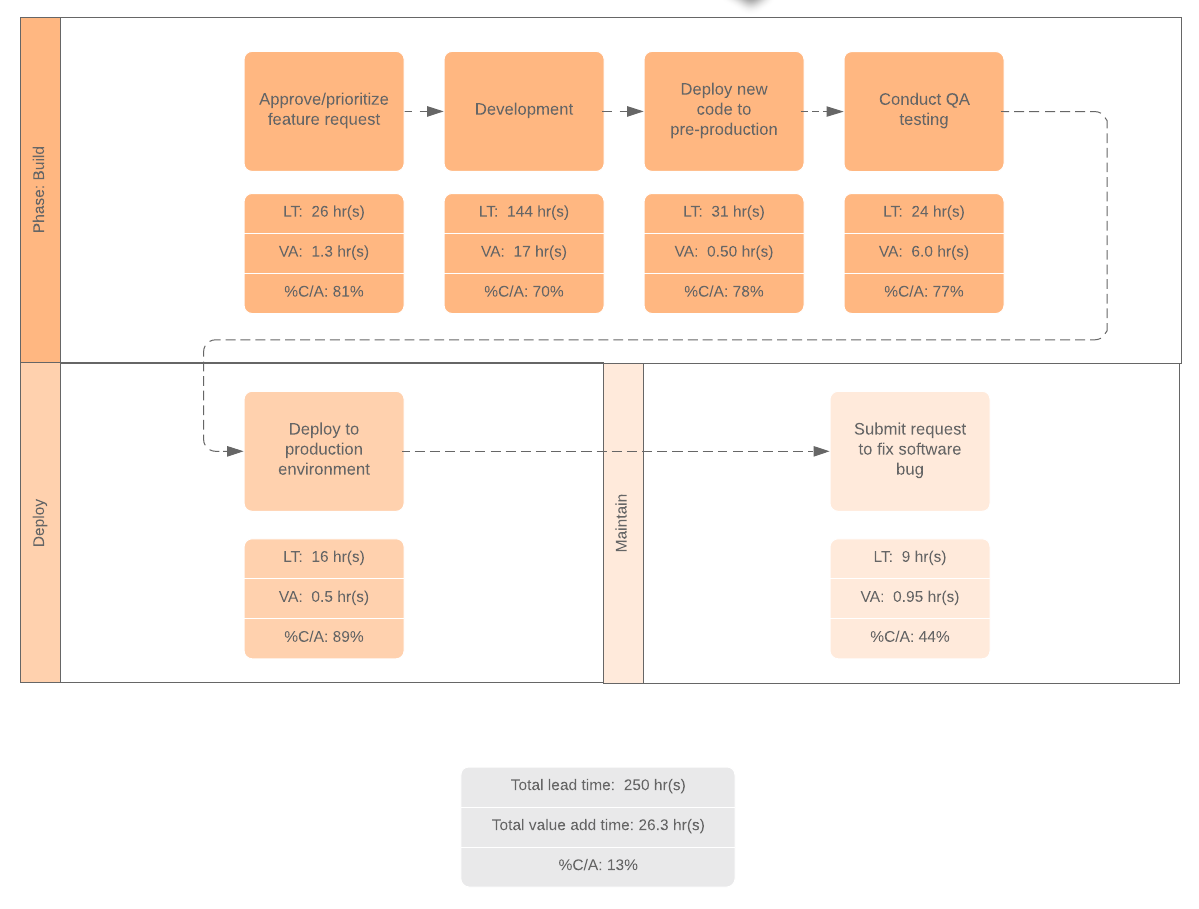
In a DevOps environment, VSM and lean methodologies are tailored to specific actions, such as moving work between teams to creating tangible deliverables and incident reports. DevOps VSM is a uniting visual representation of how IT and business build, deploy, and manage workflows. It should begin with the SDLC and move through quality assurance and release/operations.

The stream should delineate everything between your start and finish points, from product development to deployment and beyond. Build your diagram using key metrics to determine how you define and measure success so you can iterate and continuously improve.

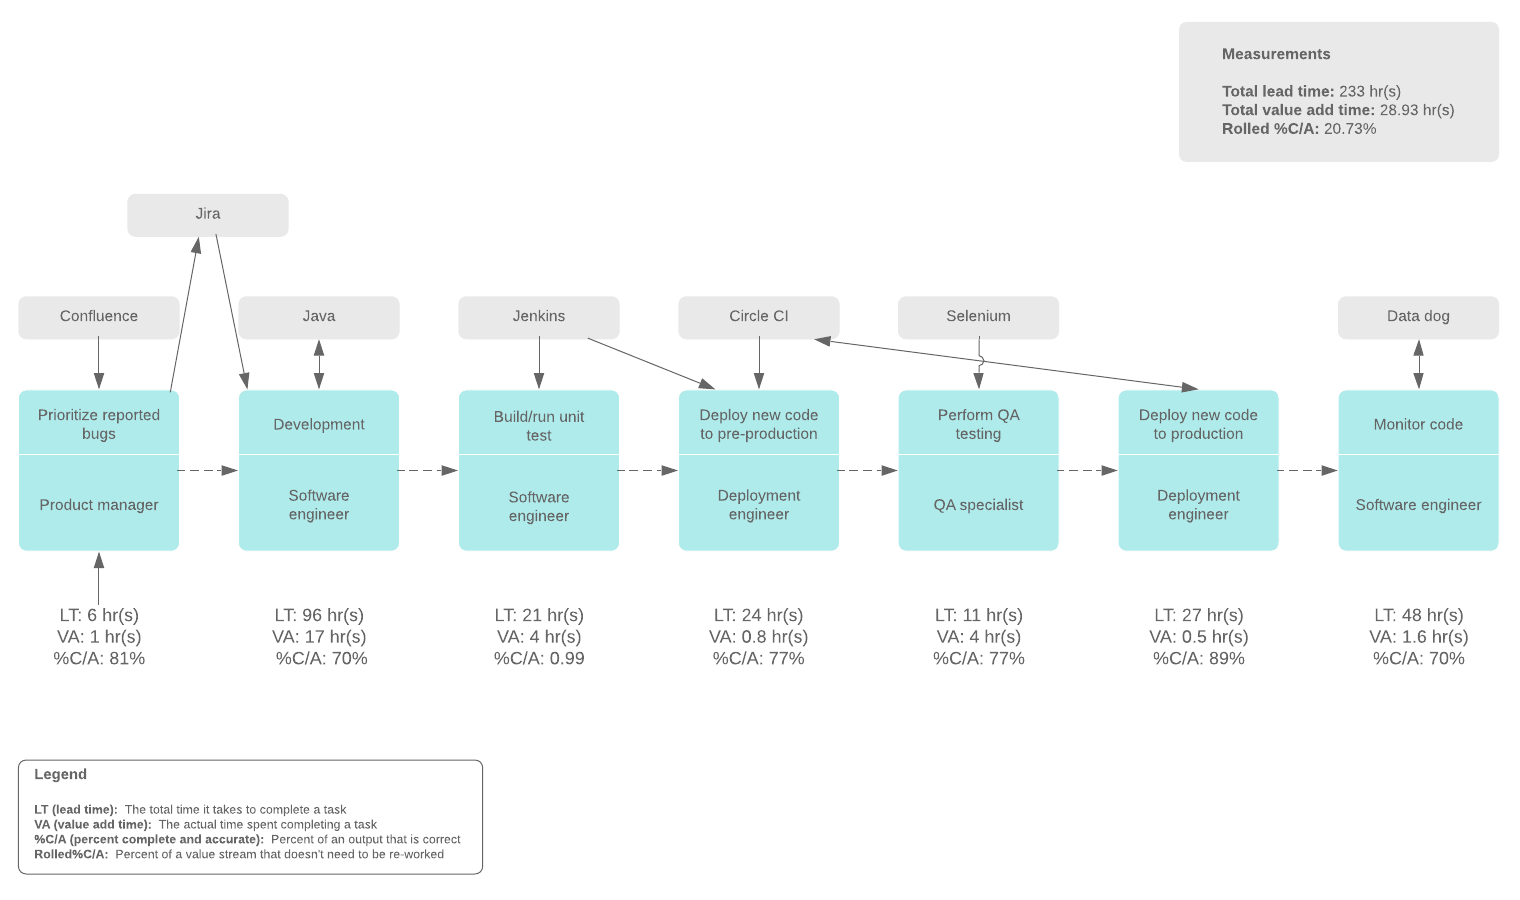
Lean and Six Sigma principles suggest measuring things such as value added time and lead time. In a DevOps environment, exactly what you measure and how you measure it will naturally look a little different than traditional uses. However, you can still use the suggested metrics, simply tailored to your own domain. Here’s a quick overview of the three key components:

Value added (VA)

Value added time is the amount of time that a team actually spends working on the project (as opposed to, for example, the time that a project or request sits in the queue). Whenever there is no change in the product, it is considered non-value added time.

Lead time (LT)

Lead time represents the total time it takes a person or team to complete a task—it is the combination of value added and non-value added.

% Complete/accurate (%C/A)

This is the percentage of information-based work that is complete and accurate the first time and requires no re-work by downstream processes.

Now, you can actually get started. Build your own data-driven stream by following these four steps:

  1. Map out your as-is DevOps stream
  2. Identify waste
  3. Build your to-be DevOps stream
  4. Communicate change to your organization

To get started, you can use the Lucidchart platform to build, analyze, and share your work in all stages with developers, QA, and stakeholders for better understanding all around. Quickly message DevOps channels or individuals using the Lucidchart Slack integration, or even give diagram access to keep stakeholders up to date through the cycle.

Let’s take a closer look at each of the steps:

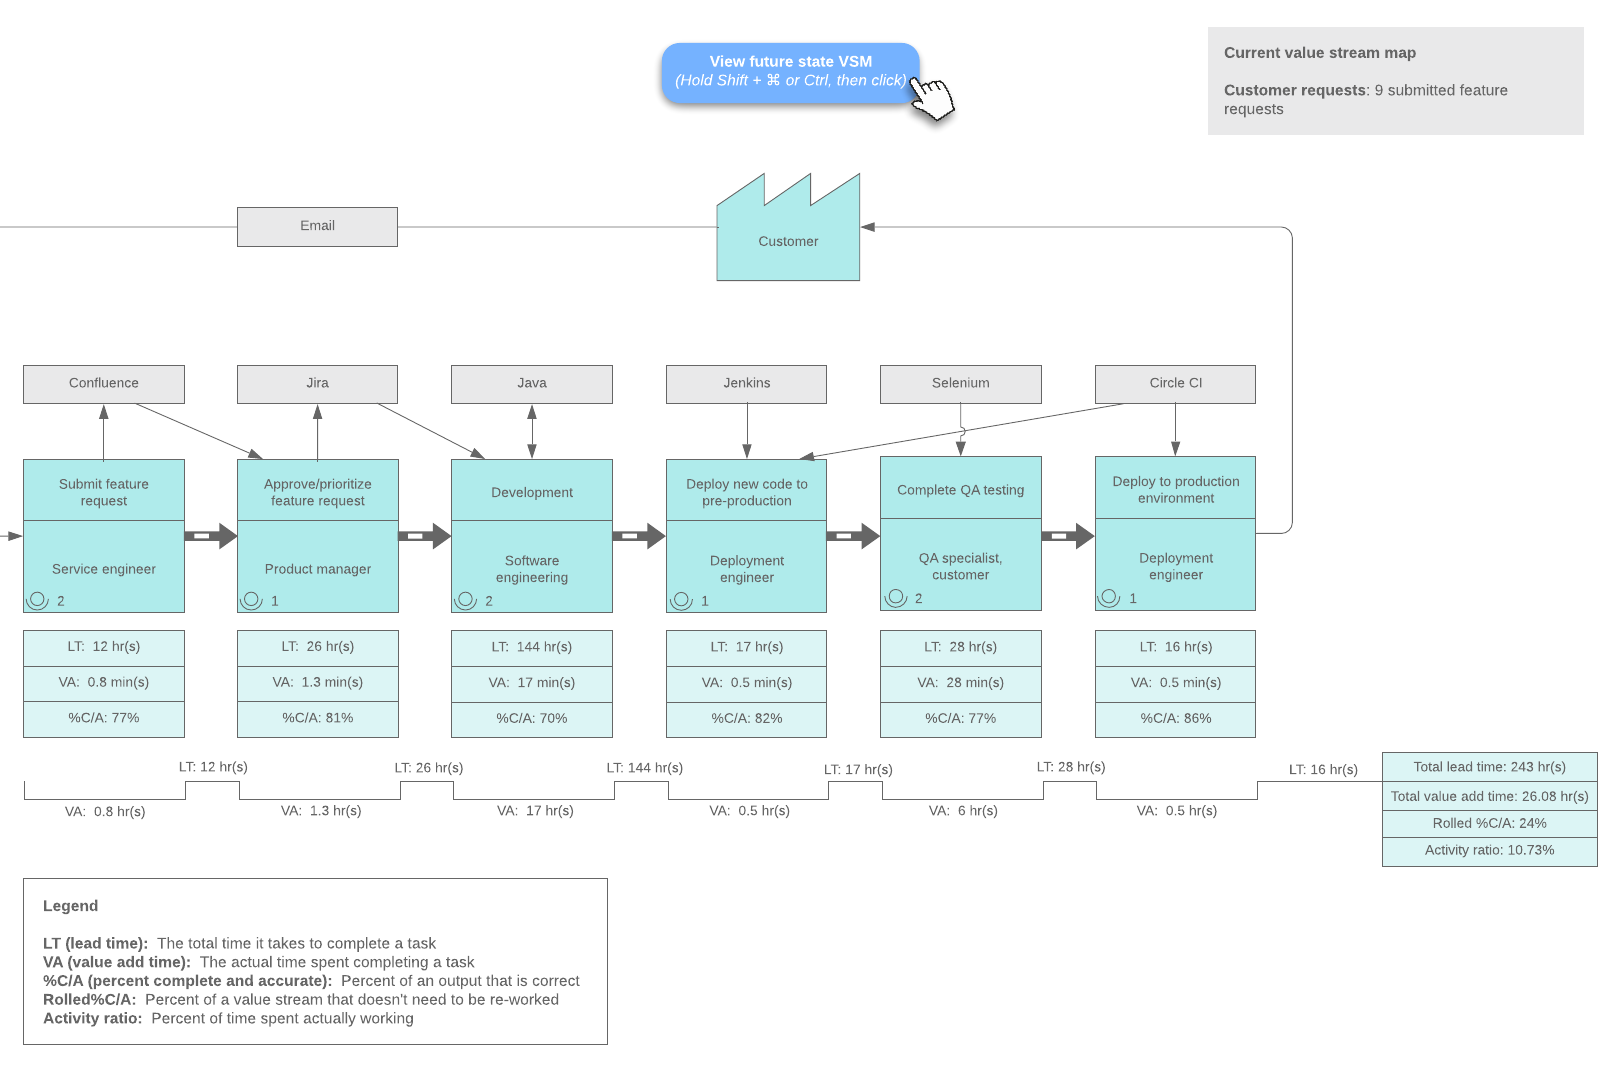
Map out your as-is DevOps VSM

While we want to quickly implement new and improved processes, it’s crucial to build your as-is DevOps value stream early in the process to guide your future state and ensure you deliver what the customer needs, when they need it.

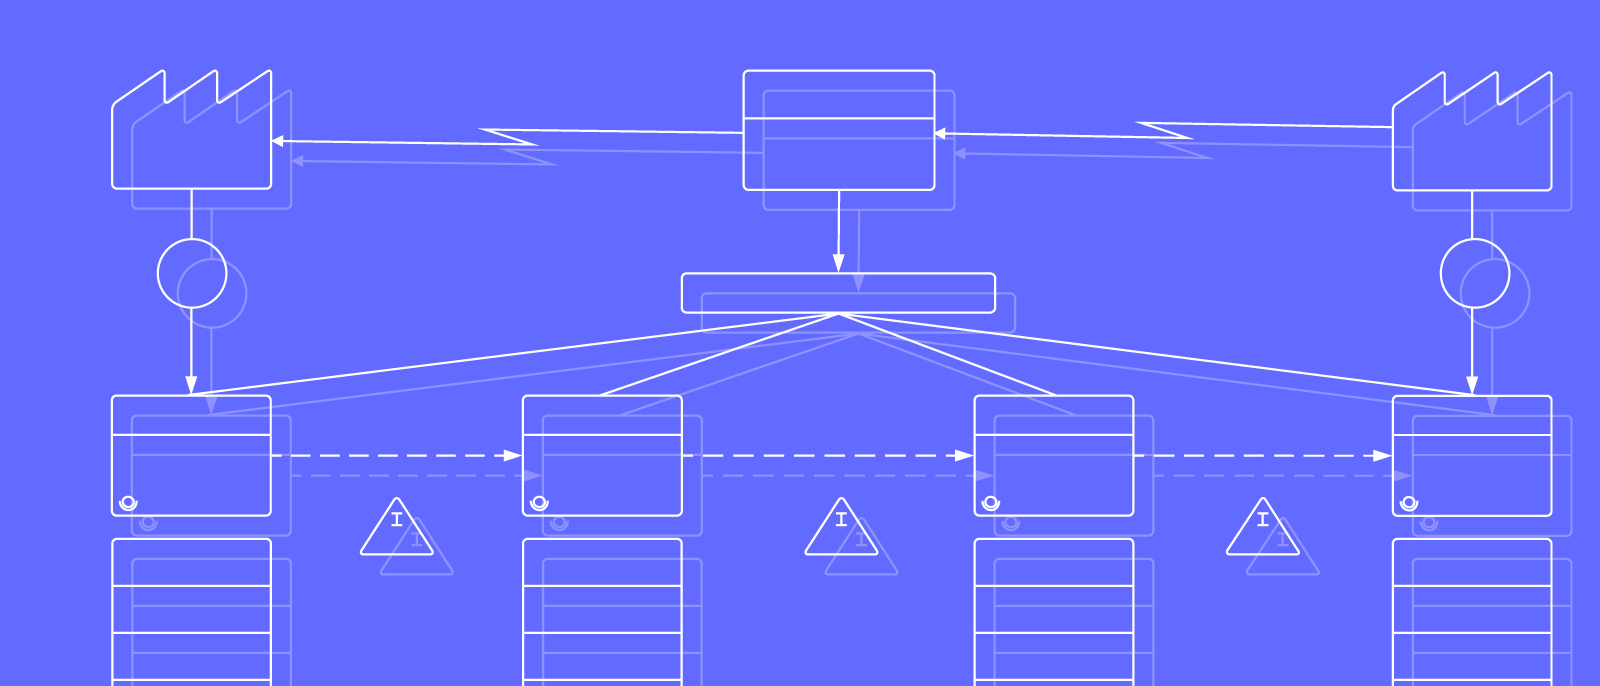
Your stream will likely be complex, but you can easily visualize your current state using Lucidchart, which offers all the shapes you need to get started, such as process, material, information, and general shapes.

swimlane DevOps value stream map
Swimlane DevOps VSM (Click on image to modify online)

You can share your diagrams with the employees directly involved to ensure the documentation is accurate. Employees can provide feedback directly on the stream map or make changes to the document in real time, all without worrying about version tracking.

Now that you know which metrics to use, consider the following questions—in no particular order—to guide your stream creation:

  • What are the main steps in the current process of software development and operations?
  • Who performs each step?
  • What is the %C/A for each step in the value stream map?
  • What is the LT for each step?
  • What is the VA time for each step? This excludes waiting time—such as being in queue—or any other non-productive work time.
  • What tools do you currently use for each step? Determine if there are opportunities to automate manual steps.

Identify waste

Your value map will help mitigate excessive downtime, congestion, and other issues in the future. Naming the type of waste in your process is helpful to guide the type of improvements needed. Waste can occur within groups of people, specific processes, technology, or even in a combination.

There are eight types of waste within Lean, but this is a simple list of how those types of waste can be translated into DevOps, using DOWNTIME as a helpful acronym:  

  • Defects = Mistakes, bugs, and rework
  • Overproduction = Producing more than is necessary, like extra features
  • Waiting = Delays and the amount of time the product spends in queue
  • Non-utilized talent = Not including all employees in the improvement process
  • Transport = Handoffs from developers, to testers, to deployment
  • Inventory = Partially done work
  • Motion = Individual task switching
  • Extra processing = Relearning or reworking, such as undocumented code

Resist the urge to overlook poorly constructed processes, gaps, and weaknesses—or getting stuck in a “that’s just the way we do it” mentality. Seek out your discrepancies in order to achieve long-term benefits and perceived customer value.

Build your to-be VSM

After you’ve detected the types and amount of waste in your as-is state, build out your future state to optimize performance. Your to-be stream should provide a detailed vision of the target condition, guide you to the ideal state, and establish accountability.

Perhaps you need better flows with fewer interruptions, or maybe you have discovered multiple tasks you can combine, rearrange, or simplify. Brainstorm potential solutions for your to-be value stream by asking yourself—and others—the following questions:

  • How can we significantly increase the %C/A for each activity in our as-is VSM?
  • How can we dramatically reduce, or potentially eliminate, the non-value time in the LT of each as-is activity?
  • How can we improve the performance of the VA in each as-is activity?

Answers to these questions will look different for each organization, and even from project to project. Perhaps you need specific software fixes, to strengthen your DevOps dynamics or scrum tactics, or implement more automation with smaller releases. Whatever the need is, decide how to proceed with modifications. 

value stream map DevOps
Value Stream Map for DevOps (Click on image to modify online)

Use Lucidchart layers to easily represent changes to the life cycle. The Lucidchart library is stocked with standard VSM symbols so that you can precisely place them in your diagram with just a click.

Communicate change to your organization

Solicit feedback in real time and keep DevOps teams and stakeholders up to date by posting to Confluence or sharing with the teams using customizable permissions controls.

Rather than share anecdotes in emails or the hallway, communicate your improvements and show how products are created and brought to market with a high-level presentation.

Sign up free and start building effective value stream maps to drive products and value into the hands of customers. Stop wasting, and start innovating with Lucidchart today.

Lucidchart

Lucidchart, a cloud-based intelligent diagramming application, is a core component of Lucid Software's Visual Collaboration Suite. This intuitive, cloud-based solution empowers teams to collaborate in real-time to build flowcharts, mockups, UML diagrams, customer journey maps, and more. Lucidchart propels teams forward to build the future faster. Lucid is proud to serve top businesses around the world, including customers such as Google, GE, and NBC Universal, and 99% of the Fortune 500. Lucid partners with industry leaders, including Google, Atlassian, and Microsoft. Since its founding, Lucid has received numerous awards for its products, business, and workplace culture. For more information, visit lucidchart.com.

Related articles

Bring your bright ideas to life.

Sign up free

or continue with

Sign in with GoogleSign inSign in with MicrosoftSign inSign in with SlackSign in

Get started

  • Pricing
  • Individual
  • Team
  • Enterprise
  • Contact sales
PrivacyLegal
  • linkedin
  • twitter
  • instagram
  • facebook
  • youtube
  • glassdoor
  • tiktok

© 2024 Lucid Software Inc.