History of ER models
Peter Chen (a.k.a. Peter Pin-Shan Chen), a retired faculty member at Carnegie-Mellon University in Pittsburgh, is credited with developing ER modeling for database design in the 1970s. While serving as an assistant professor at MIT’s Sloan School of Management, he published a seminal paper in 1976 titled “The Entity-Relationship Model: Toward a Unified View of Data.”
In a broader sense, the depiction of the interconnectedness of things dates back to least ancient Greece, with the works of Aristotle, Socrates and Plato. It’s seen more recently in the 19th and 20th Century works of philosopher-logicians like Charles Sanders Peirce and Gottlob Frege.
By the 1960s and 1970s, Charles Bachman (above) and A.P.G. Brown were working with close predecessors of Chen’s approach. Bachman developed a type of data structure diagram called the Bachman Diagram.
Brown published works on real-world systems modeling. James Martin added ERD refinements. The work of Chen, Bachman, Brown, Martin, and others also contributed to the development of Unified Modeling Language (UML), widely used in software design.
Uses of entity relationship diagrams
Entity relationship diagrams have a number of uses, from database design and troubleshooting to education and research. Because ERDs define and illustrate entities and their relationships within a system, they are particularly useful for engineers and developers to visualize and document their databases.
Here are a few ways engineers and other operators can use entity relationship diagrams:
- Database design: ER diagrams are used to model and design relational databases, in terms of logic and business rules (in a logical data model) and in terms of the specific technology to be implemented (in a physical data model.) In software engineering, an ER diagram is often an initial step in determining requirements for an information systems project. It’s also later used to model a particular database or databases. A relational database has an equivalent relational table and can potentially be expressed that way as needed.
- Database troubleshooting: ER diagrams are used to analyze existing databases to find and resolve problems in logic or deployment. Drawing the diagram should reveal where it’s going wrong.
- Business information systems: The diagrams are used to design or analyze relational databases used in business processes. Any business process that uses fielded data involving entities, actions, and interplay can potentially benefit from a relational database. It can streamline processes, uncover information more easily, and improve results.
- Business process re-engineering (BPR): ER diagrams help in analyzing databases used in business process re-engineering and in modeling a new database setup.
- Education: Databases are today’s method of storing relational information for educational purposes and later retrieval, so ER Diagrams can be valuable in planning those data structures.
- Research: Since so much research focuses on structured data, ER diagrams can play a key role in setting up useful databases to analyze the data.
The components and features of an ER diagram
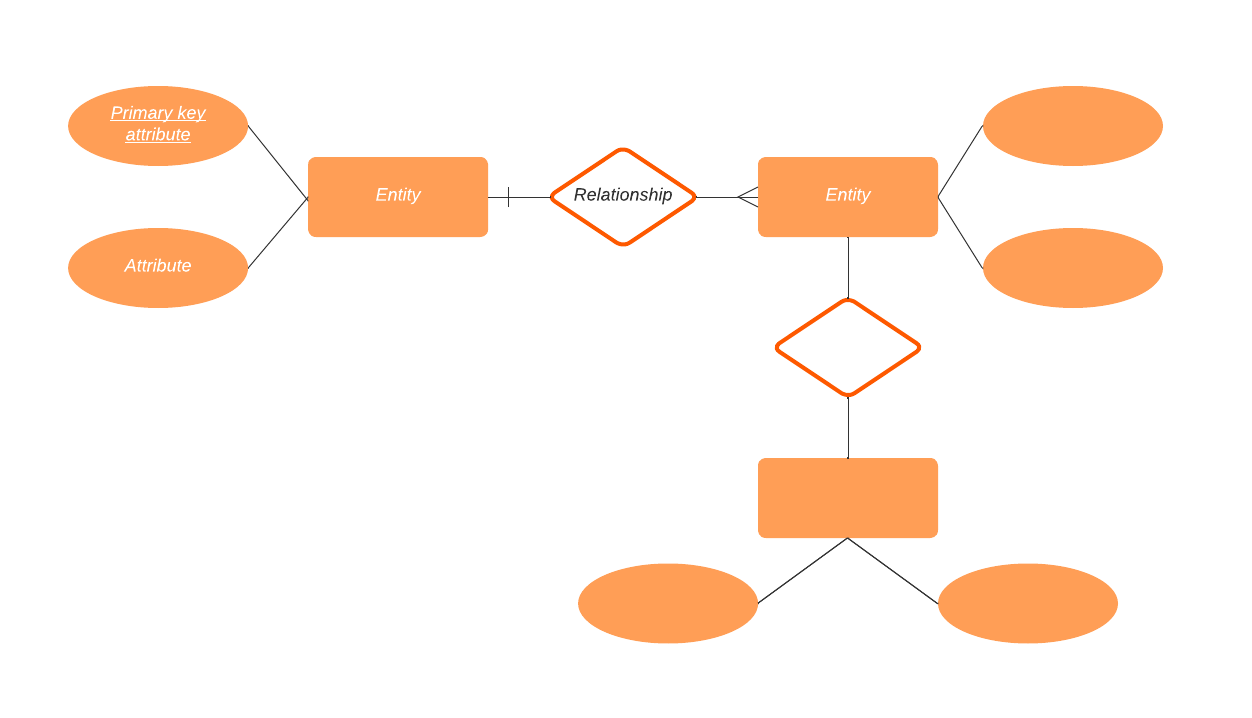
There are three main components of ER diagrams are composed of entities, relationships, and attributes. ER diagrams also depict cardinality, which defines relationships in terms of numbers. Here’s a glossary:
Entity
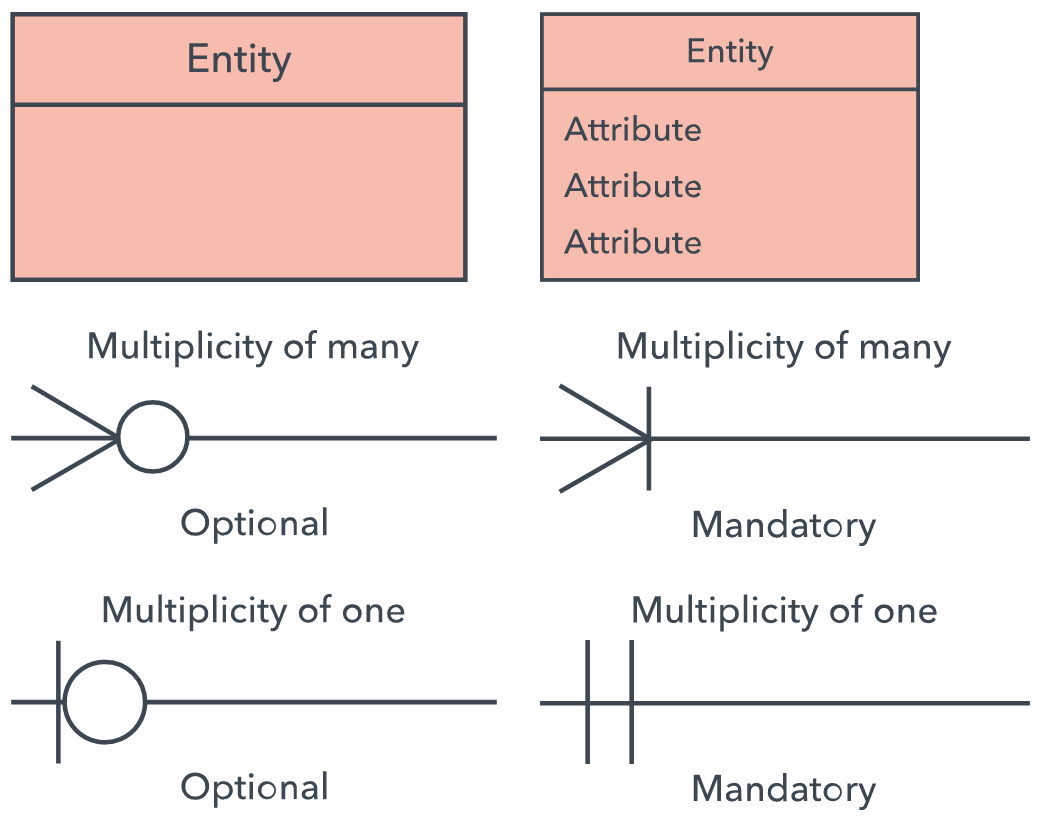
A definable thing—such as a person, object, concept, or event—that can have data stored about it. Think of entities as nouns. Examples: a customer, student, car, or product. Entities are typically represented as a rectangle.

Entity type: A group of definable things, such as students or athletes, whereas the entity would be the specific student or athlete. Other examples: customers, cars, or products.
Entity set: Same as an entity type, but defined at a particular point in time, such as students enrolled in a class on the first day. Other examples: Customers who purchased last months cars currently registered in Florida. A related term is an instance, in which the specific person or car would be an instance of the entity set.
Entity categories: Entities are categorized as strong, weak, or associative. A strong entity can be defined solely by its own attributes, while a weak entity cannot. An associative entity associates entities (or elements) within an entity set.

Entity keys: Refers to an attribute that uniquely defines an entity in an entity set. Entity keys can be super, candidate, or primary.
- Super key: A set of attributes (one or more) that together define an entity in an entity set.
- Candidate key: A minimal super key, meaning it has the least possible number of attributes to still be a super key. An entity set may have more than one candidate key.
- Primary key: A candidate key chosen by the database designer to uniquely identify the entity set.
- Foreign key: Identifies the relationship between entities.
Relationship
How entities act upon each other or are associated with each other. Think of relationships as verbs. For example, the named student might register for a course. The two entities would be the student and the course, and the relationship depicted is the act of enrolling, connecting the two entities in that way. Relationships are typically shown as diamonds or labels directly on the connecting lines.

Recursive relationship: The same entity participates more than once in the relationship. In other words, a relationship between two similar entities in considered recursive. For example, a relationship between an employee and a manager is a recursive relationship because they are both employees.
Attribute
A property or characteristic of an entity. Often shown as an oval or circle.

Descriptive attribute: A property or characteristic of a relationship (versus of an entity.)
Attribute categories: Attributes are categorized as simple, composite, derived, as well as single-value or multi-value.
Simple: Means the attribute value is atomic and can’t be further divided, such as a phone number.
Composite: Sub-attributes spring from an attribute.
Derived: Attributed is calculated or otherwise derived from another attribute, such as age from a birthdate.

Multi-value: More than one attribute value is denoted, such as multiple phone numbers for a person.

Single-value: Just one attribute value. The types can be combined, such as: simple single-value attributes or composite multi-value attributes.
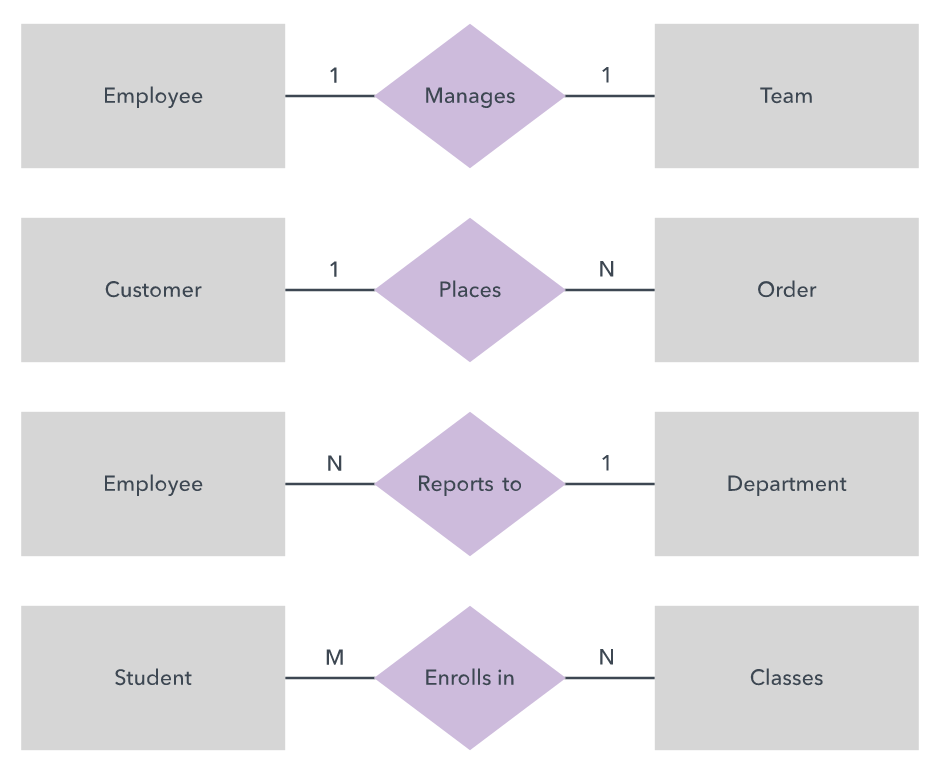
Cardinality
Defines the numerical attributes of the relationship between two entities or entity sets. The three main cardinal relationships are one-to-one, one-to-many, and many-many.
- A one-to-one example would be one student associated with one mailing address.
- A one-to-many example (or many-to-one, depending on the relationship direction): One student registers for multiple courses, but all those courses have a single line back to that one student.
- Many-to-many example: Students as a group are associated with multiple faculty members, and faculty members in turn are associated with multiple students.

Cardinality views: Cardinality can be shown as look-across or same-side, depending on where the symbols are shown.
Cardinality constraints: The minimum or maximum numbers that apply to a relationship.
Mapping natural language
ER components can be equated to parts of speech, as Peter Chen did. This shows how an ER diagram compares to a grammar diagram:
- Common noun: Entity type. Example: Student
- Proper noun: Entity. Example: Sally Smith
- Verb: Relationship type. Example: Enrolls (such as in a course, which would be another entity type)
- Adjective: Attribute for entity. Example: Sophomore
- Adverb: Attribute for relationship. Example: Digitally
The database query language ERROL actually mimics natural language constructs. ERROL is based on reshaped relational algebra (RRA) and works with ER models, capturing their linguistic aspects.
ERD symbols and notations
There are several notation systems, which are similar but vary in a few specifics.
Chen notation style

Crow’s Foot/Martin/Information Engineering style
Bachman style

IDEF1X style


Barker style

Examples
Following are examples of ERD diagrams made in each system:


Conceptual, logical and physical data models
ER models and data models are typically drawn at up to three levels of detail:
- Conceptual data model: The highest-level view containing the least detail. Its value is showing overall scope of the model and portraying the system architecture. For a system of smaller scope, it may not be necessary to draw. Instead, start with the logical model.
- Logical data model: Contains more detail than a conceptual model. More detailed operational and transactional entities are now defined. The logical model is independent of the technology in which it will be implemented.
- Physical data model: One or more physical models may be developed from each logical model. The physical models must show enough technology detail to produce and implement the actual database.
Note that similar detail and scope levels exist in other types of diagrams, such as data flow diagrams, but that it contrasts with software engineering’s three schema approach, which divides the information a bit differently. Sometimes, engineers will branch out ER diagrams with additional hierarchies to add necessary information levels for database design. For example, they may add groupings by extending up with superclasses and down with subclasses.
Limitations of ER diagrams and models
While they have many advantages, there are some limitations to ER diagrams:
- Only for relational data: Understand that the purpose is to show relationships. ER diagrams show only that relational structure.
- Not for unstructured data: Unless the data is cleanly delineated into different fields, rows or columns, ER diagrams are probably of limited use. The same is true of semi-structured data, because only some of the data will be useful.
- Difficulty integrating with an existing database: Using ER models to integrate with an existing database can be a challenge because of the different architectures.
How to draw a basic ER diagram
Use the following tips on how to create an ERD:
- Purpose and scope: Define the purpose and scope of what you’re analyzing or modeling.
- Entities: Identify the entities that are involved. When you’re ready, start drawing them in rectangles (or your system’s choice of shape) and labeling them as nouns.
- Relationships: Determine how the entities are all related. Draw lines between them to signify the relationships and label them. Some entities may not be related, and that’s fine. In different notation systems, the relationship could be labeled in a diamond, another rectangle, or directly on top of the connecting line.
- Attributes: Layer in more detail by adding key attributes of entities. Attributes are often shown as ovals.
- Cardinality: Show whether the relationship is 1-1, 1-many, or many-to-many.
More tips for ER diagrams
ER diagrams are powerful tools, but they can get complicated fast. Use these ERD tips to make your diagrams clean, clear, and effective.
- Show the level of detail necessary for your purpose. You might want to draw a conceptual, logical, or physical model, depending on the detail needed. (See above for descriptions of those levels.)
- Watch for redundant entities or relationships.
- If you’re troubleshooting a database problem, watch for holes in relationships or missing entities or attributes.
- Make sure all your entities and relationships are labeled.
- You can translate relational tables and ER diagrams back and forth, if that helps you achieve your goal.
- Make sure the ER diagram supports all the data you need to store.
- There may be different valid approaches to an ER diagram. As long as it provides the necessary information for its scope and purpose, it’s good.
Now it's time to take what you've learned and start creating and collaborating. Lucidchart lets you easily create ER diagrams with smooth placement of shapes, lines, and labels. With real-time updates, it’s easy to share and collaborate with colleagues while keeping a record of progress.