In every business, a lot of processes are in motion every day, and some of them haven’t been changed for years. They have worked the same way since you were hired, and they’ll probably remain the same when you leave the company. But here’s something to keep in mind: Ineffective workflows might ruin your team’s productivity and cost your company a lot of money. And they often keep getting worse over time. So it’s time to take action.
But how should you approach the improvement of your workflows? Quite simple. Choose a suitable workflow, and conduct an analysis. You’ll only be able to improve the strengths and weaknesses of your processes if you understand them.
What is a workflow analysis?
A workflow analysis is a review of all subprocesses related to a specific operation. It can include plans to eliminate the inefficiencies and optimize the subprocesses.
If your workflow operates smoothly after you have analyzed and optimized it, you might want to think about automation. If you want to automate the workflow, you need to conduct another workflow analysis, with the goal of automating the processes in mind. The steps remain the same; only the objective changes.
To summarize, a workflow analysis has three main goals:
- Document and depict a workflow.
- Improve a weak workflow.
- Automate a strong workflow.
The 4 steps of a workflow analysis
Based on a simple example, I’ll show you how to conduct a workflow analysis. Let’s say you’re working with an external service provider: an advertising agency. From the time they started creating a video for you, you’ve had the feeling that the project isn’t moving forward, and your usual processes are unnecessarily slowing your progress down. Now let’s dive into the workflow and see what you can improve.
1. Understanding and documenting the workflow
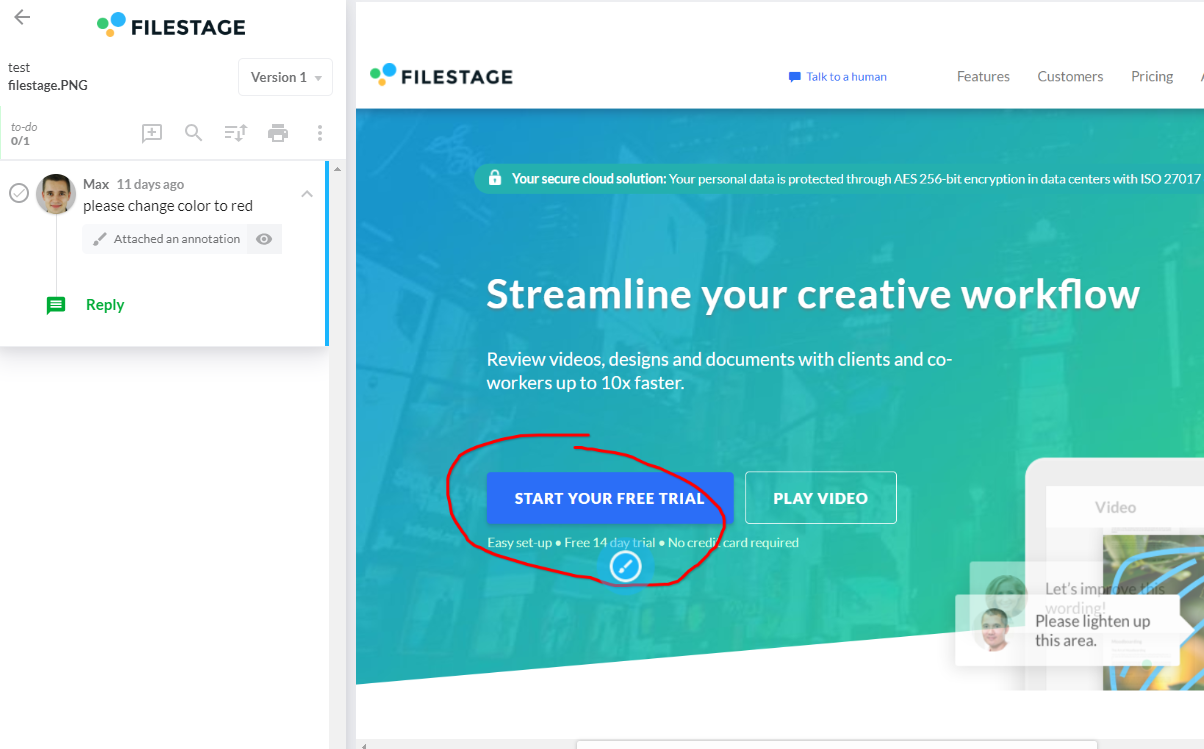
First, focus on fully understanding the workflow and its subprocesses. In the example, the agency is intensely working on the video, and though the first drafts have been great, you have some change requests that need to be applied. You’re sending emails daily to explain how the video should be adjusted, and these emails create a lot of time-consuming back and forth.

You’ve decided to optimize this workflow so the agency implements the changes without you spending as much time writing emails. To start, you need to ask yourself the following questions:
What’s the result of the workflow?
In the example, the result is to approve a deliverable: a video produced by the agency.
What are the subprocesses of the workflow?
In our example, you would use the following steps:
- You review the video and find an issue.
- You define the change request in detail.
- You send the change request to the agency.
- The agency receives the change request.
- The agency has feedback and questions about the change request. (This step is optional.)
- The agency starts directly applying the changes.
- The agency sends over the new version of the video.
- You discover another issue (that would result in a new, optional loop).
- You approve the video.
(I recommend using software like Lucidchart to depict this kind of workflow.)
Do problems occur? If yes, which ones?
You send too many emails to deal with small changes. This issue is negatively affecting your productivity, as it requires too much time and money.
Which subprocesses are causing problems?
In our example, some processes (such as defining the change request and getting feedback from the agency) result in a lot of back and forth.
Talk to other people involved in the process—as you record their feedback, you will build a better understanding of the workflow.
2. Collecting data
Now that you understand the workflow and its potential problems, you should gather more information about the subprocesses and learn why the issue is occurring (and what impact it has). You should collect two types of data to improve the workflow:
- Quantitative data: Numbers that clearly stress negative effects of the workflow and room for improvement.
- Qualitative data: Facts that improve your understanding of the problem and allow you to dig deeper.
Quantitative data
The way you gather quantitative data depends largely on the workflow you want to optimize, but you can start by asking these five questions:
- What is the average maximum amount of time needed for each subprocess? What about the minimum?
- Which subprocesses have the highest difference between the minimum and maximum time that’s needed for completion?
- How often is a subprocess conducted each day, month, and year?
- Are there any unnecessary delays between subprocesses? If so, how many? And how much wait time do they produce each day, month, and year?
- What is the average maximum amount of time needed to review a deliverable (such as a video)? And what is the minimum?
Let’s assume the following data for our example:
-
You review the video and find an issue.
[avg: 15 | min: 5 min | max: 25 min]
-
You define the change request in detail.
[avg: 35 min | min: 10 min | max: 60 min]
-
You send the change request to the agency.
[avg: 3 min | min: 1 min | max: 5 min]
-
The agency receives the change request.
[avg: 15 min | min: 5 min | max: 25 min]
-
The agency has feedback/questions about the change request (optional).
[avg: 65 min | min: 10 min | max: 120 min]
-
The agency starts directly applying the changes.
[avg: 165 min | min: 30 min | max: 300 min]
-
The agency sends over the new version of the video.
[avg: 15 min | min: 5 min | max: 25 min]
-
You discover another issue. (New loop, optional)
[avg: 15 min | min: 5 min| max: 15 min]
-
You approve the video.
[avg: 15 min | min: 5 min | max: 25 min]
On average, the workflow review is conducted three times per video, which results in a total of 1,029 minutes (17 hours).
Qualitative data
Qualitative data can help you get a better understanding of the whole workflow and detect the root of the problem. In addition, it will help you support and validate your quantitative findings.
To gather this kind of information, talk to other people that are involved in the process. Ask them (and yourself) the following questions:
- Is one of the subprocesses a bottleneck?
- Can you remove any of the subprocesses without (heavily) affecting the results of the workflow?
- What’s the impact of each subprocess on the workflow’s outcome?
- Which subprocesses have the highest impact? Can you improve them?
- Does the workflow contain subprocesses that result in frustration?
- Is it possible to improve the subprocesses that cause delays?
- Which subprocesses are the most expensive? Is it possible to improve them?
As you answer all of these questions in our sample case, you realize that:
- In Step 2 (defining the change request), there is a huge difference between the minimum and maximum time needed, and this step results in frustration since it’s difficult to describe the changes that are needed for dynamic content (such as video).
- Step 5 (agency delivering feedback about the change request) requires a lot of time if a change request isn’t clearly defined.
- Step 8 (discovering another issue) causes a new workflow loop and could multiply the costs of the workflow.
3. Analyzing the data
After collecting the information, you’ll need to merge the quantitative and qualitative findings to analyze the given data. As you merge this data, notate the subprocesses that cause delays or result in a (relatively) high cost or time exposure. These subprocesses probably need to be improved for one of these reasons:
- They have a high impact on the workflow’s outcome, which means you should try reducing the costs they incur.
- They have a low impact on the workflow’s outcome, which means you should consider removing them.
In our example, you should improve these subprocesses:
- Define the change request in Step 2 in detail.
- Reply to the agency’s feedback and questions about the change request in Step 5.
4. Deriving possible workflow improvements
After you’ve selected the subprocesses you need to improve, it’s time to take action. Together with your team, brainstorm different ways to make improvements. While gathering ideas, you should focus on each idea’s feasibility and relevance.
You can create a spreadsheet and rate your ideas (on a scale from 0 to 10) based on these factors:
- How much would this idea impact the workflow’s outcome? (A 10 stands for a high impact.)
- How confident are you about the impact? (10 is very confident.)
- How easy is it to realize this idea? (10 is very easy.)
Calculate an ICE score by using this formula: (Impact + Confidence + Ease) / 3. The ICE score will tell you the specific potential of each idea. Prioritize ideas that have the highest score.
Back to our example. After brainstorming for a few hours, you might come up with these ideas to improve your sample workflow:
- Only allow two review loops.
- Use software to improve the reviewed workflow.
- Use email templates to write and send messages.

After rating the ideas, you decide to start using a new type of software to improve the reviewed workflow.
You have a confidence score of 8, which means that you’re sure that this improved workflow can:
- Reduce frustration and decrease the average time needed for Step 2 (defining the change request) [Improvement (avg. time): 35 min → 10 min]
- Improve the quality and clarity of change requests, which reduces the time needed for Step 5 (agency delivering feedback about change request). [Improvement (avg. time): 65 min → 10 min]
- Improve the overview of the review process, reducing the probability of Step 8 (discovering another issue), which would cause a new workflow loop. [Improvement: 3 loops → 2 loops]
By completing this process, you can reduce the total amount of time needed to complete the revised workflow from 1,029 minutes to 526 minutes, which will save you almost 50% of the time needed to produce each video review. That’s what I call an increase in productivity!
Conclusion
A workflow analysis isn’t a sexy topic, but workflows that aren’t performing well can significantly harm your team’s productivity. So to find the root of a workflow’s problem, you should begin this analysis. To get started, use our step-by-step guide and try visualizing your workflows in Lucidchart.