Lucidscale

Automatically visualize your cloud with Lucidscale

Lucid Content

Reading time: about 9 min

Topics:

  • IT and Engineering
  • Lucidchart tips

The benefits of moving to the cloud and having increased flexibility and scalability make it difficult to keep diagrams up to date, especially given that cloud environments are often complex and frequently changing. The ability to maintain accurate documentation was practically impossible—until now, with the help of Lucidscale, a new cloud visualization solution by Lucid.

What is Lucidscale?

Lucidscale makes it easy to automatically visualize your architecture so your organization can better understand, optimize, and govern the cloud through accurate, up-to-date, and interactive diagrams that are consistent across your organization.

Who benefits from Lucidscale?

Keeping cloud architecture diagrams up-to-date is a difficult task. Lucidscale make it fast and easy to maintain accurate diagrams, without the hassle of manual work. 

“It’s essential that everyone on our team has up-to-date visibility into the networks,” said Toby Foss at Informatica. “Lucidscale allows us to get everyone on the same page by replacing static drawings with up-to-date diagrams of our existing systems.”

Lucidscale can benefit:

  • Infrastructure engineers during incident response
  • Architects communicating their ideas with other teams
  • Security leads verifying what their environment looks like
  • Any stakeholder looking for a simple overview of the architecture or network
  • DevOps teams ensuring alignment between remote teams
  • Consultants and managed service providers who need to quickly understand a client’s environment before providing recommendations and making changes

Benefits of Lucidscale

Lucidscale removes complex manual work from the cloud visualization process. What may take an architect days or even weeks to create, Lucidscale can do in minutes.

The benefits of using Lucidscale include:

  • Automatically visualizing your cloud infrastructure
  • Clearly communicating to all stakeholders
  • Quickly drilling into information that matters most
  • Visualizing key cloud governance data
  • Easily maintaining cloud architecture diagrams

Keep reading to explore these benefits and how Lucidscale actually works.

Automatically visualize your cloud infrastructure

Lucidscale empowers users to automatically visualize their cloud infrastructure in just a few clicks. You can connect to and import from Amazon Web Services (AWS) with a direct API connection. To support multiple cloud sources, Lucidchart will soon offer support for Microsoft Azure and Google Cloud Platform (GCP).

automatically visualize cloud architecture
Automatically visualize your cloud architecture in just a few clicks

All you need to do is connect your Lucidscale account to your cloud environment through third-party access. From there, Lucidscale generates a diagram of your infrastructure, organized by cloud, region, all the way down to the instance or other resources. 

Drill into the information that matters most

Architecture diagrams are often large, comprised of hundreds—and possibly thousands—of components, traditionally making them overwhelming to look at and extract insights from—but not with Lucidscale, which allows you to filter information so you can view the information that matters most.

As Lucidscale automatically generates your cloud diagrams, it is backed by metadata brought in from your cloud provider, allowing you to visualize your cloud from multiple views. Lucidscale comes with standard views so you can see infrastructure through network rules, or as an overview of accounts, regions, and VPCs. For example, this can help security leads quickly view VPC peering connections to ensure they are set up correctly.

filter cloud architecture
Filter your cloud architecture diagram to create a unique view

You can also create tailored views to share with a development team that is concerned with only one application, or the leadership team that really only wants a high-level overview.

Try these options to customize your view:

  • Filter: Remove unnecessary details, filter by criteria, such as AWS tags, VPCs, subnets, and more.
  • Change your layout: Group resources within a container by type, adjust the number of columns that shapes within a container are arranged in or adjust the order for resources to appear.
  • Visualize relationships: Draw lines based on relationships between resources.

You can save your views for future use, including your layout changes. This way, when you refresh your data in the future, you can quickly jump back into the view without needing to reconfigure your layout again. 

Visualize key cloud governance data

Visualizing your cloud governance data in the context of your architecture diagram allows organizations to spot check and enforce internal best practices. With a few simple clicks, you can visualize your metadata to better understand your diagram.

It’s easy to see the metadata brought into Lucidchart from your cloud provider, including instance name, security groups, IP address, and more, so you don't need to toggle back and forth between your diagram and cloud console or code. You can also add this metadata to your diagram as labels.

visualize cloud governance data
Visualize your key cloud governance data in the context of your cloud architecture diagram

Take it one step further and leverage the metadata to apply conditional formatting rules to flag resources that fit certain criteria. For example, if a database is not encrypted, or if an instance is missing a tag.

Communicate clearly with all stakeholders

Being able to communicate complex systems with all stakeholders is critical, whether the communication is between team members, incident response teams, development teams, or leadership. 

cloud architecture communication
Share links to your cloud architecture with teams and stakeholders

While Lucidscale is packed with advanced functionality that improves communication, this add-on is built on Lucidchart. Meaning, the power of collaborating on visuals is at the foundation of Lucidscale, and you can use those visuals to facilitate communication and understanding, especially while diving into complex systems with others. 

Leverage all the existing collaboration and communication features currently built into our visual workspace:

  • Show specific parts of the diagram using presentation mode.
  • Share the diagram with others, assigning different levels of permissions.
  • Comment and @mention users on specific shapes to focus attention and take action where it’s needed.

Easily maintain cloud architecture diagrams

Keeping cloud architecture diagrams up to date is no longer a difficult task. All you need to do is refresh the data backing your diagram and any changes will be reflected in your visuals and anywhere else, such as your Confluence wiki pages. 

By creating and updating your architecture diagrams with Lucidscale, your teams can access these up-to-date diagrams from anywhere, on any device.

maintain cloud architecture diagrams
Simply refresh your data to keep cloud architecture diagrams up to date

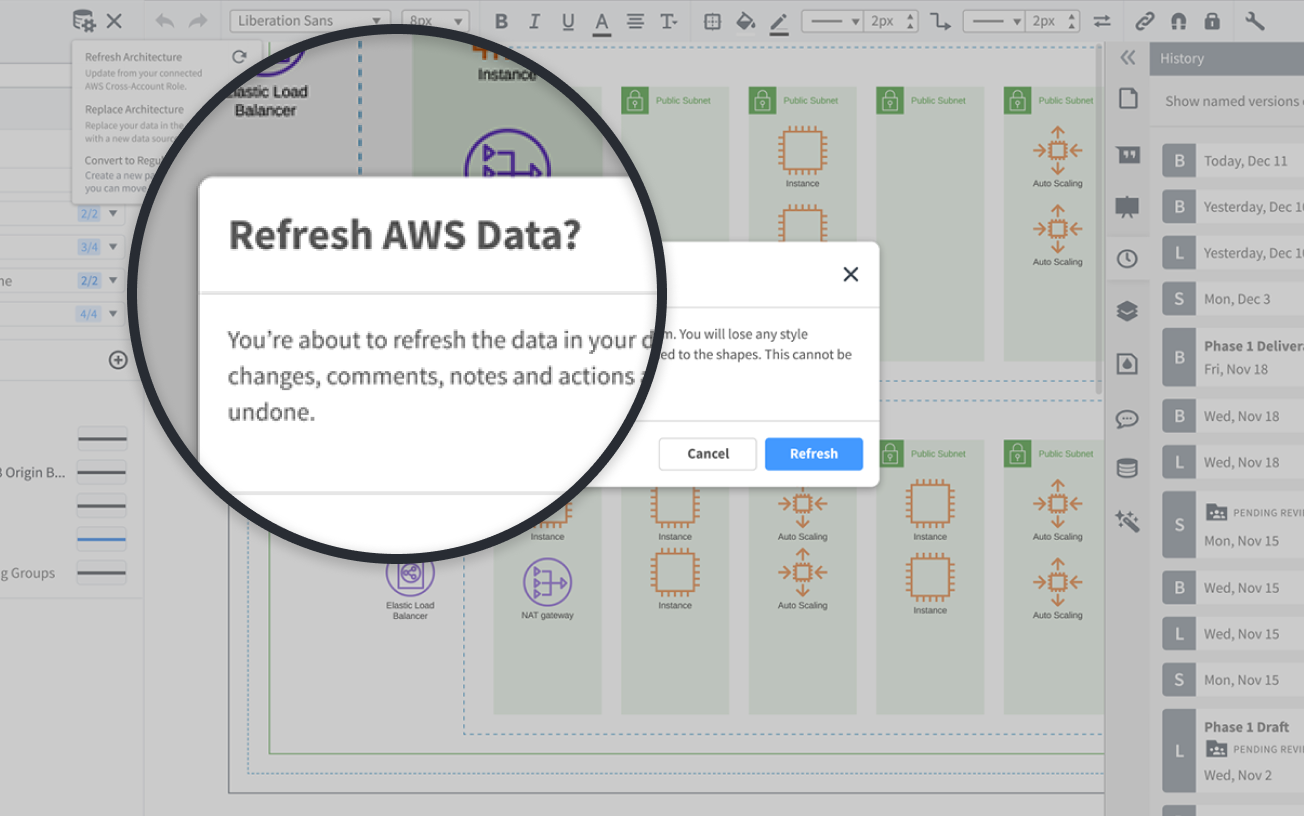
Now you can rest easy knowing your teams are working with an accurate depiction of your environment. You can even easily look back to see how your infrastructure changes over time with our revision history feature. 

What can you do with Lucidscale?

Lucidscale was built to address multiple challenges that cloud architects and engineers have. With Lucidscale, you can:

  • Understand your infrastructure quicker.
  • Resolve incidents faster.
  • Confirm cloud migration or implementation was done correctly.
  • Review the security and compliance of architecture.

Understanding your infrastructure quicker

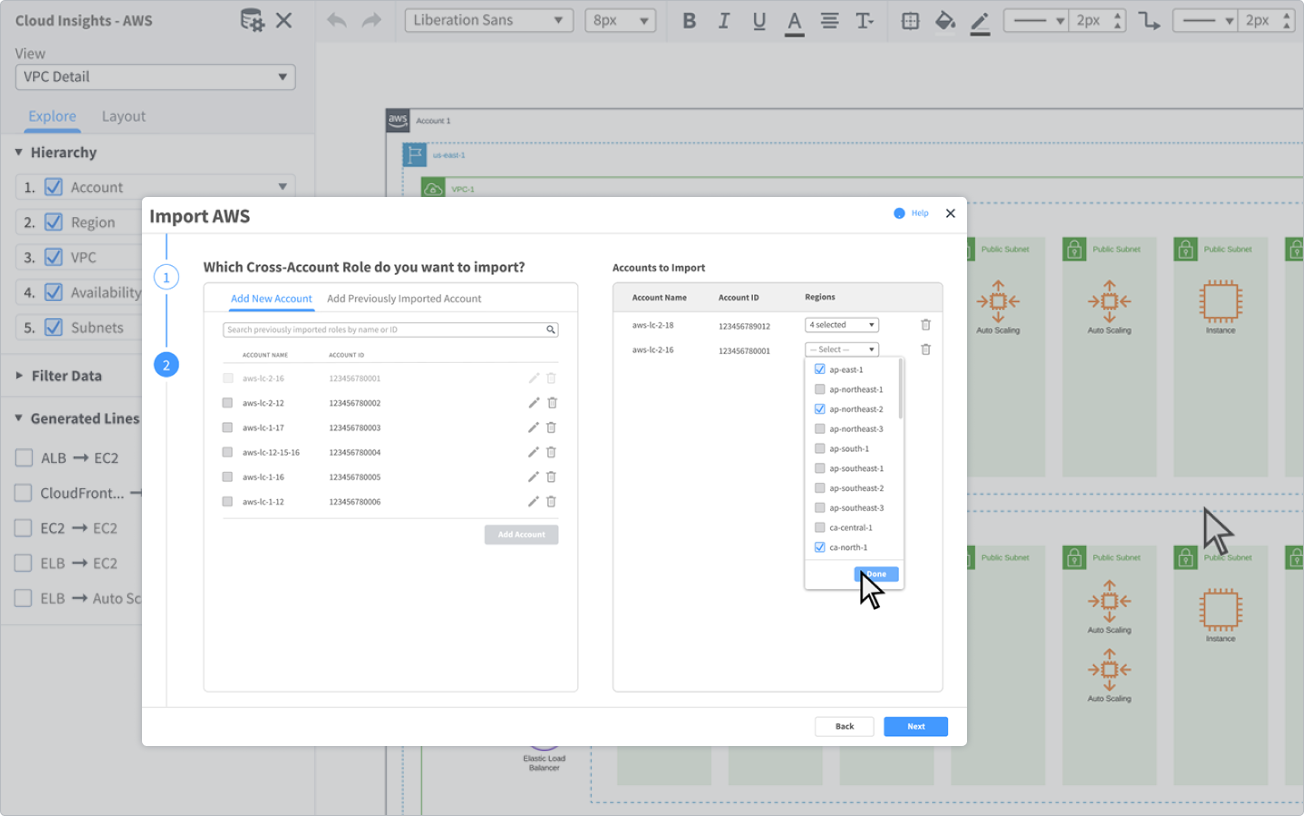
When you automatically create architecture diagrams with Lucidscale, you can quickly extract insights to make smarter cloud decisions. Within a few clicks and minutes, you can: 

  • Understand your current infrastructure, so you can plan a vision for the future.
  • Be aware of current limitations, ensuring what you develop and deploy will work with what exists today. 
  • Onboard new team members without relying on tribal knowledge or digging through code and consoles.
  • Validate that what actually exists aligns with what you think exists.
  • Ensure your diagrams are available and accessible from anywhere.

Lucidscale mitigates the risks and worries of blind spots, tribal knowledge employees leaving your company, or essential information being out of date and inaccessible to those who need it.

Resolve incidents faster

When an outage happens, using a visual to work off of can significantly reduce downtime. When accurately and constantly kept up to date, network diagrams are a single source of truth to reference and explain when an issue arises. However, the problem is, up-to-date diagrams are often not available or accessible when something goes wrong. 

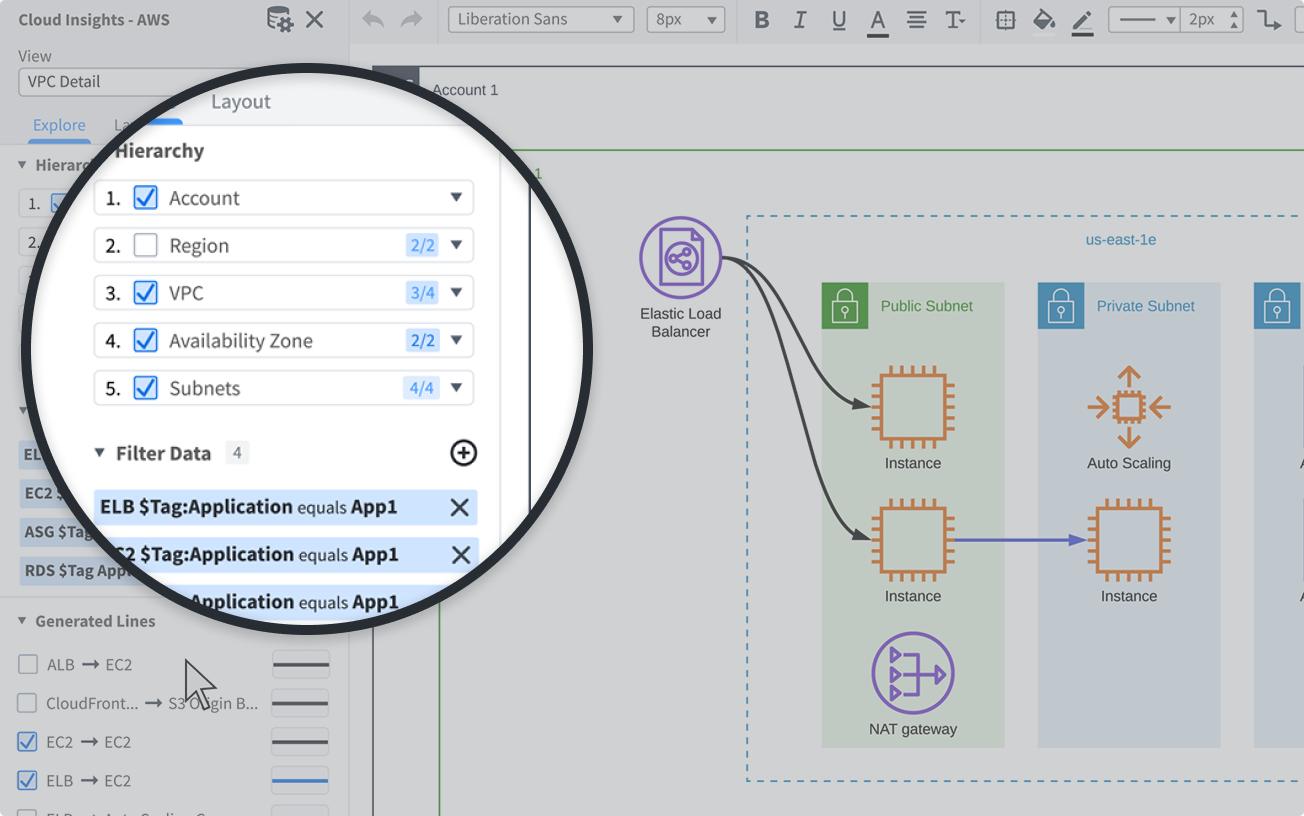
Lucidscale makes it easy to keep your architecture diagrams up to date and centralized, so teams can:

  • Determine where a problem is occurring.
  • Identify what the issue is.
  • Understand why a problem is occurring.
  • Understand how the associated systems are connected.
  • Decide what to communicate to involved or affected teams.

Confirm cloud migration or implementation was done correctly

Deploying something into the cloud often passes through many hands, and you hope plans are not lost in translation. For example, architecture can be designed by a cloud architect, reviewed by security teams, passed to an infrastructure engineer to write infrastructure as code, and potentially pass through more employees or teams for quality assurance. 

Lucidscale helps you tackle two very important tasks during implementation:

  • Verifying that migration and implementation was done correctly.
  • Understanding why migration and implementation were not done correctly, if that happens.

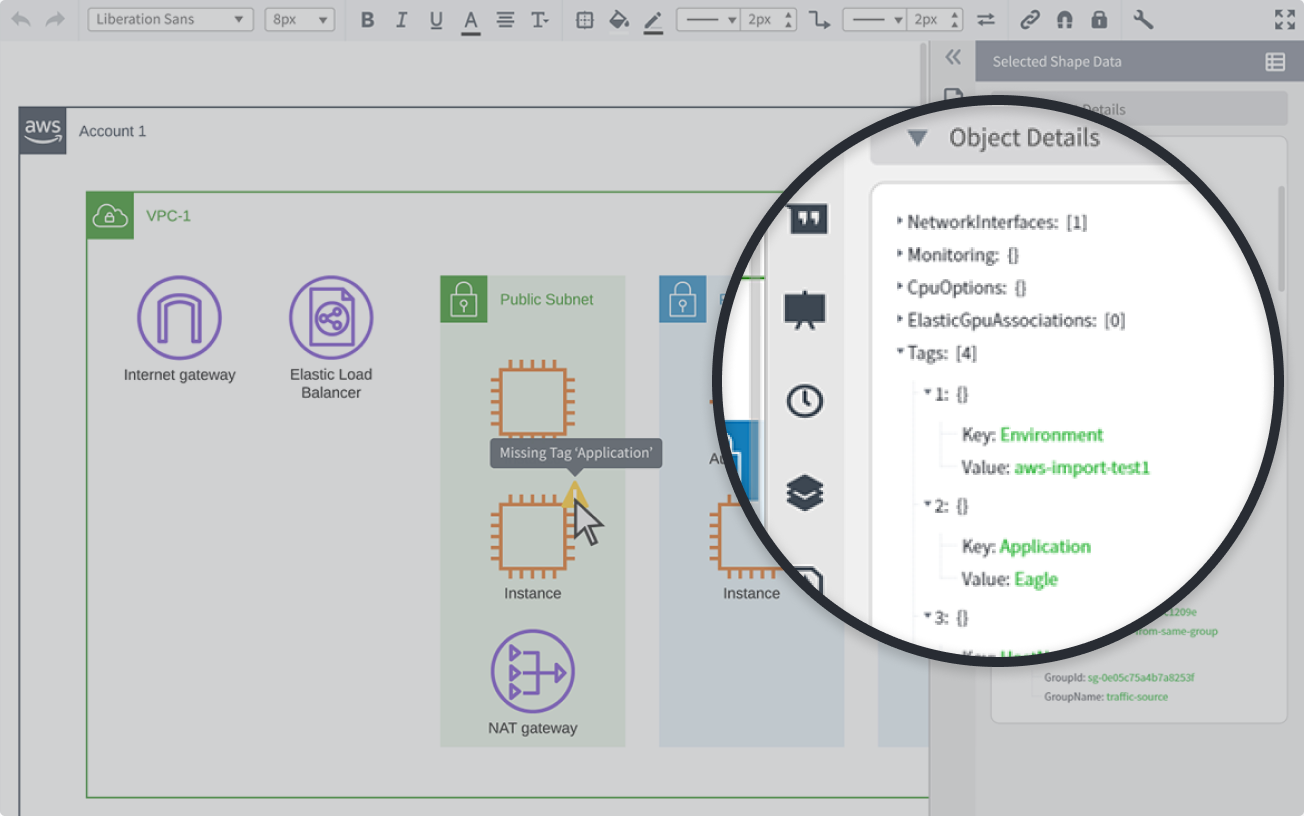
Essentially, Lucidscale helps you quickly cross-check plans with what your engineers actually build. Compare your “blueprint” diagram with your current state diagrams—if the diagrams are not identical, you can direct stakeholders to the exact location of misalignment and prompt conversations about: 

  • Potential engineering mistakes that need to be corrected.
  • Possible technical limitations in the architect's design that may alter implementation.

In either case, Lucidscale helps you align your teams and effectively communicate as you plan and build your cloud vision. And long-term, you can stay on top of any changes that happen to your infrastructure, so when you’re ready to make a change or addition, it can be done with an accurate starting point

Review the security and compliance of architecture

Most IT initiatives involve security and compliance, with special consideration involving the cloud, undeniably meaning a handful of tasks that can take days or even weeks to complete. 

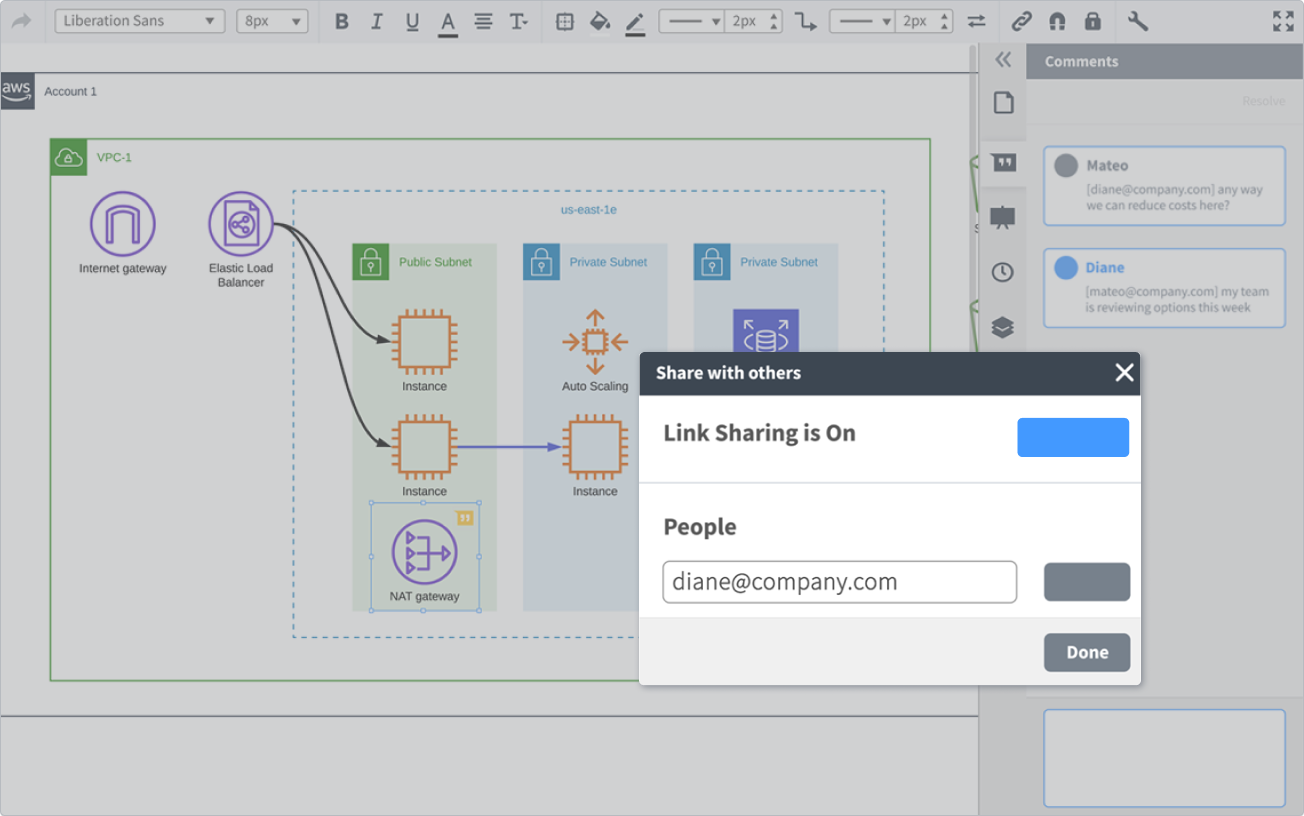
Meanwhile, Lucidscale helps you tackle these lengthy tasks in just minutes, whether you need to visually cross-check your infrastructure set up, or respond to a compliance audit:

  • Security: Gain visibility into what exists so you can uncover potential risks and threats.
  • Compliance: Maintain and prove compliance during audits and certifications by submitting an up-to-date network diagram as evidence.

When you automatically diagram your cloud architecture, you can put manual work aside and instead focus on optimizing cloud architecture and performance and fulfilling your company’s cloud initiatives.

Think Lucidscale can help your organization visualize, understand, and optimize your cloud?

Get started

Lucidchart

Lucidchart, a cloud-based intelligent diagramming application, is a core component of Lucid Software's Visual Collaboration Suite. This intuitive, cloud-based solution empowers teams to collaborate in real-time to build flowcharts, mockups, UML diagrams, customer journey maps, and more. Lucidchart propels teams forward to build the future faster. Lucid is proud to serve top businesses around the world, including customers such as Google, GE, and NBC Universal, and 99% of the Fortune 500. Lucid partners with industry leaders, including Google, Atlassian, and Microsoft. Since its founding, Lucid has received numerous awards for its products, business, and workplace culture. For more information, visit lucidchart.com.

Bring your bright ideas to life.

Sign up free

or continue with

Sign in with GoogleSign inSign in with MicrosoftSign inSign in with SlackSign in

Get started

  • Pricing
  • Individual
  • Team
  • Enterprise
  • Contact sales
PrivacyLegal

© 2024 Lucid Software Inc.