Lucidchart for Agile methodology

Using Lucidchart for Agile methodology

Lucid Content

Reading time: about 7 min

Topics:

  • Lucidchart tips
  • Project management

The Agile methodology was born out of a need for a more adaptable and, well, Agile style of project management amongst software developers. Today, it’s a widely utilized means of maintaining efficiency and innovation throughout the project lifecycle. 

Agile methodology focuses on incremental work completed simultaneously across teams, with checkpoints that allow teams to connect and change direction if needed. When applied across your organization—and not just your dev teams—it can drive your company towards faster, more experimental, and more collaborative production methods, usually with higher quality results. 

Regardless of how your organization chooses to apply the Agile methodology, Lucidchart can help keep teams on the same page at each stage of a project. Whether you’re gathering requirements in the ideation stage or dividing responsibilities between scrum teams spanning multiple departments, Lucidchart can provide much needed visual clarity, as well as collaborative tools that facilitate frequent communication.

To break it down a bit further, we’ve mapped out how you can use Lucidchart to roll out the Agile methodology in three main categories across your organization: people, process, and systems.

People

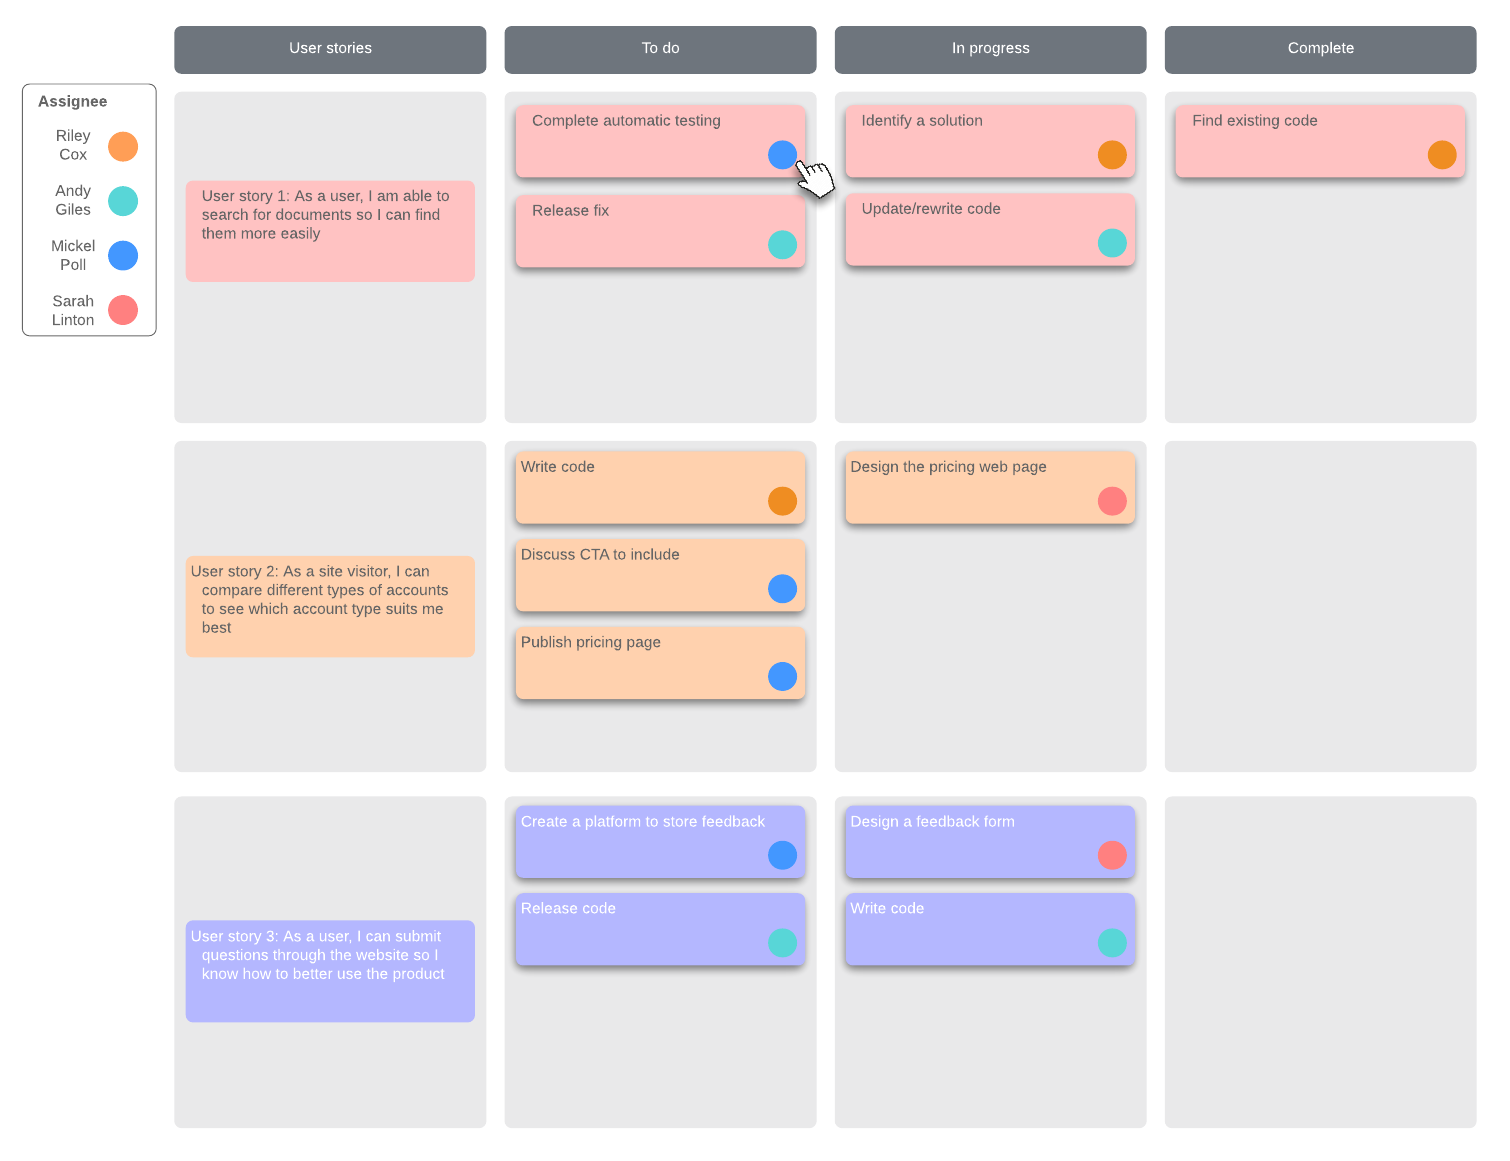
At its core, the Agile methodology is comprised of small teams working both independently and together to complete a goal. While traditional Agile methodology primarily involves developers grouped into scrum teams, your organization’s scrum teams or tiger teams can consist of any specialized group of employees. Collaboration between the right employees is crucial to an Agile mindset, so product managers (PM), product marketing managers (PMM), and key business stakeholders should be included throughout any project lifecycle, and you may need to include other teams, too. 

For example, if your company is preparing for a go-to-market launch, in addition to your dev teams, PMs, and PMMs, you might also need web developers, designers, copywriters, and your public relations employees on a tiger team of their own with their own sprint lists. 

As you apply the Agile methodology to your organization, remember that individuals and interactions take precedence over processes and tools. At first glance, this might seem counterintuitive to a project management ideology. However, frequent and supportive interactions between teams can provide individuals with a deeper understanding of their impact on a project and an organization as a whole, which can lead to a collective improvement in efficiency and quality. 

Use Lucidchart to drive individuals, teams, and your organization

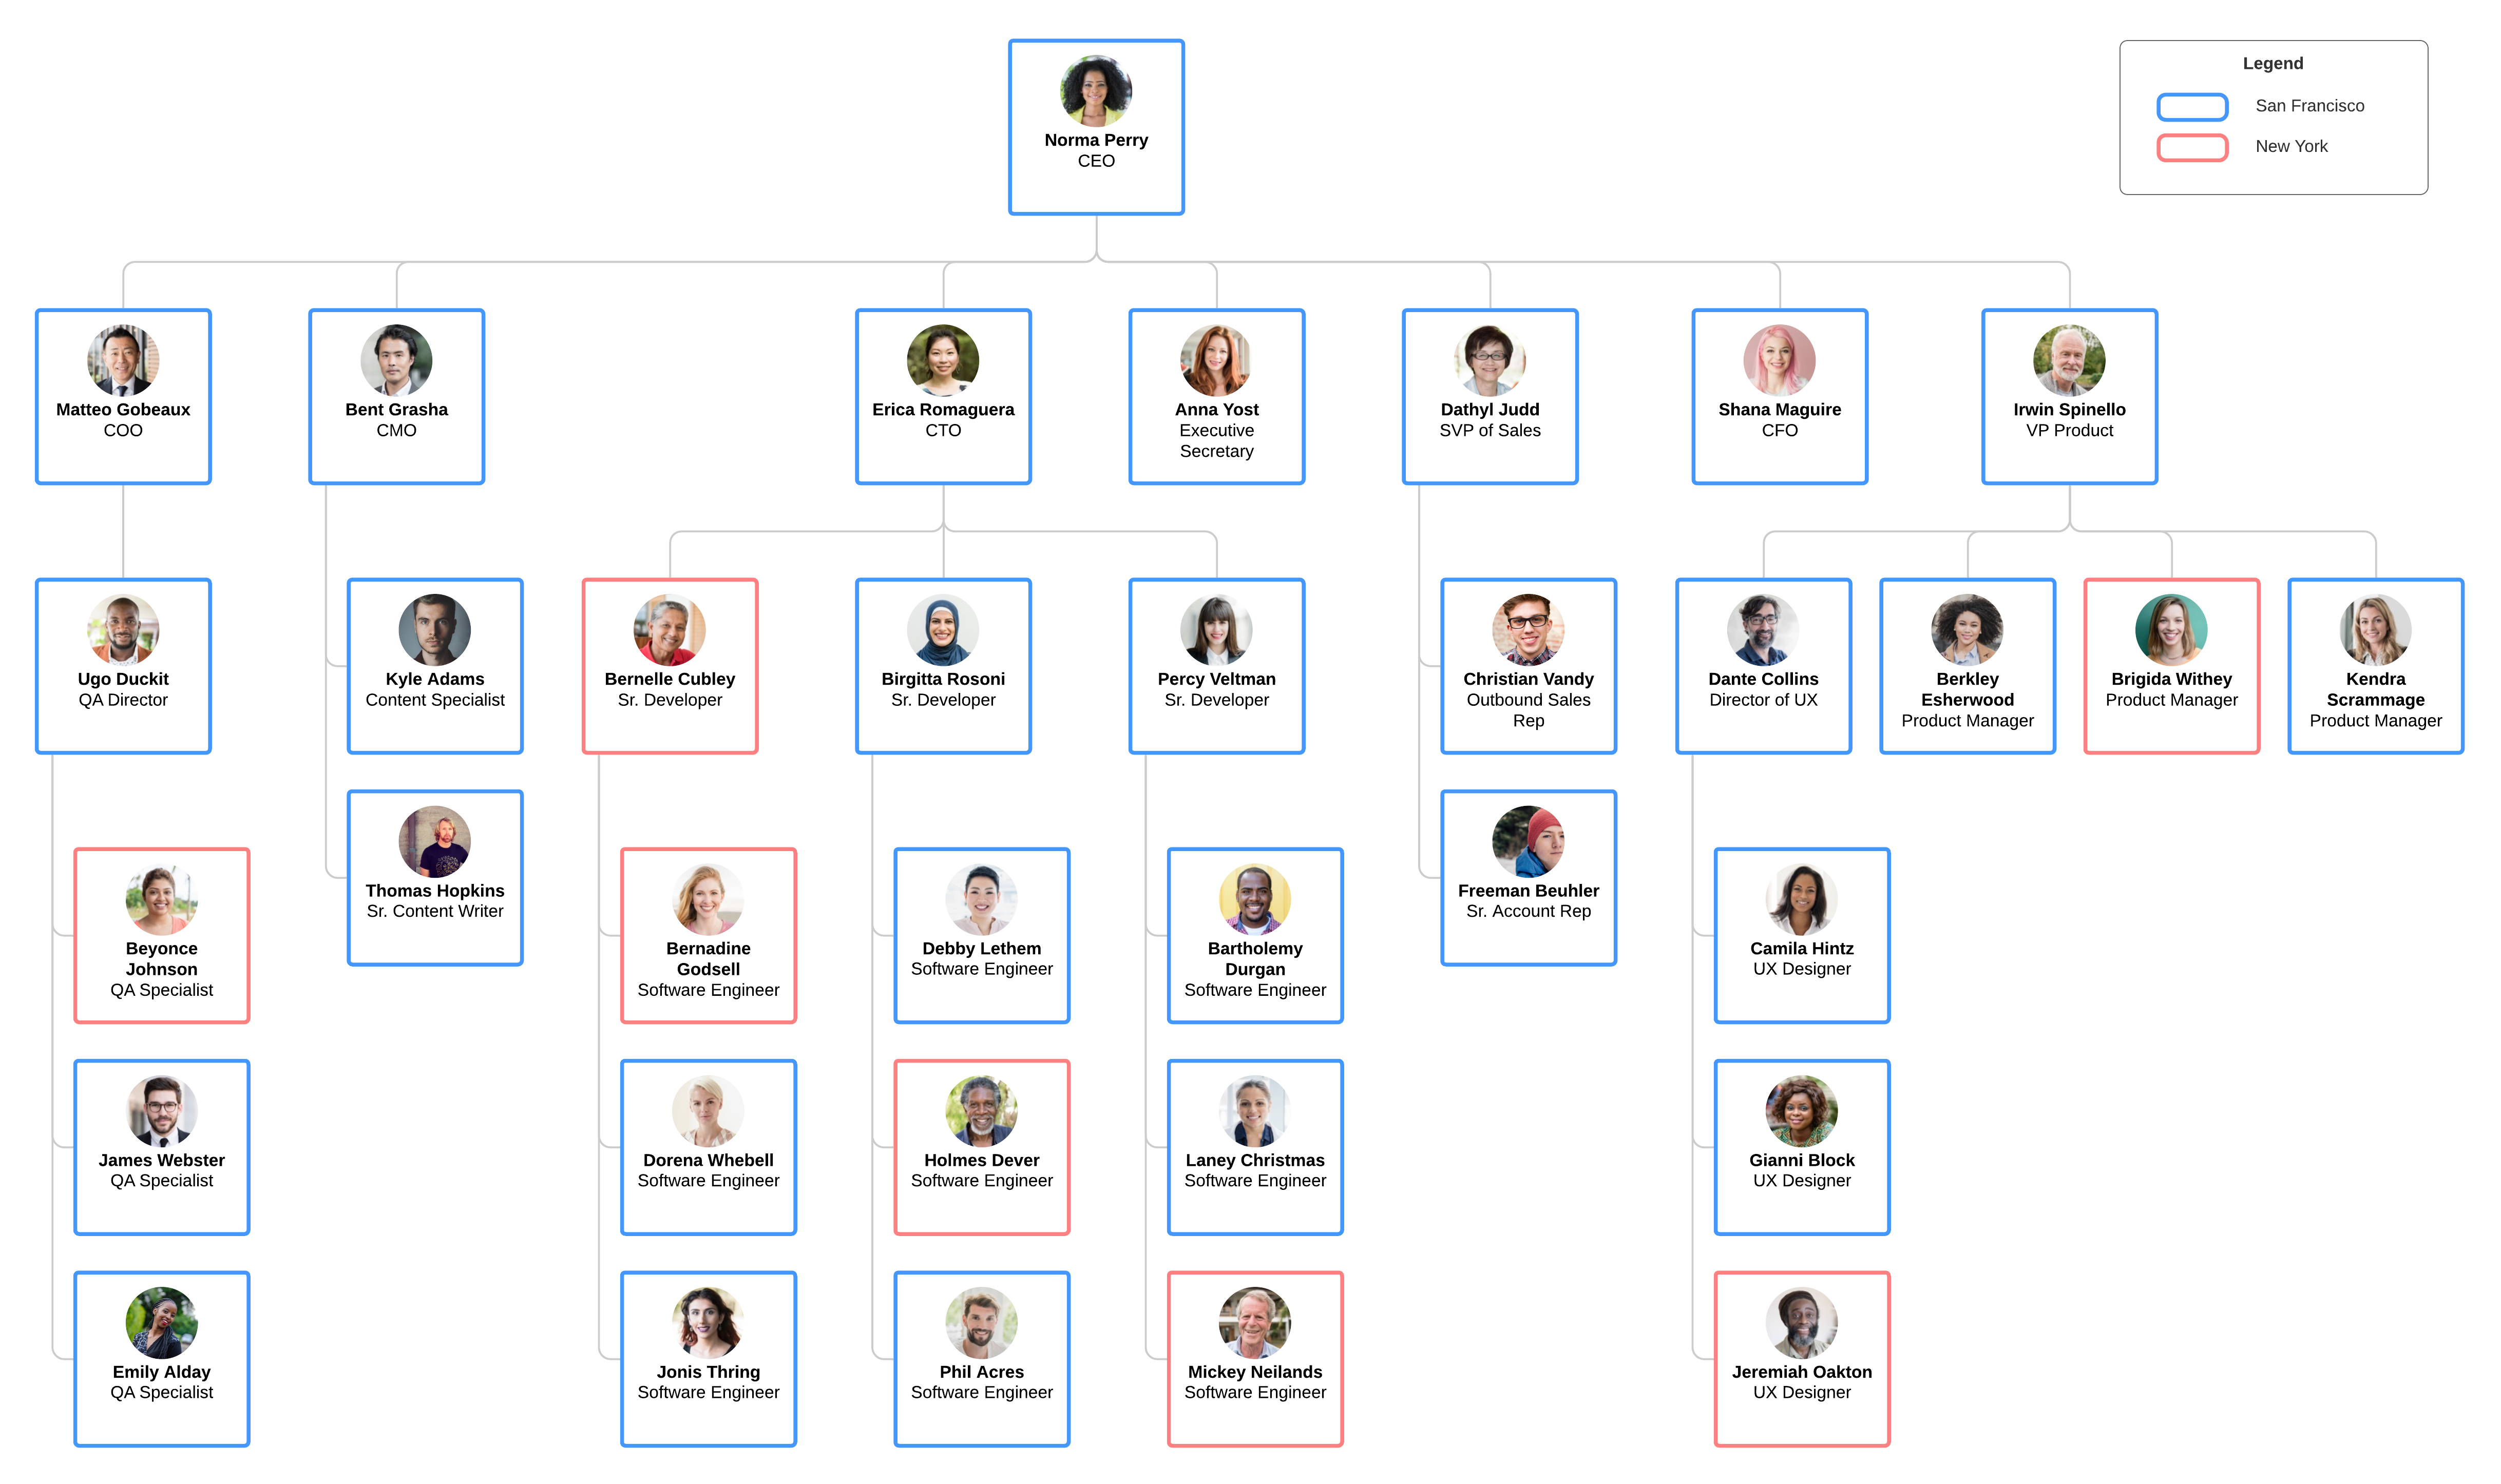
Lucidchart can help you optimize your organization with detailed and up-to-date org charts and project documents. As you begin any project planning process, use group view to segment employees according to title, team, location, or other criteria.

Drag and drop unassigned employees into teams to create a visual representation of your organization. This way, as you move forward with new projects, everyone involved will know exactly who else will be working on the project and who to reach out to with questions. With editor vs. view-only access control, you can ensure that every employee has access to the information they need without worrying about unauthorized edits. 

org chart example
Click to try out our org chart import for yourself

Process

While traditional project management relies on a hard-and-fast deadline with carefully tracked deliverables, Agile methodology emphasizes the ability to respond and adapt to customer feedback, new ideas, and other changes. 

An Agile process approach requires check-ins across your organization where teams can communicate feedback, discuss project cadence and/or pace, and confirm project scope moving forward. Collaboration should be frequent and include input from key players like business stakeholders and developers to ensure that all parties are confidently on the same page throughout each stage of your project.

The incorporation of customer testing and feedback is crucial to Agile methodology and should act as a driving force throughout the collaborative process. With frequent collaboration, your team can respond to and improve upon inefficiencies or problems with product functionality or project progress as they arise, rather than after a product has been released or during project postmortems.

Transform your Agile workflow with Lucidchart

Lucidchart provides teams with the ideal workspace for process improvement. Regardless of which type of Agile methodology you’ve chosen to implement, clearly appointed visuals can help your team visualize project requirements and workflows, no matter how complex they might be. 

Planning long-term objectives or individual sprints is simple with customized Kanban boards, Gantt charts (or our Gantt chart alternatives), swimlanes, and timelines in Lucidchart. Clear diagrams tailored to your project’s needs help your team identify weaknesses and bottlenecks, prioritize tasks based on importance or urgency, and divide responsibilities amongst teams and individuals. 

Detailed Scrum Task Board Example
Click to try out this scrum board example

Lucidchart’s collaborative functionality effortlessly facilitates the frequent communication that Agile methodology requires, especially when reviewing multiple processes for a single project. Use our in-editor presentation mode to create interactive presentations that allow you to convey overall project goals and timelines and then clarify and dig into more granular areas of your project. You can also share your project management visuals as living documents that your team can access, edit, and comment on from any device. Your scrum teams will never have to scour email or Slack threads, searching for project details, and instead can rely on comprehensive project visuals. 

Systems

Within the framework of Agile methodology, working software takes precedence over comprehensive documentation. With Lucidchart, however, it’s easy to have the best of both worlds—you don’t have to sacrifice good documentation to reap the benefits of Agile. 

The Agile methodology dictates that frequent delivery of a working product is considered the primary measure of success. In terms of org-wide Agile, this may simply look like a successfully completed project but could range from successful cloud migration to a dynamic website with no bugs. We believe that comprehensive documentation throughout your project lifecycle can help teams and organizations work more efficiently and cohesively, actually pushing projects increments through quickly because of documentation, not despite it.

The benefits of comprehensive documentation include:

  • Clear visual outlines of existing systems to ensure compatibility with future plans
  • A shared vision of project goals that scrum teams, project managers, and stakeholders can reference
  • Increased transparency and unification across teams and departments
  • An up-to-date understanding of current user and data flows, infrastructure, product architecture, and more

Most importantly, comprehensive documentation provides teams with an opportunity to regularly reflect on where they’ve been, the progress they’ve made, and what more needs to be done. By reflecting on your progress, your team can identify ways to be more effective, minimize drag, and avoid missteps that may have contributed to previous issues or bugs.

Let Lucidchart capture past and future system improvements

Lucidchart makes it easy to create thorough, easy-to-read documentation that your entire organization can understand and reference, regardless of their technical knowledge. Whether you need network diagrams for your IT and engineering teams, low-fi mockups or wireframes for creative and web dev teams, or any other technical diagram, Lucidchart can help you visualize technical systems quickly, so it’s fast and easy for scrum teams to reference throughout project iterations. 

With auto-generated diagrams and data linking features, you can import your existing data from any Google Sheets, Excel, or CSV file directly into Lucidchart to generate your visual, then overlay data on top of existing visuals for added context, such as cost or performance data. As you update your data set, your changes will reflect immediately on your visuals for your team to see. Our AWS and GCP shape libraries let you easily drag and drop industry-standard shapes onto your network diagram for easy customization. Our layers feature allows you to visualize current and potential versions of your network. 

Company High Level Systems Overview
See an example of a high-level systems overview

Start your free trial and go Agile today

Implementing the Agile methodology across an entire organization requires some backup. That’s where Lucidchart comes in. Revolutionize your organization’s Agile workflow with a free trial from Lucidchart.

Lucidchart

Lucidchart, a cloud-based intelligent diagramming application, is a core component of Lucid Software's Visual Collaboration Suite. This intuitive, cloud-based solution empowers teams to collaborate in real-time to build flowcharts, mockups, UML diagrams, customer journey maps, and more. Lucidchart propels teams forward to build the future faster. Lucid is proud to serve top businesses around the world, including customers such as Google, GE, and NBC Universal, and 99% of the Fortune 500. Lucid partners with industry leaders, including Google, Atlassian, and Microsoft. Since its founding, Lucid has received numerous awards for its products, business, and workplace culture. For more information, visit lucidchart.com.

Bring your bright ideas to life.

Sign up free

or continue with

Sign in with GoogleSign inSign in with MicrosoftSign inSign in with SlackSign in

Get started

  • Pricing
  • Individual
  • Team
  • Enterprise
  • Contact sales
PrivacyLegal
  • linkedin
  • twitter
  • instagram
  • facebook
  • youtube
  • glassdoor
  • tiktok

© 2024 Lucid Software Inc.