Productivity survey: Want to be a go-getter? WFH, take more vacation, and get a dog
Lucid Content
Reading time: about 6 min
Countless productivity studies highlight sleep patterns, social media use, and other daily habits, but what are some of the other factors, particularly small ones, that can help people be more productive inside and outside of work? And are you already doing some of those things without even knowing it?
Recently, Lucidchart polled more than 1,000 U.S.-based office workers to get a better sense of what makes them productive. And while it’s no surprise that factors like a slow computer (50%), noisy colleagues (38%), meetings (30%), hunger (20%), and social media distractions (15%) at work are consistently keeping workers from being productive, what are some of the less-talked-about traits of the most productive (and unproductive) workers?
Check out our infographic below (click to enlarge or download) or continue reading to learn the habits that can make you more productive, from what to keep on your desk to what to watch on TV.

Who is most productive?
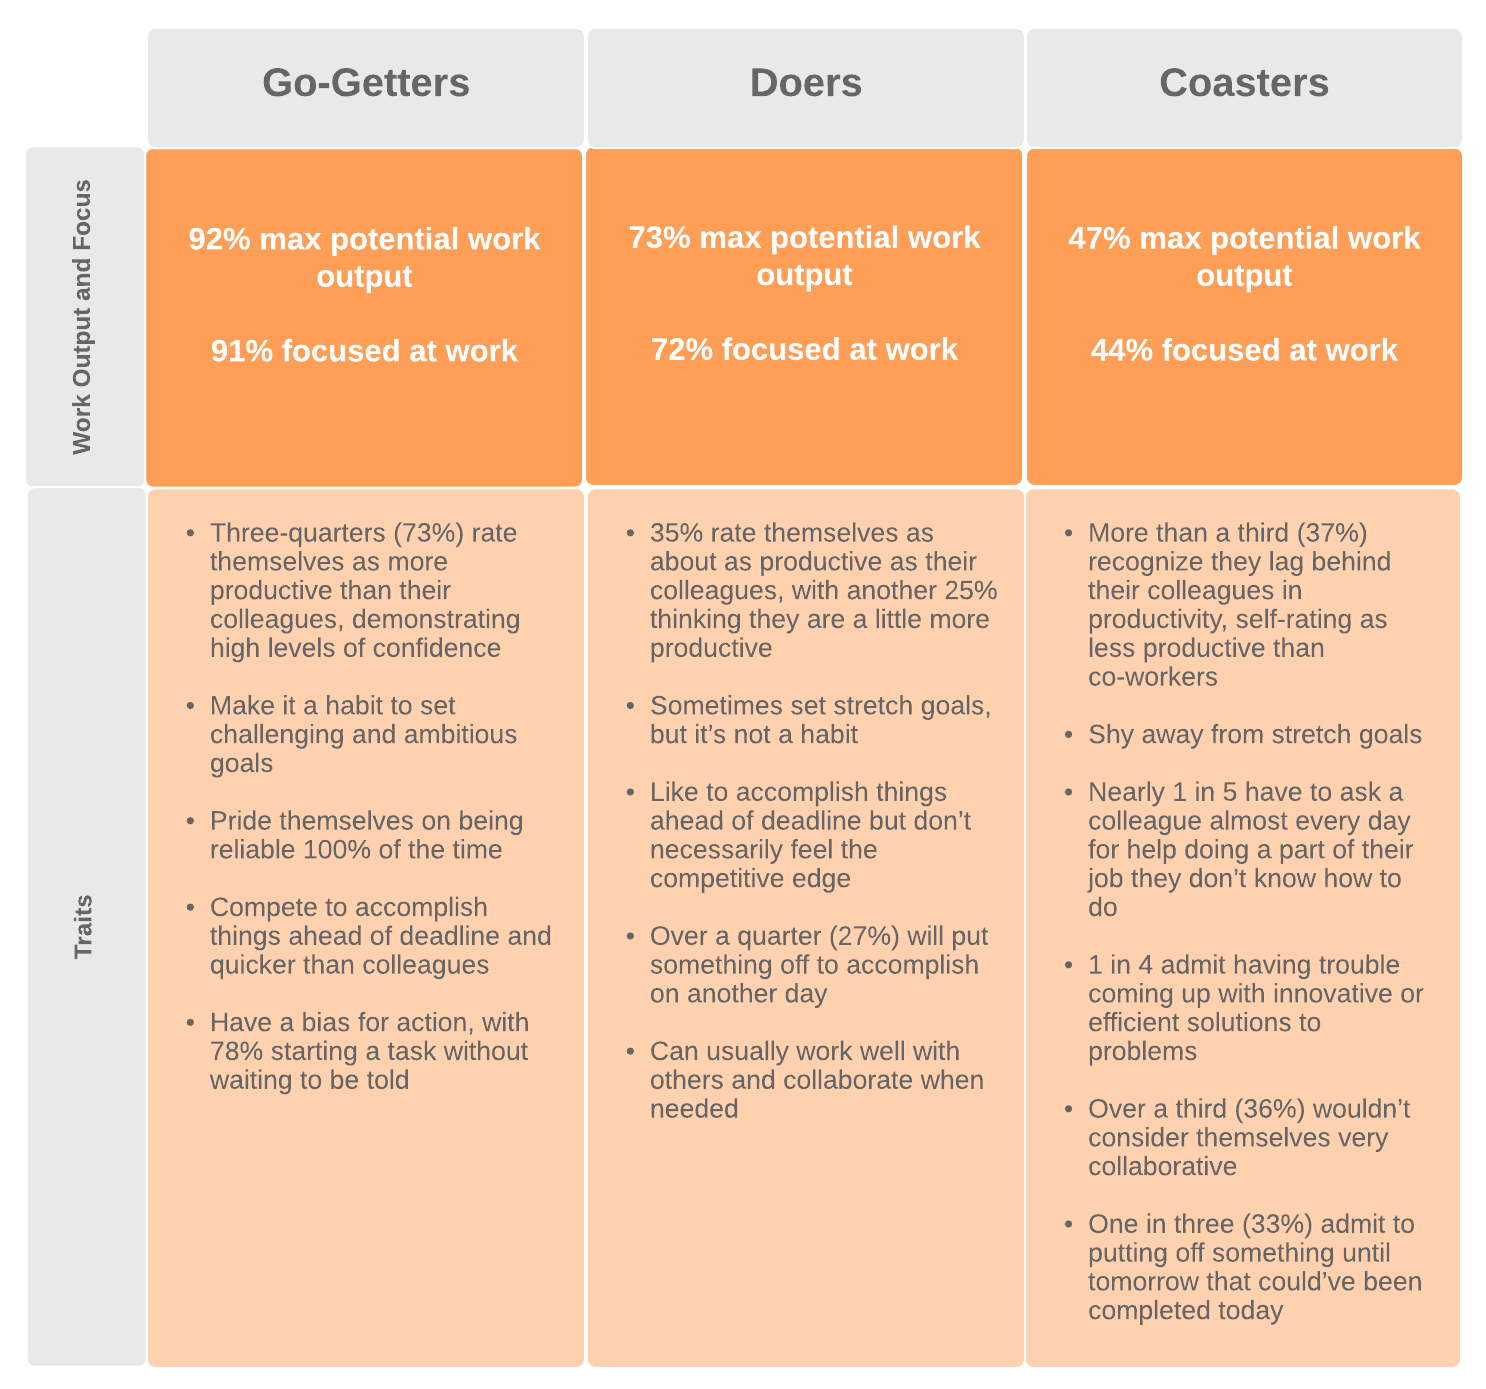
In analyzing the data and comparing it to the behavioral traits commonly attributed to the most productive people, three personas emerged: the Go-Getter, the Doer, and the Coaster. The Go-Getters had the highest productivity, while the Coasters had the lowest; Doers fit in between the more polarized personas with average productivity.
What do people do to stay productive?
By looking at the traits of these personas, individuals can find ways to potentially increase their productivity (and avoid time-wasters). To get a better idea of productivity habits throughout the office and at home, we looked at the traits of these personas and have outlined some interesting trends below.
In the workplace
Sticky notes may be the answer
When it comes to increasing productivity, one of the first factors to consider is your actual surroundings within the workplace. While elements such as having photos of your children and healthy snacks at your desk seem to drive productivity, you may want to keep the toys and junk food at home.
- Keep sticky notes at their desks: 78% of Go-Getters vs. 67% of Coasters. Notably more women (82%) have sticky notes at their desk than men (69%).
- Keep healthy snacks at their desks: 26% of Go-Getters vs. 18% of Coasters. On the flip side, Coasters (17%) favor junk food compared to Go-Getters (12%).
- Keep photos of children at their desks: 33% of Go-Getters vs. 24% of Coasters
- Keep toys at their desk: 8% of Go-Getters and Doers vs. 14% of Coasters. Men (12%) are more likely to keep toys on their desks than women (7%).
- Keep loose papers at their desks: 58% of Go-Getters vs. 62% of Doers and 63% of Coasters
Productive people play as hard as they work
According to the data, the most productive people take more vacation, work from home more, and take notes by hand, and your boss might be a coaster.

Look for the digital divide
Go-Getters are most likely to take notes in a notebook during a meeting, as opposed to taking notes on their computer.
- Use a notebook to take notes: 57% of Go-Getters vs. 54% of Doers and 49% of Coasters
- Use a computer to take notes: 19% of Go-Getters vs. 24% of Doers and 21% of Coasters
At home
Ditch the diet, but don’t forget to exercise
Looking to increase your productivity at home? Whether it is keto, gluten-free, or vegan, productive people don’t bother with the latest diet trend, but they do keep their body moving as soon as their alarm rings.
The survey found that Coasters are the most likely to follow a specific dietary practice, with 11% vegetarian and 7% vegan; 67% of Go-Getters don’t follow any specific diet.
However, Go-Getters (47%) are more likely to work out at least three times a week and are the least likely to hit the snooze button (50% say they don’t hit the snooze button, compared to 44% of Doers and 33% of Coasters). Coasters, on the other hand, are more likely to snooze through their workout with only 38% exercising more than three times a week.
The most popular times for Go-Getters to exercise?
- 37% - Early evening (5:00 to 7:00 p.m.)
- 19% - Early morning (before 8:00 a.m.)
- 16% - Late evening (7:00 p.m. or later)
And while you may turn to soda for a quick mid-day jolt, it’s worth knowing that the least productive people are more likely to drink more caffeine, with 18% of Coasters drinking the equivalent of at least three 12-ounce caffeinated sodas a day compared to 13% of Go-Getters/Doers.
TV is a waste of time? Not necessarily.
While some may think getting in some good screen time may be a giant time suck, even the most productive people get their fair share. But the type of TV they are watching might be different than you think. In fact, the more productive the person is, the more likely they are to enjoy shows like “This is Us” and “NCIS” one episode at a time (44% of Go-Getters say they watch one episode weekly vs. 28% of Coasters), while Coasters prefer to binge on shows like “Game of Thrones” (21% of Coasters binge shows vs. 17% of Go-Getters).
- Doers (30%) and Coasters (24%) are more likely to watch “Game of Thrones” than Go-Getters (22%).
- Nearly a third of Go-Getters (28%) watch “NCIS,” while only 14% of Coasters do.
- The more productive the person, the more likely they are to watch “This is Us”: 21% of Go-Getters, 18% of Doers, and 17% of Coasters.
Whether you watch alone or with a prime-time pet can make a difference, too: Go-Getters and Doers are more likely to have a dog (44%) than Coasters (35%).
A final thought... Sometimes productivity is completely out of your control—nearly a third of Coasters (31%) are the youngest children in their family (compared to 29% of Doers and 23% of Go-Getters). If that’s the case for you, maybe it’s time to plan your next vacation or slow down on binge-watching to bring more balance—and productivity—to your life.
About the research
An online survey was conducted in March 2019 among 1,030 U.S. adults who are employed full-time in a traditional office (desk-job) environment. Personas were developed using a K-means clustering analysis performed in R. Questions used to measure productivity focused on areas such as typical work output, focus, and engagement during the workday, along with the adoption of productive behavioral traits.
About Lucidchart
Lucidchart, a cloud-based intelligent diagramming application, is a core component of Lucid Software's Visual Collaboration Suite. This intuitive, cloud-based solution empowers teams to collaborate in real-time to build flowcharts, mockups, UML diagrams, customer journey maps, and more. Lucidchart propels teams forward to build the future faster. Lucid is proud to serve top businesses around the world, including customers such as Google, GE, and NBC Universal, and 99% of the Fortune 500. Lucid partners with industry leaders, including Google, Atlassian, and Microsoft. Since its founding, Lucid has received numerous awards for its products, business, and workplace culture. For more information, visit lucidchart.com.
Related articles
10 Lucidchart features to increase productivity
Lucidchart can work wonders for increasing productivity—want to learn how? Check out the top 10 tips and tricks for making your work easier as you build, share, and present diagrams.
Free webinar: 6 visual communication hacks to increase productivity
Join our free webinar Wednesday, April 26, 2017 at 2 p.m. EST to learn visual communication hacks you can use to increase productivity.
Bring your bright ideas to life.


By registering, you agree to our Terms of Service and you acknowledge that you have read and understand our Privacy Policy.