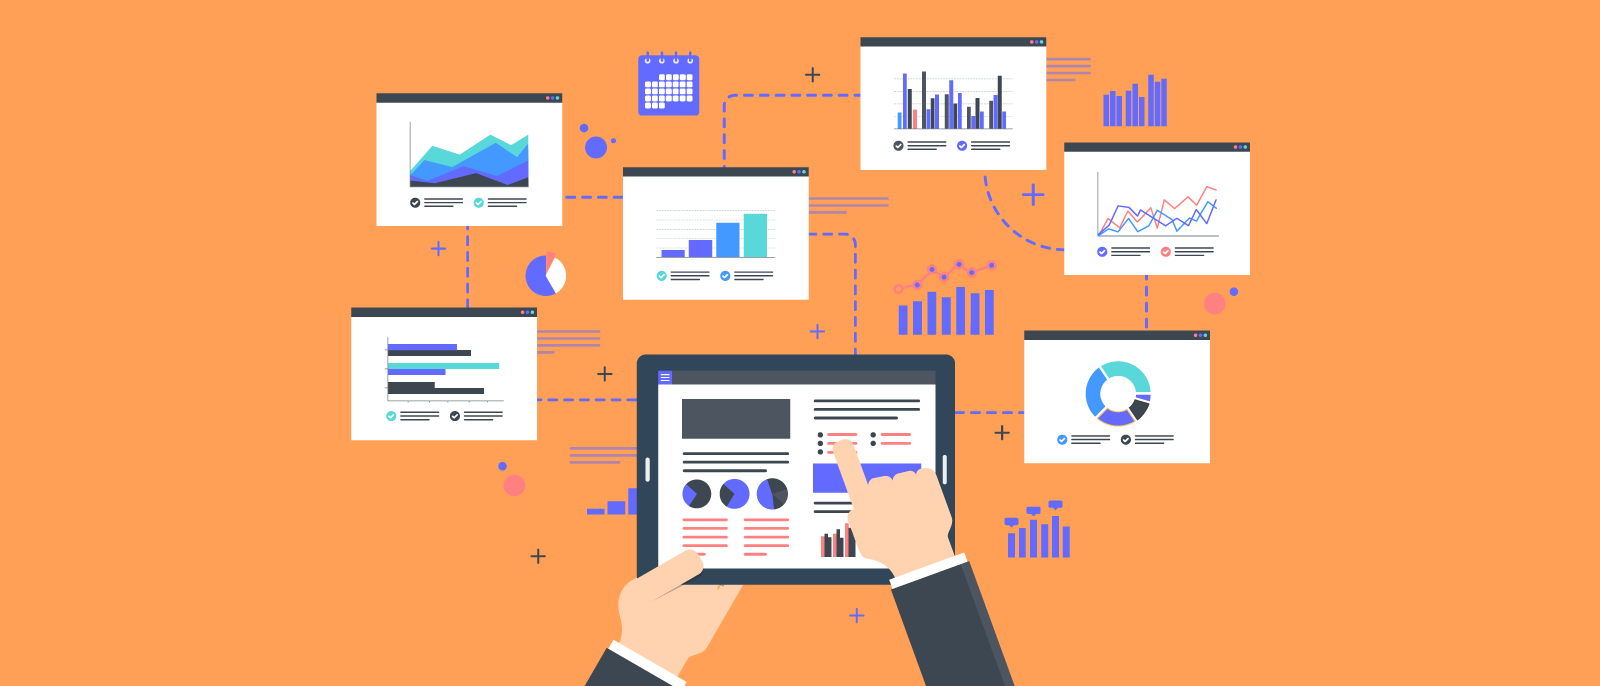
How to use a project dashboard to keep your team on track
Lucid Content
Reading time: about 5 min
Topics:
Project management is all about juggling: people, data, expectations, resources—you name it. At any given moment, a project manager has to know where each “ball” is, where it’s going, and where it needs to be. And when you’re dealing with million-dollar budgets, impatient shareholders, angsty developers, and tight deadlines, this is easier said than done.
To keep everything on track, project managers need all the help they can get. One of the best ways to track and measure ongoing progress is by using a project management dashboard.
Learn how project dashboards improve project outcomes and how you can make them.
What is a project dashboard?
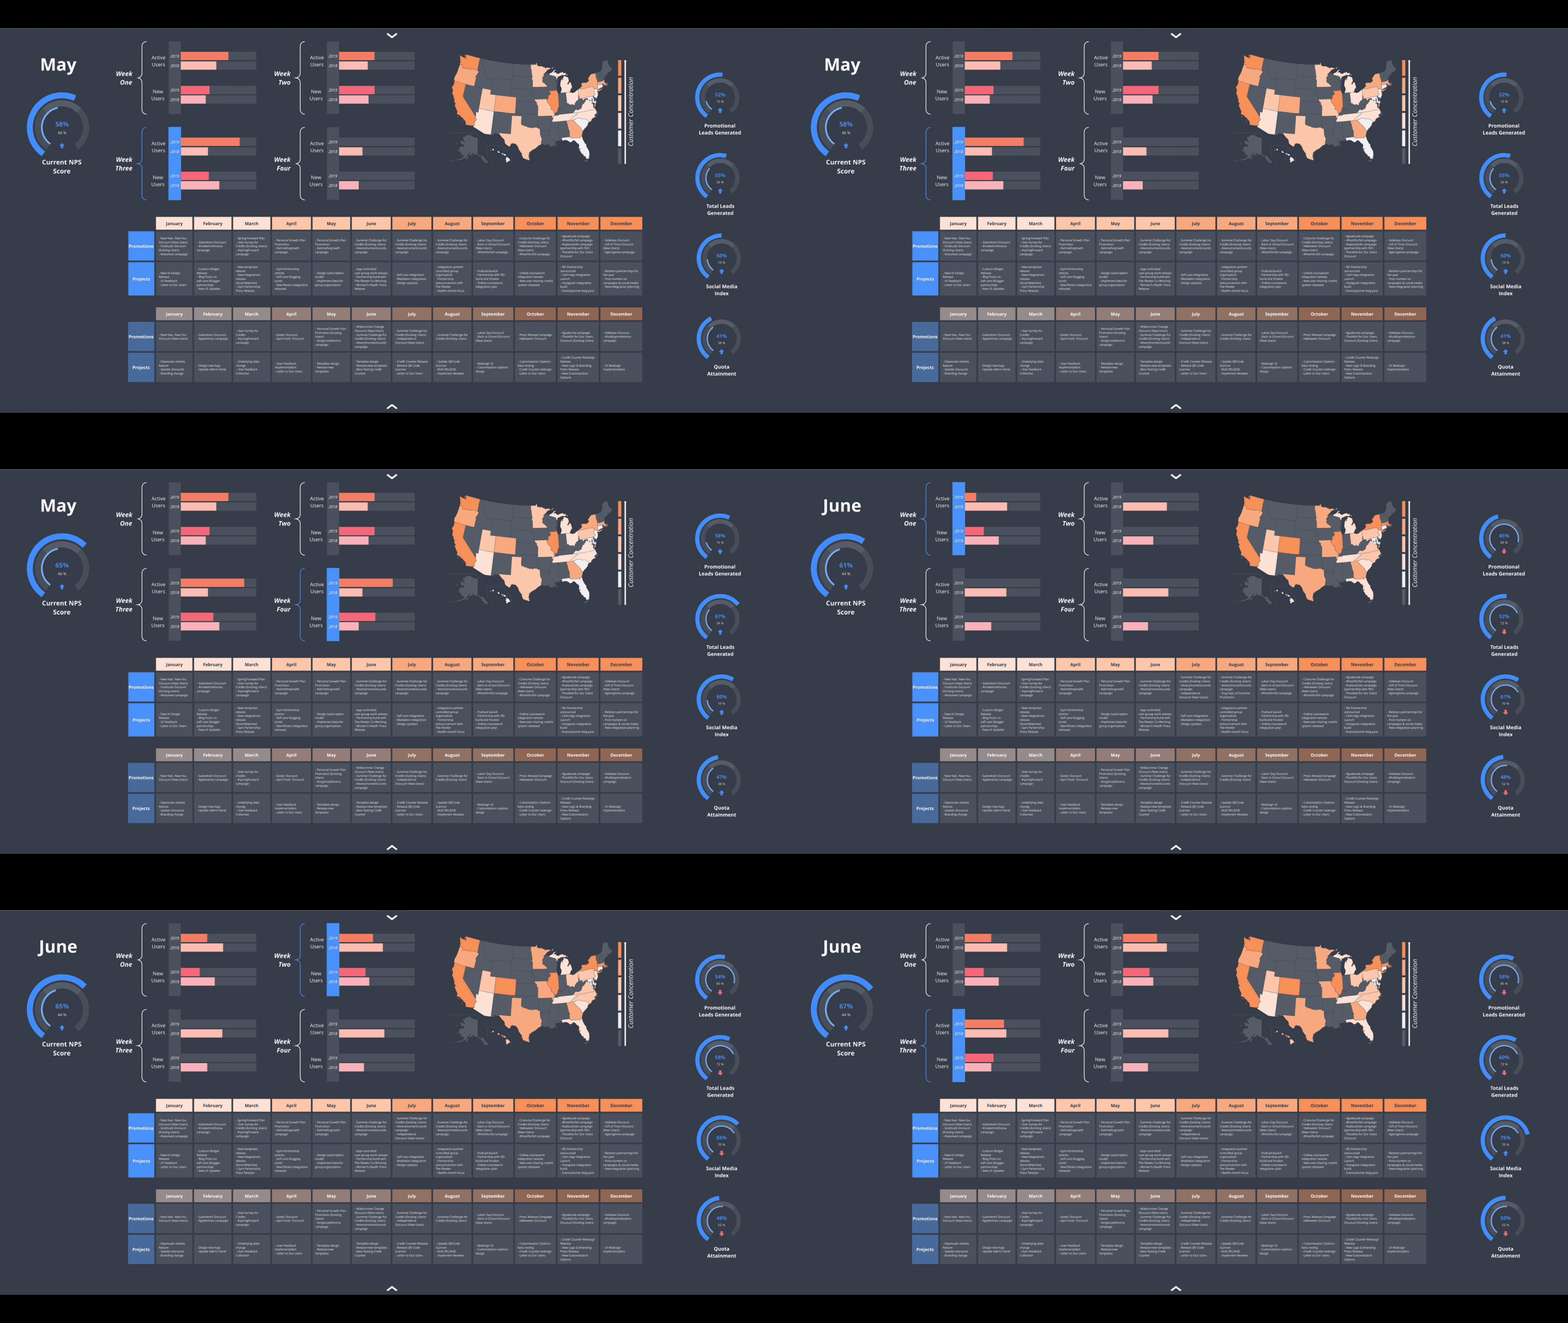
Similar to the dashboard in your car, a project dashboard provides at-a-glance data and metrics about the current status of your project. With all the key performance metrics presented in one place, project managers can more effectively measure the triple constraints of scope, budget, and time.
However, unlike a car’s dashboard, which tracks the same key metrics (e.g., speed, RPM, gas mileage, MPG, etc.) from vehicle to vehicle, project management dashboards are more flexible and can vary significantly depending on the project, team, and tracking needs.
As the project manager, you’ll have to decide what KPIs you want to track and how you want that data delivered. Some common data presentations include:
- Graphs and charts
- Text-based lists
- Interactive visualizations
- Timelines
However the data is delivered, there are significant benefits to keeping an updated project dashboard in your management toolbox.
Benefits of a project dashboard
Project dashboards make project management easier and more efficient because they present continuous performance data at a glance. When managers and stakeholders have access to their project’s progress, health, and projections, they experience significant benefits, including:
- Greater convenience
- Increased efficiency
- Improved accuracy
- Better communication
- Persuasive evidence
Keep in mind that a project management dashboard isn’t just for the project manager. When all stakeholders have access, each team member and decision maker can stay abreast of developments, needs, and progress on both a high- and granular level. Everyone stays on the same page, improving communication across teams and individuals.
Plus, with an at-a-glance progress report, leaders and team members don’t have to waste time slogging through disparate data sets and mocking up new reports. By the time they’ve manually compiled all the data and put it into a cohesive report, the data is already old. Read: virtually useless.
Instead, project dashboards simplify this work by compiling the data in one place with real-time updates. This means less time wasted on reporting and more time focused on completing project tasks and driving the project forward.
Additionally, displaying key data in one place helps managers give more compelling presentations with persuasive visual evidence for everyone to see. Clear evidence makes it easier to get stakeholder buy-in on crucial decisions. For example, if the data shows that the project is over budget, the project manager can more easily persuade decision-makers to approve a project pivot or adjustment.
Tracking project dashboard metrics
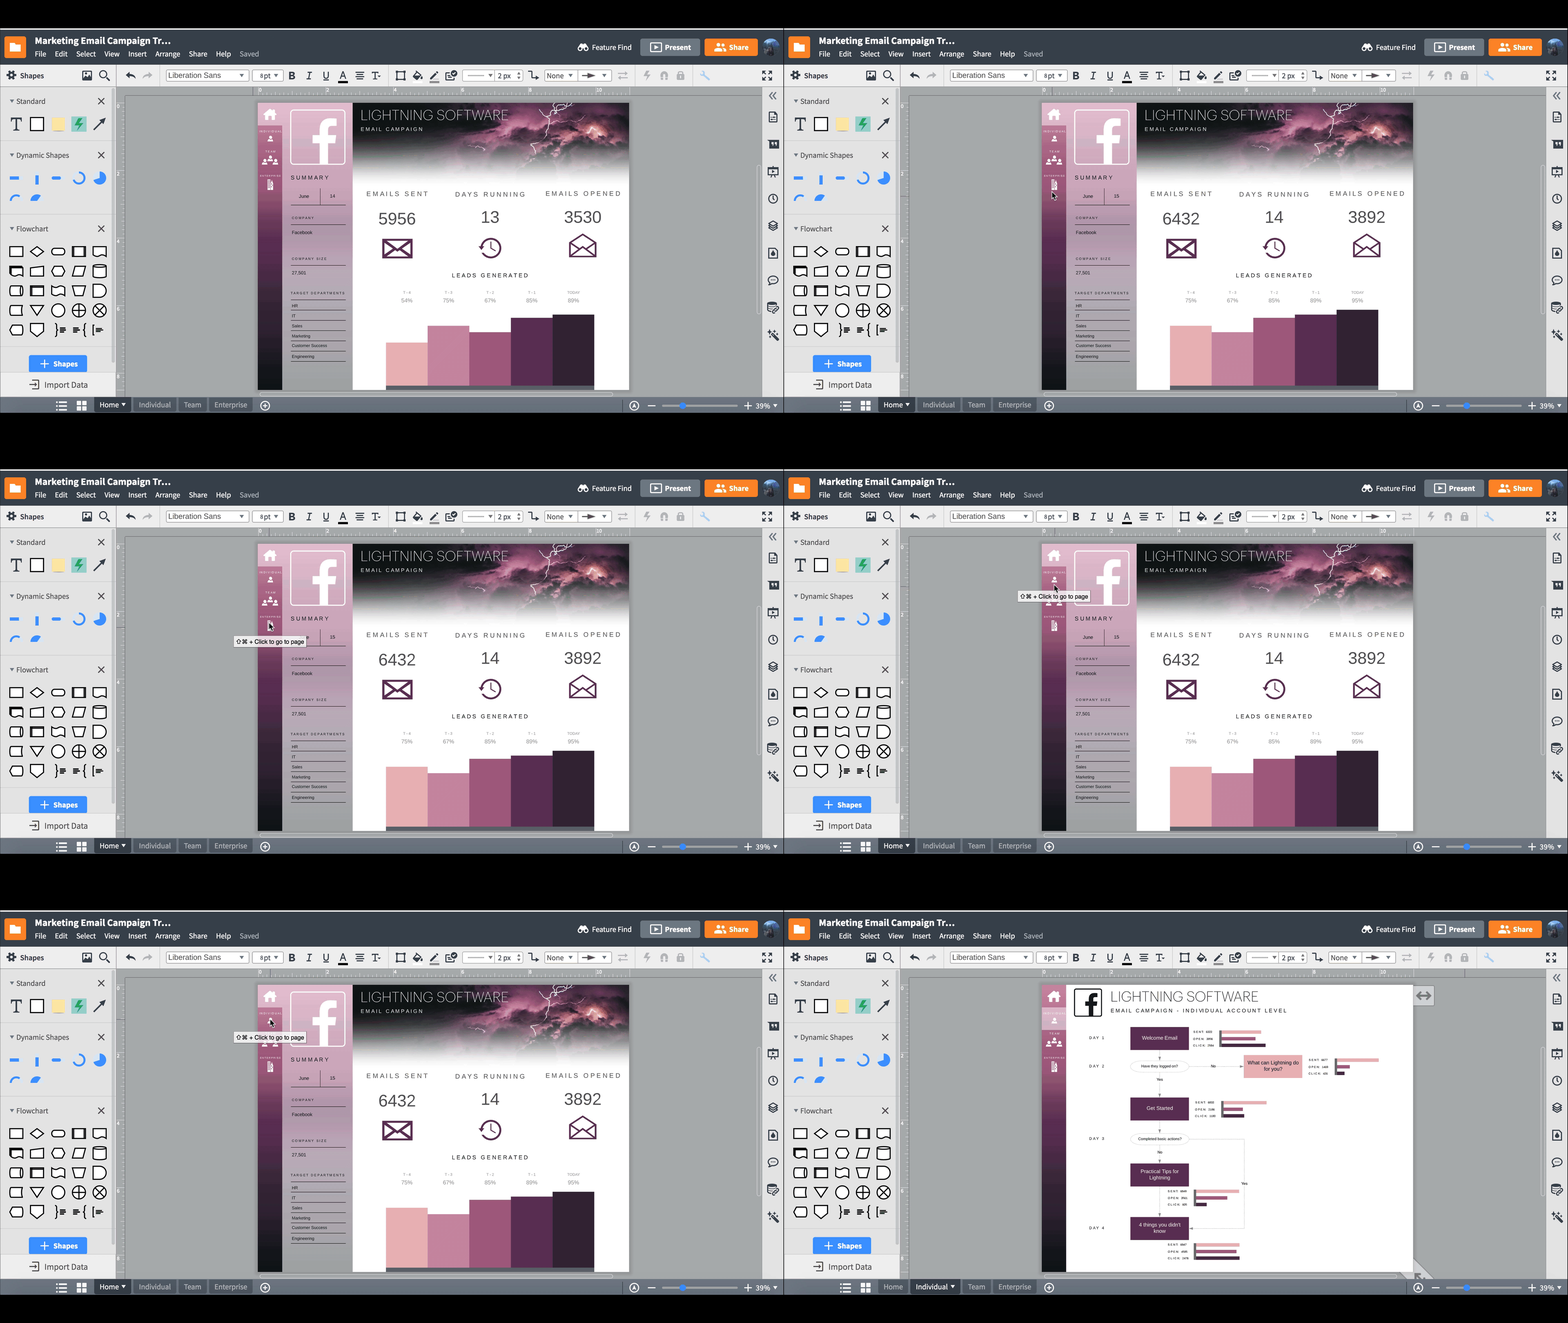
The success of a project often depends on the quality and accuracy of the metrics and KPIs you track. So what should go on your dashboard? That depends. Here are a few data types you can visualize on a project dashboard:
- Business intelligence (BI)
- Task status
- Project progress
- Team workload
- Individual task status
- Project risks and changes
- Hours (billable and unbilled)
- Critical actions
- Budget
What metrics you track on your project dashboard will depend on the project and your goals for the dashboard.
For instance, do you need to quickly see what tasks are completed or where there are bottlenecks in the schedule? Or do you want to track patterns or identify potential opportunities? These questions will help you determine what kind of dashboard you need and what functionality and features you should look for.
Important features in a project dashboard
There are many project management dashboard systems out there. Whether you create your own or work on a specific platform, you should look for these features in a dashboard:
- Scannability
- Real-time updates
- Customization
- Shareability
- Intuitive navigation
To get the most value out of your dashboard, data should be presented in an easy-to-digest format and on a platform with multiple sharing options. Remember: Project dashboards are not just for the managers, but for the team to track their progress. If they can’t easily access the dashboard or if it isn’t customized to the project’s data needs, it will go to waste.
Additionally, and perhaps most importantly, look for dashboards that offer real-time data updates. In the world of product development and project management, data can change within hours and even minutes.
If you have to manually import, export, and convert data from one platform to another before your dashboard can render it, your data will fall behind, leading to inefficiencies at best and false assumptions and critical errors in decision making at worst.
Give your team and your project the best chance of success by using project dashboards that deliver the best data when you need it, how you need it.
Using Lucidchart for visual project management
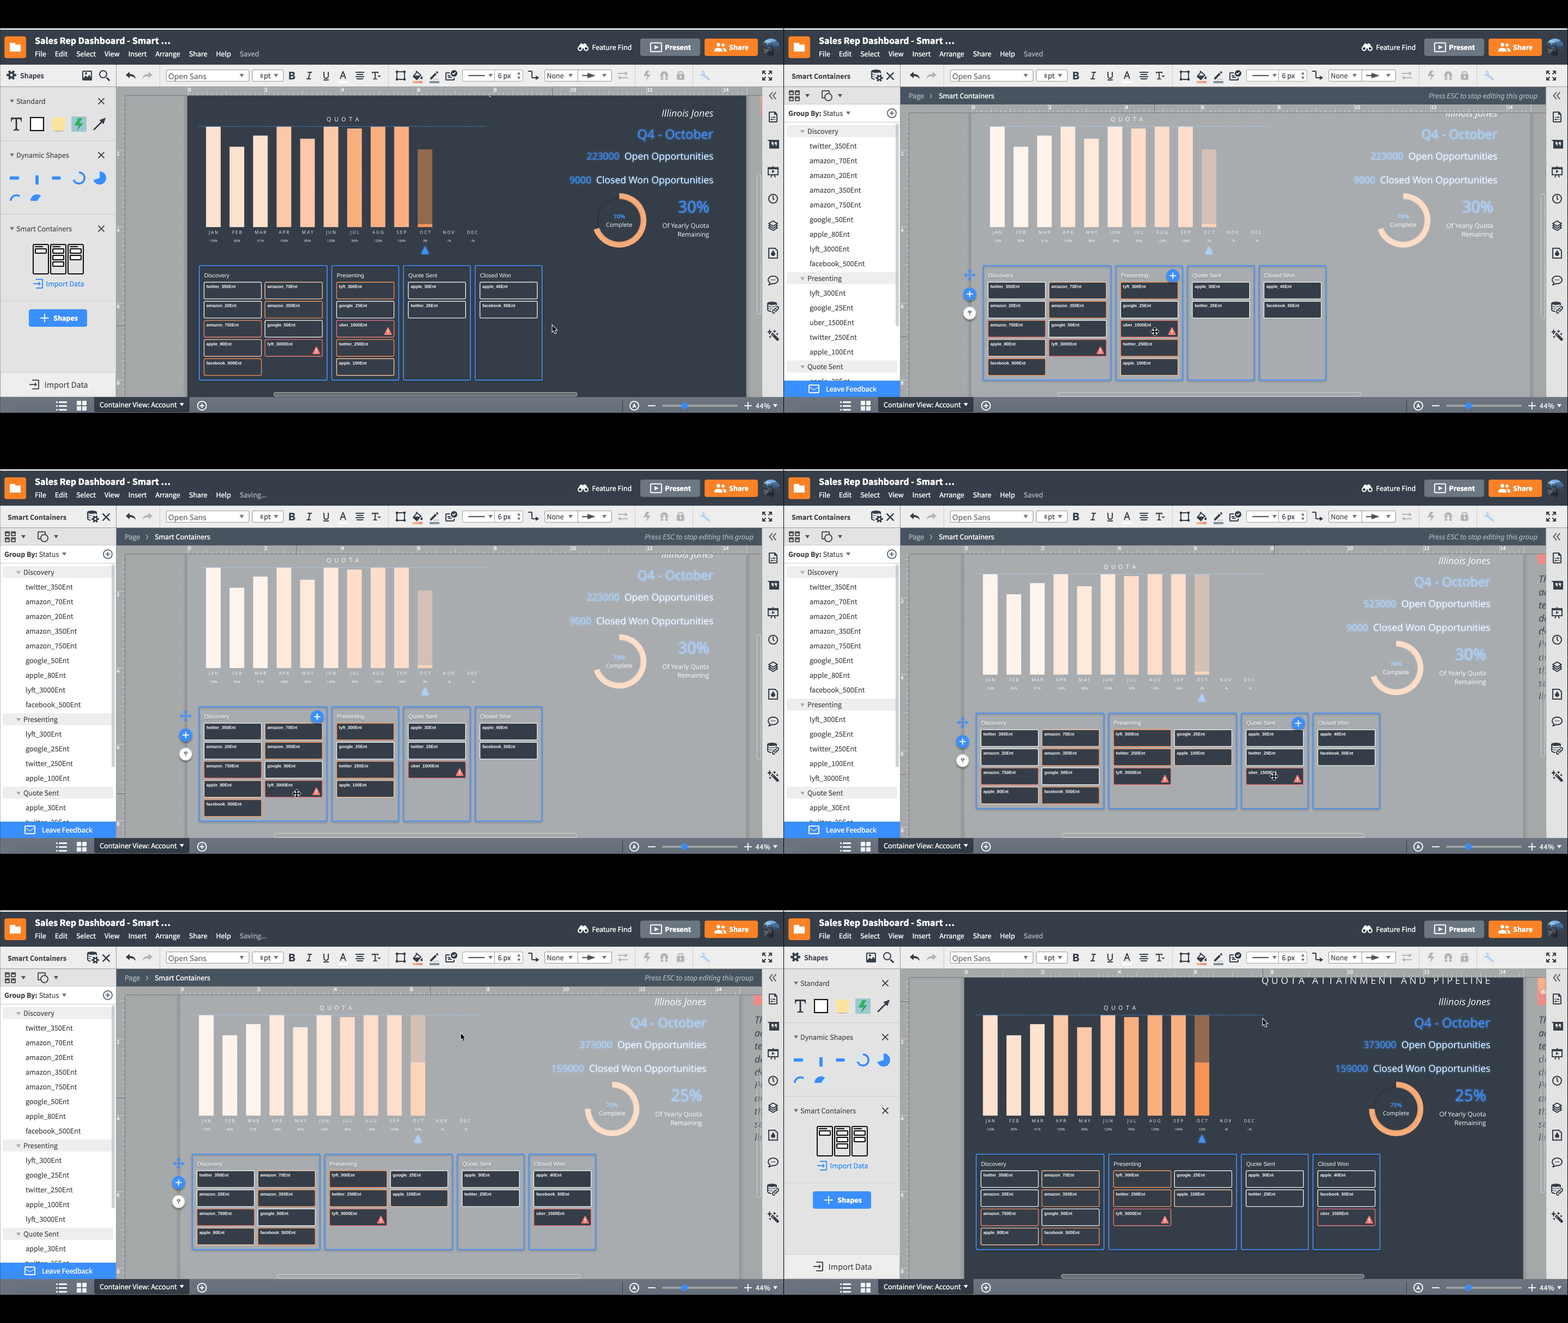
Lucidchart gives project managers the flexibility and customization they need to craft elegant data visualizations that not only look professional but can keep up with leading project dashboard software.
Take advantage of features such as:
- Data linking: Connect shapes and diagrams to live data stored in spreadsheets.
- Actions: Make static elements interactive. With Actions, you can toggle between layers, link to external content, or hop from one page of a document to another.
- Conditional formatting: Set rules to easily interpret that data and monitor the health of your company or systems.
- Real-time collaboration: Keep data up to date, improve team communication, and reduce data delays and inaccuracies.
- Zapier integration: Bring live data into Lucidchart, link it to process flowcharts and other powerful diagrams, and monitor your metrics in context.
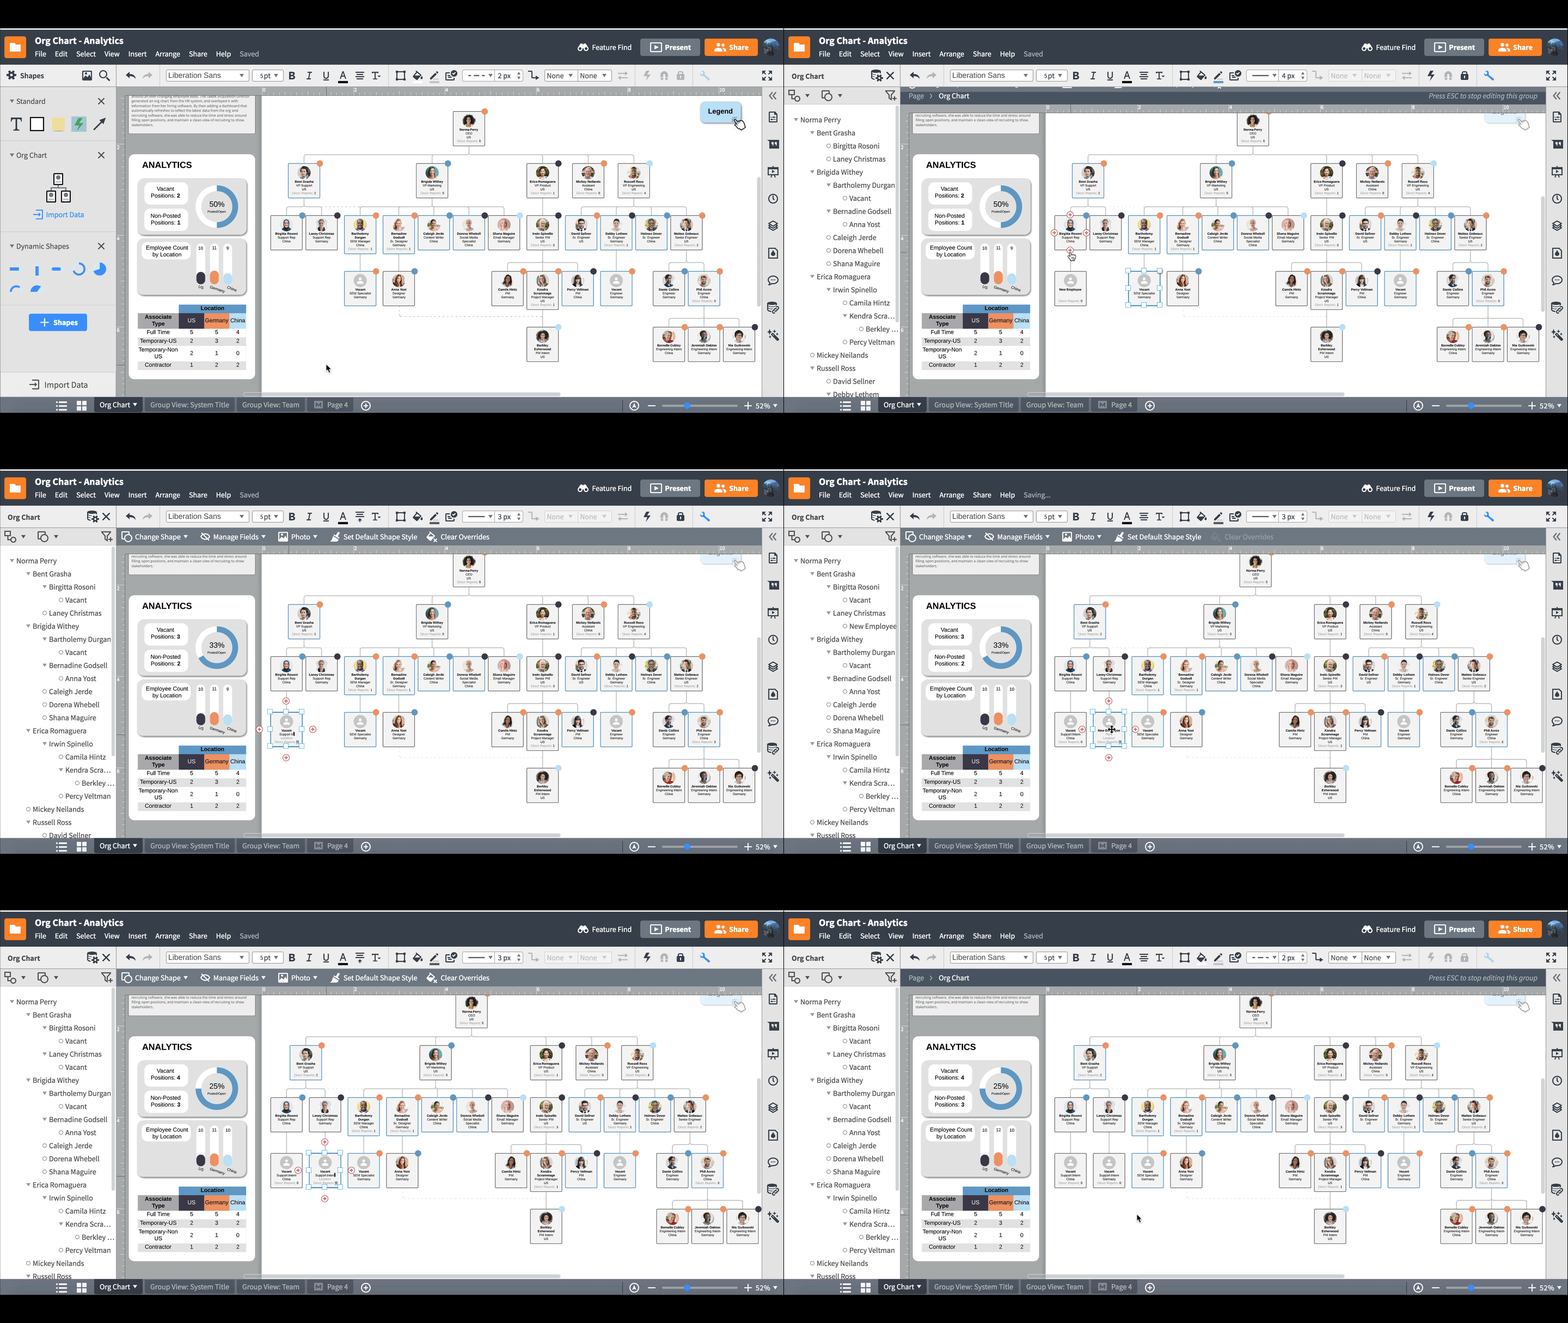
Now that you have the tips and tools at your disposal, it's time to get started. Build out a project dashboard to track your progress all the way to a successful outcome.

Learn how you can create your own dashboard in Lucidchart.
Learn moreAbout Lucidchart
Lucidchart, a cloud-based intelligent diagramming application, is a core component of Lucid Software's Visual Collaboration Suite. This intuitive, cloud-based solution empowers teams to collaborate in real-time to build flowcharts, mockups, UML diagrams, customer journey maps, and more. Lucidchart propels teams forward to build the future faster. Lucid is proud to serve top businesses around the world, including customers such as Google, GE, and NBC Universal, and 99% of the Fortune 500. Lucid partners with industry leaders, including Google, Atlassian, and Microsoft. Since its founding, Lucid has received numerous awards for its products, business, and workplace culture. For more information, visit lucidchart.com.
Related articles
3 Communication Hacks for Project Management Processes
Want to learn how to kill email novels and decrease your explanatory text by 78%? Keep reading for some communication hacks for project management processes that will take your communication to the next level of clarity.
Is your project management workflow process broken?
A smooth project management workflow can make or break your team. Learn how effective your current process is and how you can use Lucidchart to improve it.
Bring your bright ideas to life.
By registering, you agree to our Terms of Service and you acknowledge that you have read and understand our Privacy Policy.