Interactive diagrams: 4 ways to use hotspots and layers in Lucidchart
Reading time: about 3 min
Topics:
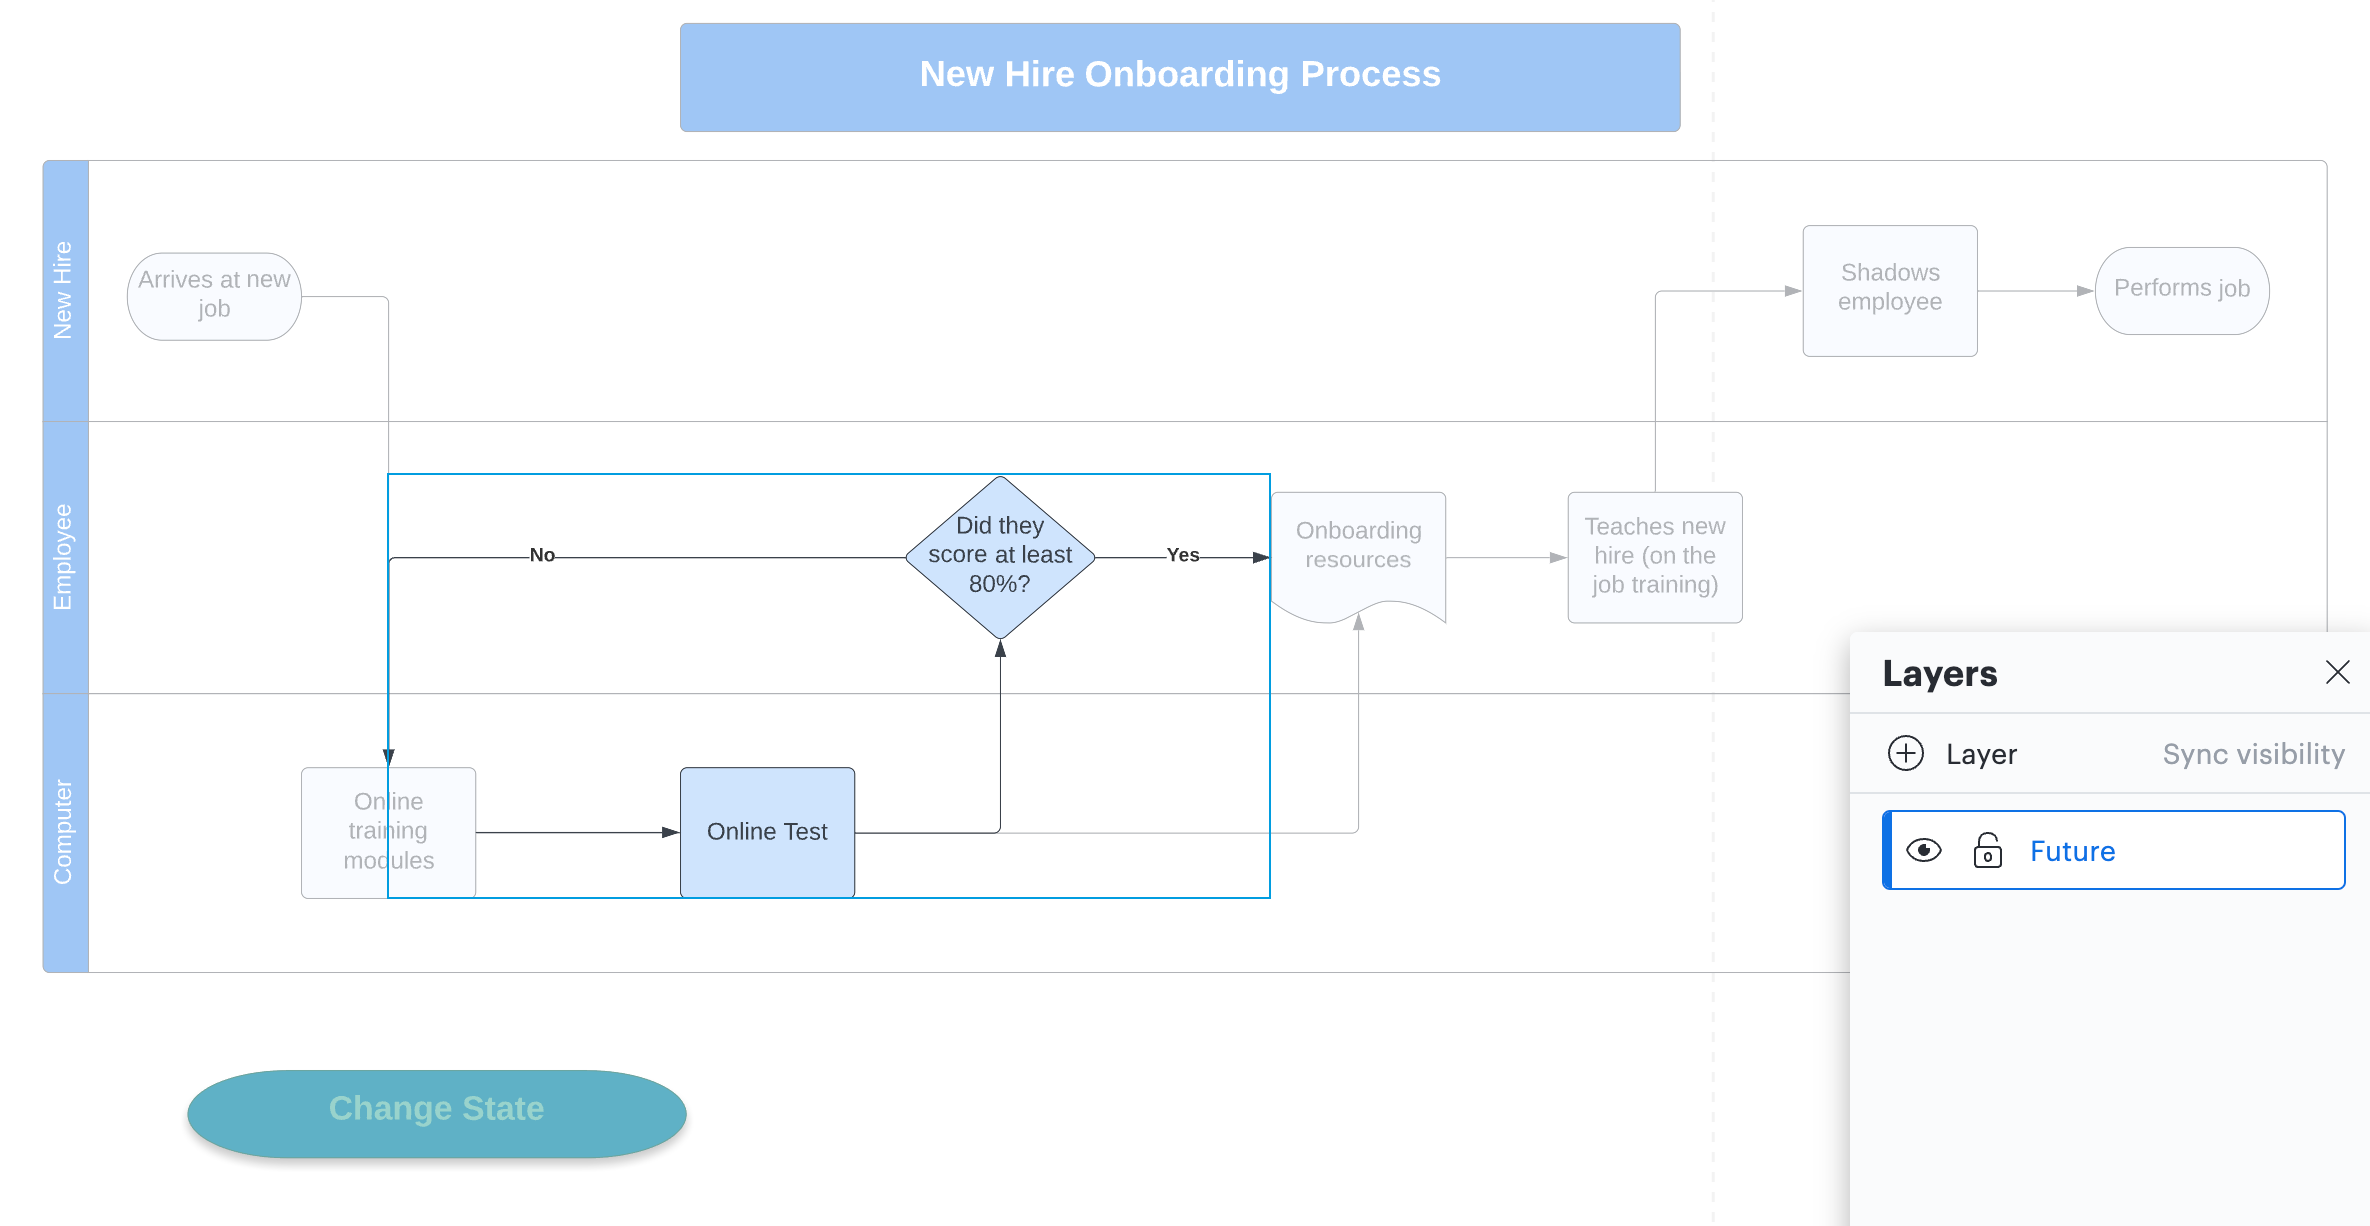
To edit a layer, click on the name of the layer in the layer context menu or double-click on a shape that is part of the layer you want to edit. You can hide a layer by selecting the eye icon next to the name of the layer.
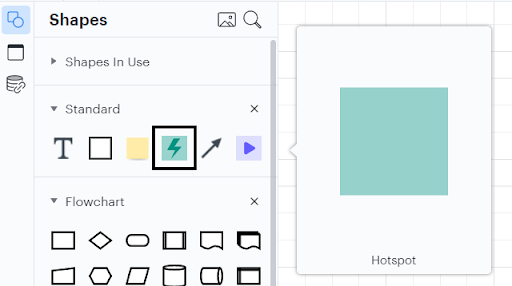
To add an action to a hotspot, select the hotspot and then click the gear icon.
About Lucidchart
Lucidchart, a cloud-based intelligent diagramming application, is a core component of Lucid Software's Visual Collaboration Suite. This intuitive, cloud-based solution empowers teams to collaborate in real-time to build flowcharts, mockups, UML diagrams, customer journey maps, and more. Lucidchart propels teams forward to build the future faster. Lucid is proud to serve top businesses around the world, including customers such as Google, GE, and NBC Universal, and 99% of the Fortune 500. Lucid partners with industry leaders, including Google, Atlassian, and Microsoft. Since its founding, Lucid has received numerous awards for its products, business, and workplace culture. For more information, visit lucidchart.com.
Related articles
5 hacks you didn’t know you could do in Lucidchart
Want to work more efficiently in Lucidchart? Check out these top tips.
10 Lucidchart features to increase productivity
Lucidchart can work wonders for increasing productivity—want to learn how? Check out the top 10 tips and tricks for making your work easier as you build, share, and present diagrams.
Build smarter Lucidchart diagrams [+ free course!]
In this post, we’ll go over some of best tips to build smarter diagrams. Includes a free course to become an expert!
Create diagrams faster using automation features in Lucidchart
Working visually shouldn’t mean more work for you. Find out how to automate your diagramming with Lucidchart to help your teams do more faster.
Bring your bright ideas to life.


By registering, you agree to our Terms of Service and you acknowledge that you have read and understand our Privacy Policy.