
How to nail your next project status report
Lucid Content
Reading time: about 7 min
Topics:
For busy project managers, creating yet another report can feel overwhelming. However, project status reports are one report you shouldn’t neglect. Status reports are essential for keeping managers, team members, and executives on the same page and ensuring your projects stay on track.
Use the following tips to generate status reports that are both clear and effective and to nail your next project.
What is a project status report?
A status report is exactly what it sounds like. It is a progress report outlining the status of key project elements like tasks completed, costs, and timelines.
Depending on the scope of the project and the audience for a report, status reports are typically generated weekly, monthly, or quarterly. Whatever the frequency, the goal is to regularly provide updates on a project’s progress.
A project status report allows team members and stakeholders to understand what has been accomplished, what still needs to be done, who is responsible for each task, and if there are major risks or roadblocks to manage.
Why are status reports important?
There are many benefits to creating regular status reports. As a project manager, you have a lot of moving parts to juggle. From budgets and deadlines to risk management and stakeholder buy-in, it can be difficult to keep your projects on track—or even know if they’re on track in the first place.
That is why project status reports are so important. Status reports are the hidden gem in the project manager’s tool belt. They not only tell stakeholders and other team members the health and progress of a project, but they help managers track all those essential metrics (like budget, costs, and deliverables).
Generating regular status reports allows managers to keep their finger on the pulse of the project and identify areas that need greater attention before they compound into bigger problems.
Bottom line: When project status reports are clear, simple, and accurate, they improve a project’s chance of success.
Anatomy of a project status report
Exactly how you report the project’s status will depend on the audience and the needs of the project. However, status reports should include the following sections and information.
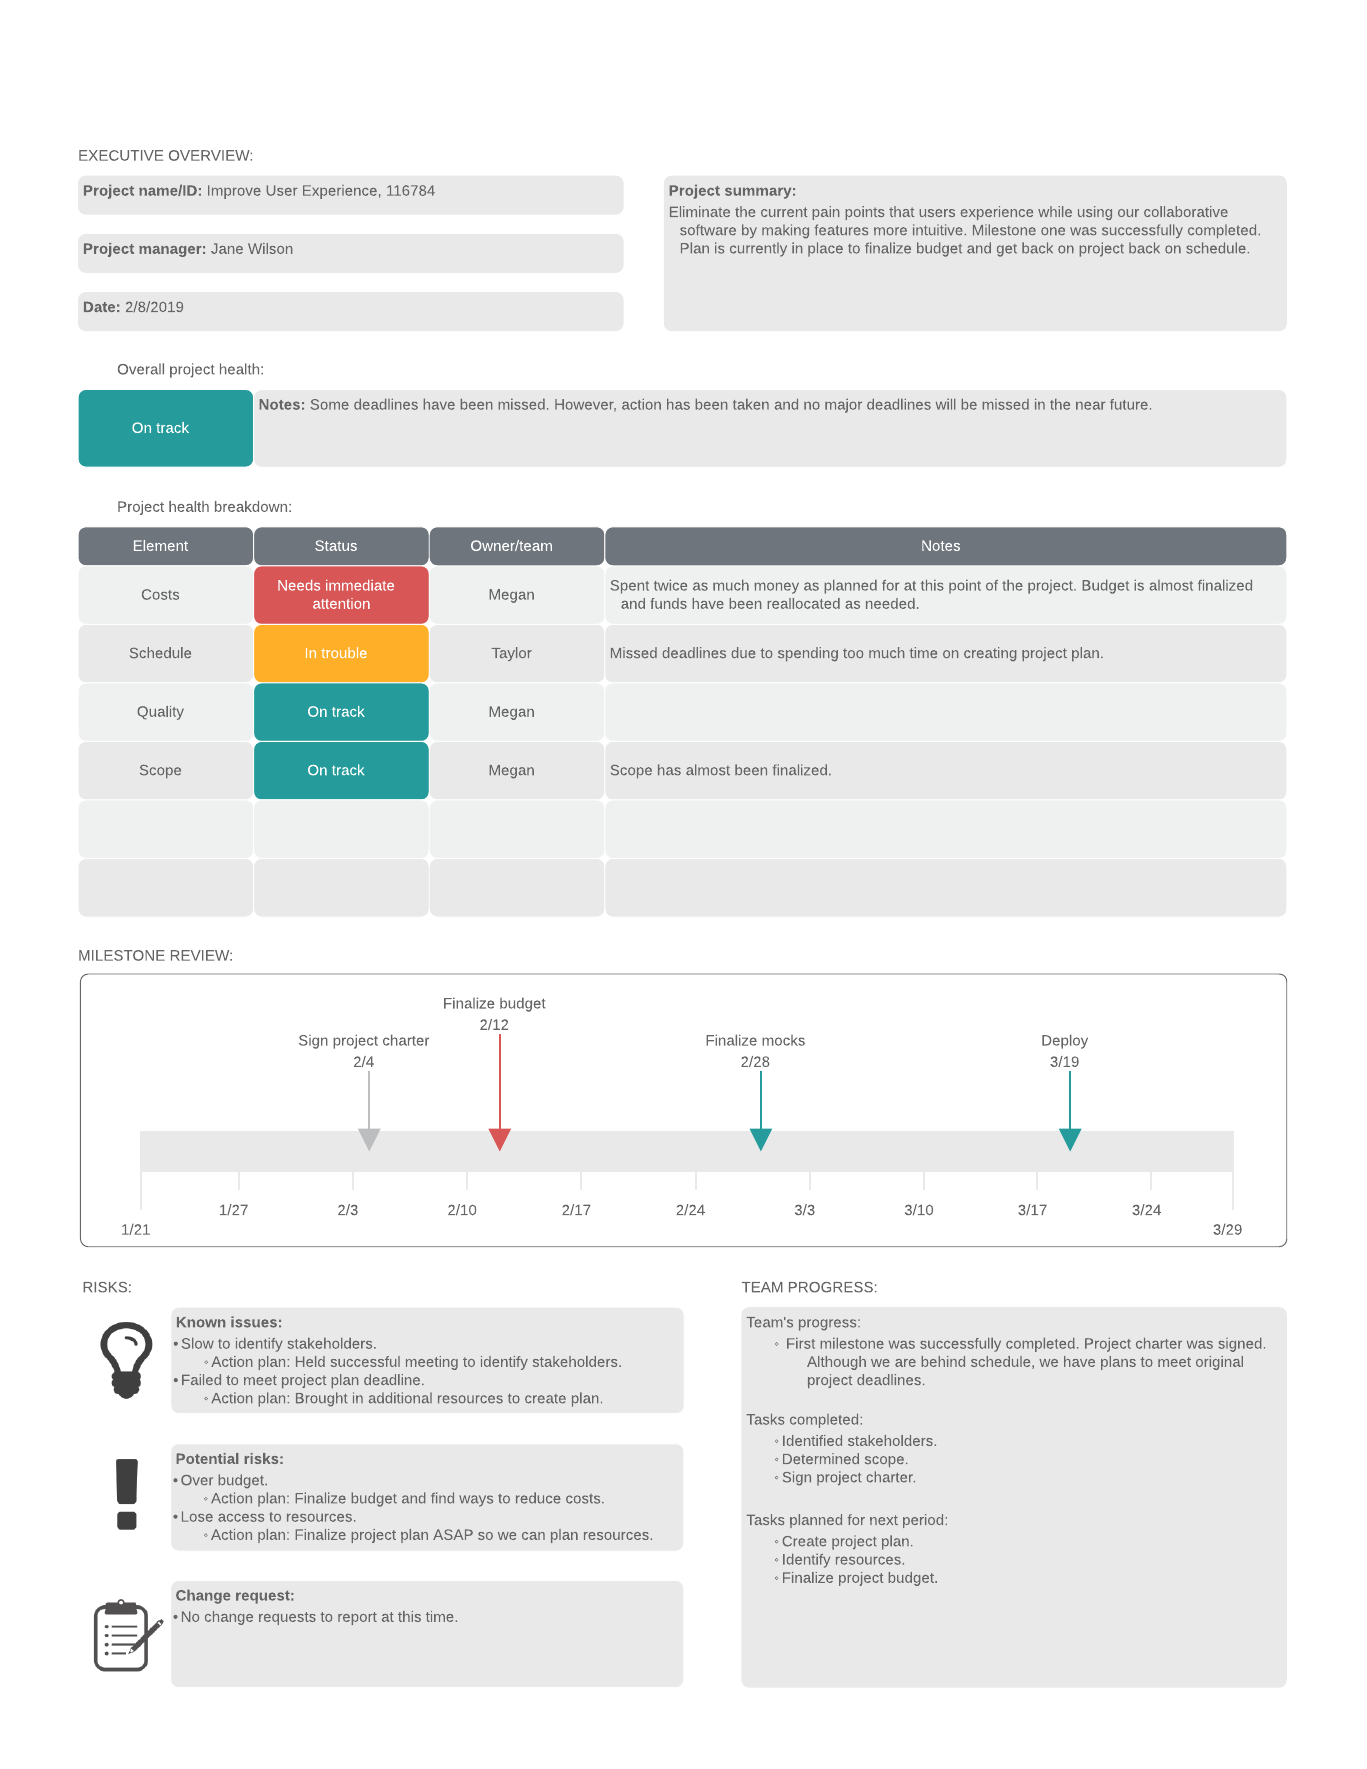
1. Executive overview
The first section of the report is the executive overview. The goal is to give a high-level summary of the most important points in the report. This section includes the general project information and summary, as well as a snapshot of the project’s overall health.
General project info
At the beginning of the report, be sure to identify the following:
- Project name/ID
- Project manager
- Date of the report
Including this information is crucial to keeping your reports organized and clear for you and other stakeholders.
Project summary
The project summary is a high-level review of the project’s progress. This is the place to identify project goals and deliverables, as well as your progress in meeting those objectives. Highlight any significant progress or setbacks that need attention.
Remember to keep this section brief and only include the most important information. You will be able to go into greater detail later.
Pro tip: Write the executive overview last. Once you’ve covered the rest of the report, it will be easier to parse out the information you want to highlight in your summary.
Project health
Finally, include a quick snapshot of the overall health of the project, either visually or in writing. One of the easiest ways to do this visually is using the “stoplight method.”
The stoplight method uses red, yellow, and green color coding to indicate the health of each project element (or the project as a whole).
- Green = On track
- Yellow = In trouble
- Red = Needs immediate attention
For example, if the project costs are creeping higher than anticipated, you might mark the budget as yellow for “in trouble.” This method will help stakeholders quickly identify those items that need to be addressed.
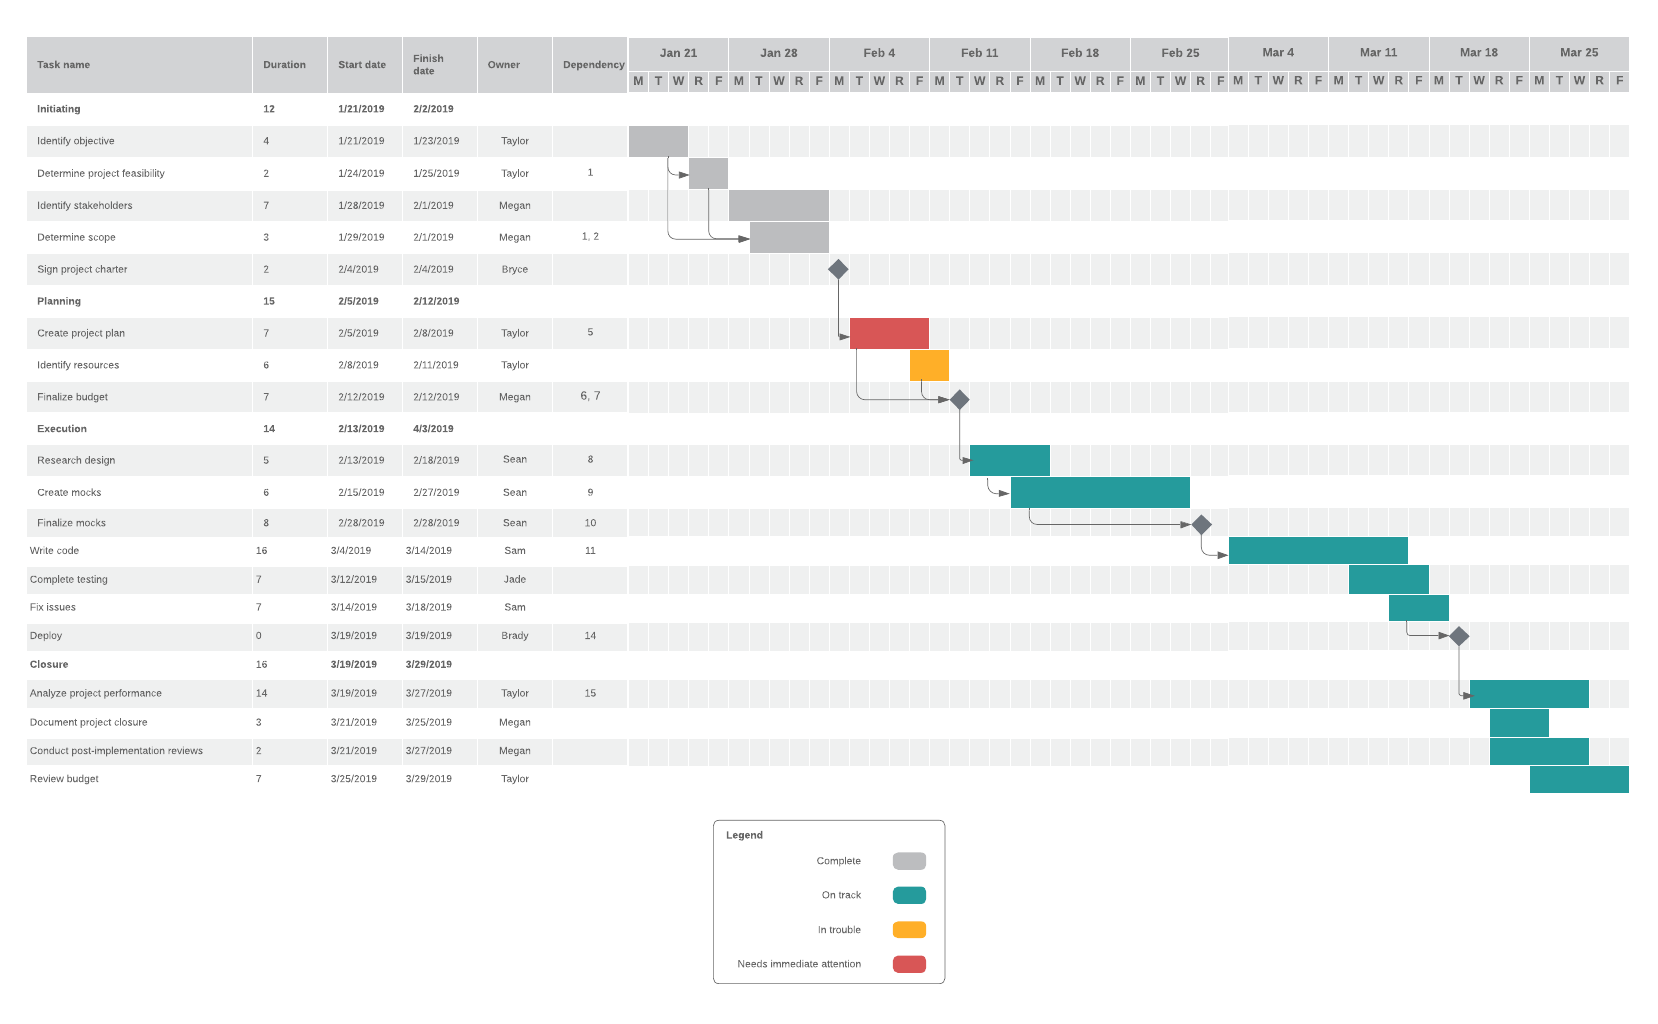
2. Milestone review
The next section is the milestone review, where you can go into more detail on the progress of each milestone and deliverable.
Because milestones are often tied to mid-project billing and invoicing, it is important to have an accurate picture of your team’s progress on them. This is a great place to use data visualizations and graphs or tables to easily communicate your project’s progress.
However you communicate it, be sure to include the following information:
- Percentage of milestone completed
- Planned start and finish dates
- Actual start and finish dates
You can break down the milestones into completed and incompleted tasks to show exactly what progress has been made on each milestone. The planned and actual start/finish dates on each milestone can help stakeholders understand at a glance whether the work is on track with the project’s overall timeline.
3. Risks
This section is where you can address any known issues, potential risks, or change requests that need to be addressed.
No one likes to talk about the risks and issues that could endanger the success of a project. But when you consistently track and identify potential issues along the way, you and your team can better manage them and (hopefully) resolve them or prevent them from growing out of control.
In your report, outline both previously noted issues/risks and new ones. Under each issue, add a note about what steps have been or will be taken to address them. Be sure to note if those strategies are working and what progress is being made.
4. Team progress
This is the place to share an overall team status report. Briefly summarize your team’s progress, along with any notable achievements. Then outline the team’s task calendar. This section should include tasks scheduled, tasks actually completed, and tasks planned for the next reporting period.
Finally, end with a short forecast for what progress you expect to see in the coming reporting period.
Keys to a successful project status report
You’ve got the outline of a good report, but how do you report project status effectively? Here are a few tips for creating a successful report:
Be consistent
Reports are less valuable if they don’t share information consistently every time. This principle applies to both the format and style of your reports as well as the data and content contained in them. Keep your reports consistent from week to week, month to month so that the information is easily comparable and forecasts and conclusions are accurate.
Keep it concise
To be effective, a status report needs to communicate the most important information and data as simply and concisely as possible. Remember, status reports are snapshots of a project. Highlight key points and takeaways and save more comprehensive details for project status meetings as needed.
Put the most important info first
Most stakeholders skim status reports for the most important details, so put that information first. Include overall takeaways in the executive summary and note key points early on in each section to prevent important points from getting buried in the details.
Use data and visuals
Data and visualizations like graphs, tables, and charts are essential for communicating information clearly and concisely. They also help break up blocks of text and make it easier to read and digest information.
Lucidchart is a cloud-based visual workspace that helps project managers and their teams visualize their data and share it with ease. Use Lucidchart to create custom visualizations to use in your project status reports and even track your project’s progress from a central dashboard.
Data linking lets you connect your data directly to your dashboard on Lucidchart. From there, it’s easy to customize your data visualizations. Conditional formatting allows you to add rules to shapes and colors. For example, you can format your project dashboard to color-code tasks in red, yellow, or green to alert you if you’re falling behind.
Create, track, and share your project data all from Lucidchart so you and your team are always on point.
Sign up nowAbout Lucidchart
Lucidchart, a cloud-based intelligent diagramming application, is a core component of Lucid Software's Visual Collaboration Suite. This intuitive, cloud-based solution empowers teams to collaborate in real-time to build flowcharts, mockups, UML diagrams, customer journey maps, and more. Lucidchart propels teams forward to build the future faster. Lucid is proud to serve top businesses around the world, including customers such as Google, GE, and NBC Universal, and 99% of the Fortune 500. Lucid partners with industry leaders, including Google, Atlassian, and Microsoft. Since its founding, Lucid has received numerous awards for its products, business, and workplace culture. For more information, visit lucidchart.com.
Related articles
How to use a project dashboard to keep your team on track
Project managers need all the help they can get to keep projects on track. Learn how you can track and measure ongoing progress and improve project outcomes using a project management dashboard. (Plus, see how Lucidchart can help you visualize real-time data.)
How to Save Projects, One Kickoff Meeting Agenda at a Time
The purpose of a kickoff meeting is to lay the foundation for a successful project—it’s an opportunity to ensure the stakeholder and the project team are on the same page as far as scope, goals, budget, and timeline. Make sure you're prepared by learning how to write a kickoff meeting agenda.
Bring your bright ideas to life.


By registering, you agree to our Terms of Service and you acknowledge that you have read and understand our Privacy Policy.