6 reasons to use Lucidchart instead of draw.io
Reading time: about 7 min

About Lucidchart
Lucidchart, a cloud-based intelligent diagramming application, is a core component of Lucid Software's Visual Collaboration Suite. This intuitive, cloud-based solution empowers teams to collaborate in real-time to build flowcharts, mockups, UML diagrams, customer journey maps, and more. Lucidchart propels teams forward to build the future faster. Lucid is proud to serve top businesses around the world, including customers such as Google, GE, and NBC Universal, and 99% of the Fortune 500. Lucid partners with industry leaders, including Google, Atlassian, and Microsoft. Since its founding, Lucid has received numerous awards for its products, business, and workplace culture. For more information, visit lucidchart.com.
Related articles
8 best practices for collaborating in Lucidchart
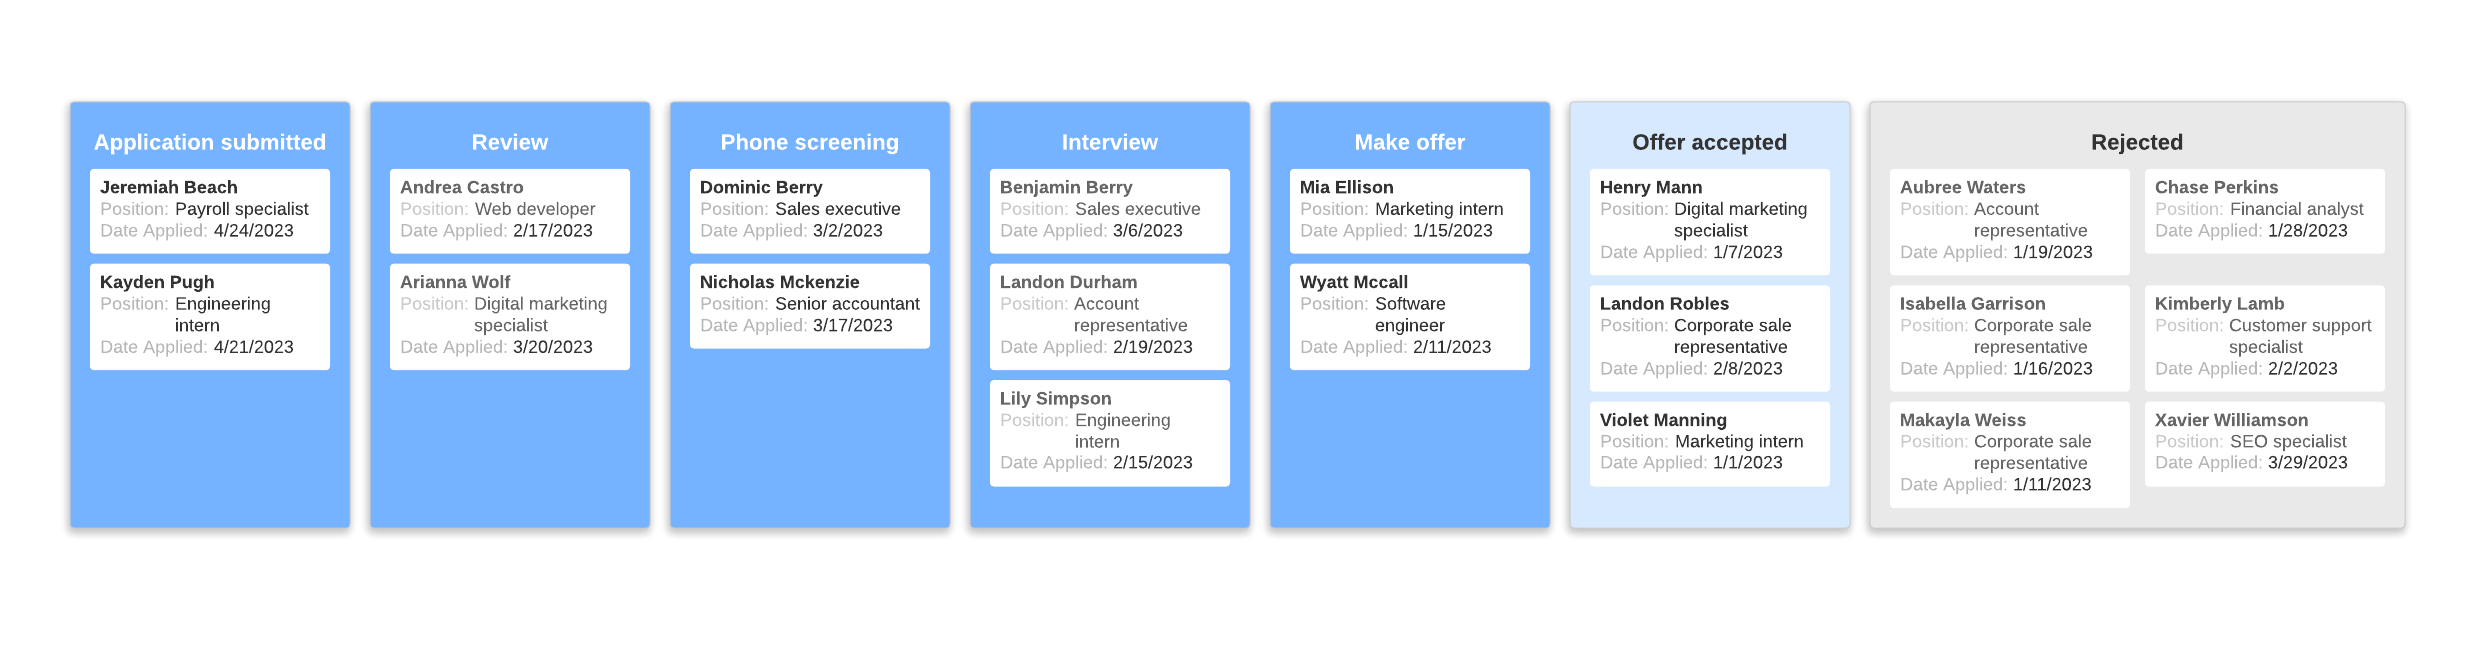
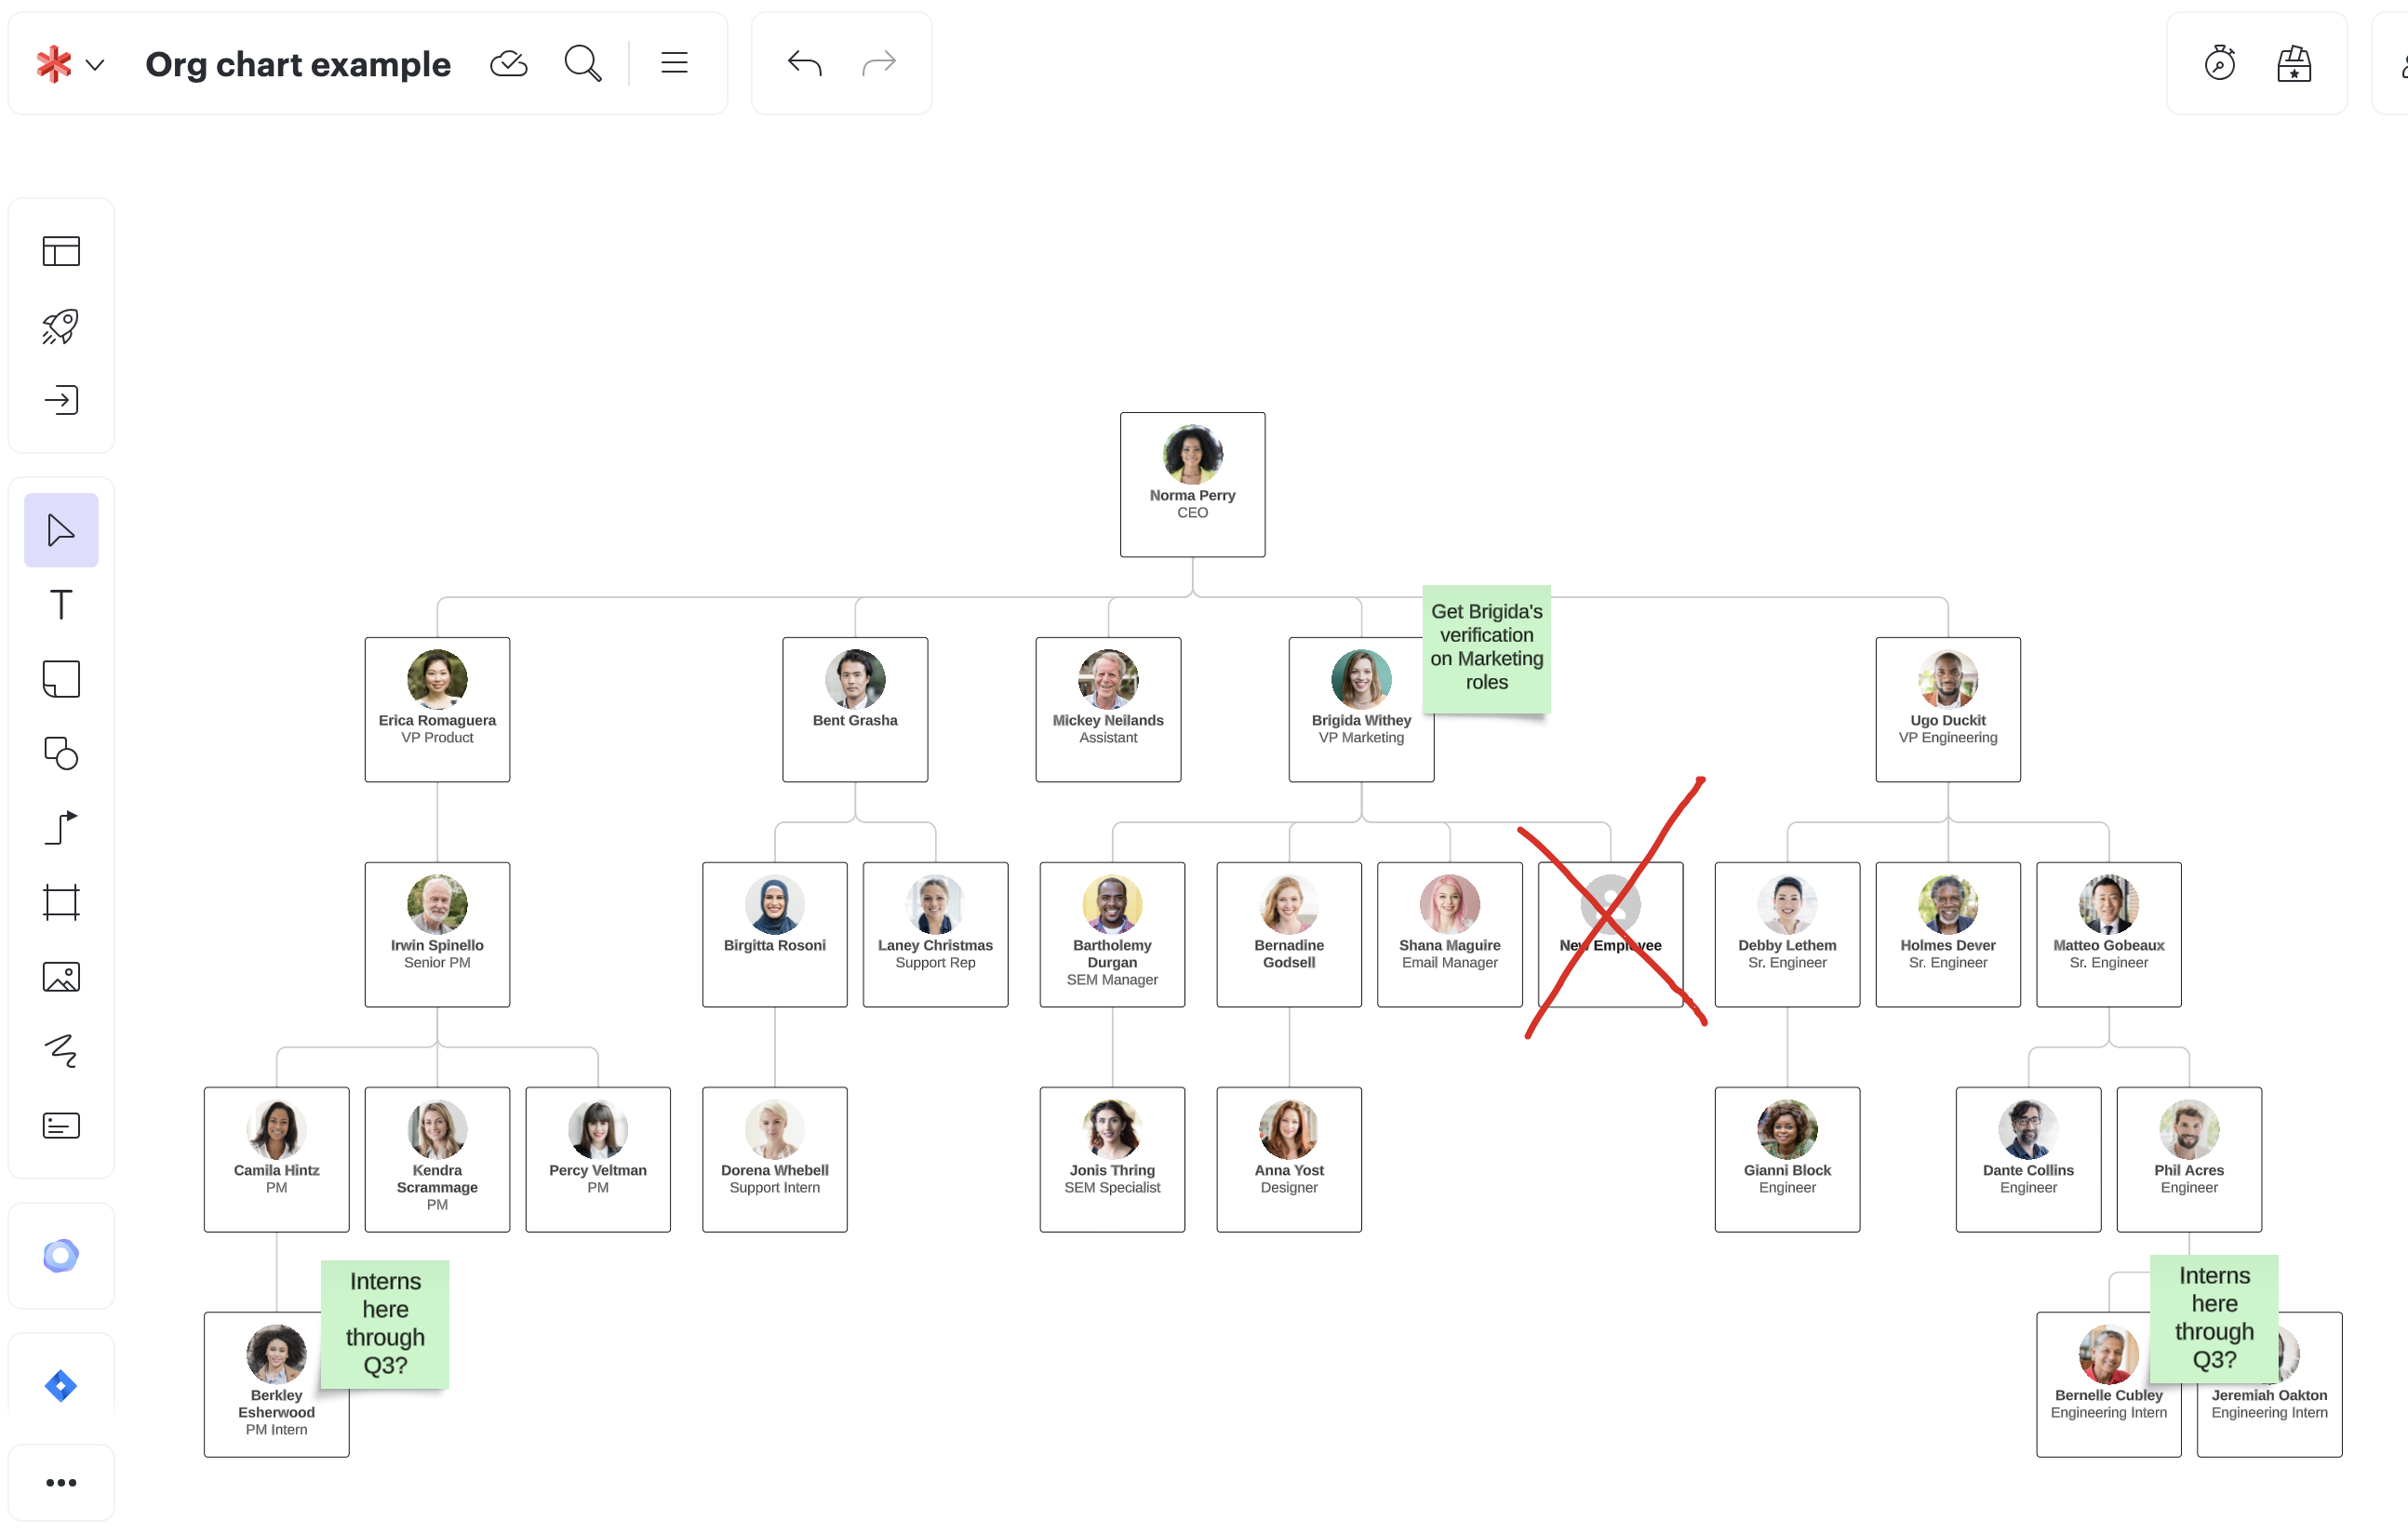
Whether you are improving a process, creating an org chart, or trying to stay aligned with your team as you work remotely, Lucidchart is the place for effective visual collaboration.
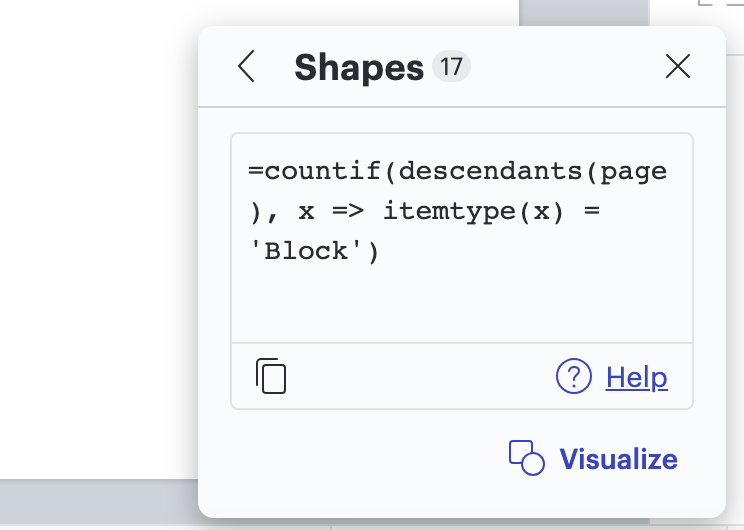
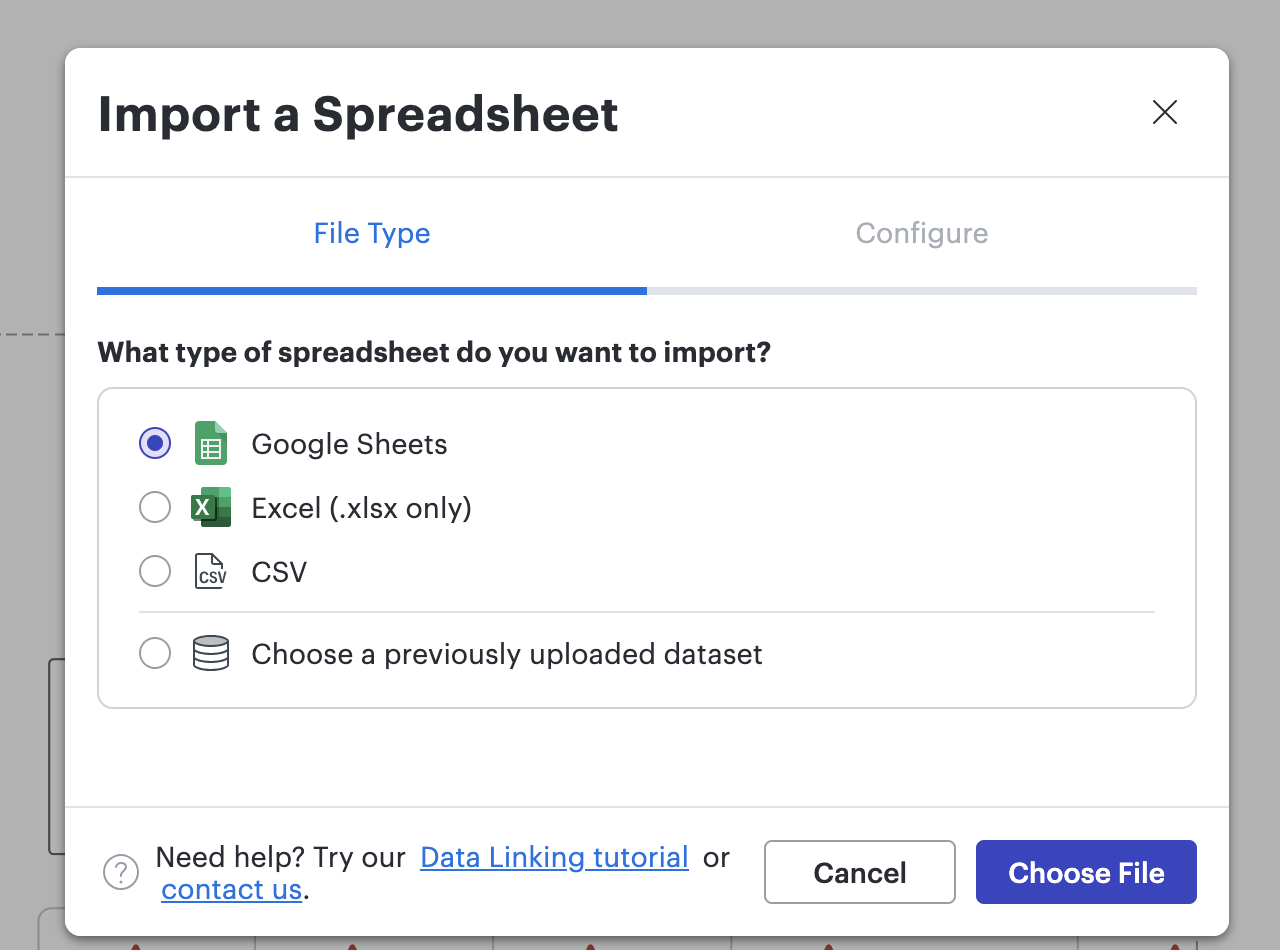
Create diagrams faster using automation features in Lucidchart
Working visually shouldn’t mean more work for you. Find out how to automate your diagramming with Lucidchart to help your teams do more faster.
Next-gen diagramming: The difference between good vs. great diagramming software
Don’t settle for subpar diagramming software. Learn what characteristics differentiate run-of-the-mill diagramming solutions from next-gen ones.
Level up your diagramming with conditional formatting [+course]
Gain insight into your data in Lucidchart like never before with conditional formatting. Includes a free course!
Bring your bright ideas to life.


By registering, you agree to our Terms of Service and you acknowledge that you have read and understand our Privacy Policy.