The value of making project roadblocks visual (and how to do it)

Reading time: about 6 min

Topics:

  • Process improvement
  • Project management

It’s a project manager’s job to keep projects moving smoothly and efficiently between tasks and stakeholders. But hidden roadblocks can quickly throw a project off track, creating headaches for managers, teams, and stakeholders alike.

Roadblocks can include anything from poor communication and lack of resources to bottlenecks in task dependencies. And even small roadblocks can have a significant impact on the project’s progress.  

That’s why identifying these potential roadblocks early is crucial to a project’s success. After all, you can’t fix what you don’t know is broken. 

Identifying roadblocks quickly enables you to steer around them instead of stumbling into them and grappling to get back on course. The faster you can identify the problem, the faster you can solve it—and the better chance you have of getting the project over the finish line on time and on budget.

So how can you recognize a roadblock before you hit one? 

A simple way to identify project roadblocks quickly is to make those roadblocks visual. Here’s how: 

The value of making project roadblocks visual

People process visuals 60,000 times faster than text. This is partly because the human brain decodes elements of an image simultaneously, while language is decoded linearly and sequentially—taking more time to process.

This is why visualizing your project's roadblocks can be such a powerful exercise. Visualizing your project roadblocks allows you to absorb the information more quickly while making it easier to see where those roadblocks actually are. And the better you can see what challenges lie ahead, the more prepared you’ll be to navigate them successfully.

Plus, visualizing problems—rather than just talking about them or writing them down—helps you remember the information better. For instance, if you hear a piece of information, you’ll remember 10% to 20% of it three days later. But if the information is visual, you’ll remember 65% of it. 

So transforming your project plans and any potential roadblocks into visuals will help everyone involved understand the information faster and retain it longer—keeping everyone on the same page and moving in the right direction. 

How to make project roadblocks visual

Considering potential roadblocks is a core part of the project planning process. This is the time to plan the project requirements and goals, what resources and budget you’ll need, who will be involved, and how they will get it done. 

By planning out all the moving parts, you’ll begin to see key dependencies, priorities, and gaps in the processes that need to be addressed to ensure a smooth project. 

Use these tips to help you uncover potential roadblocks through project visualization. 

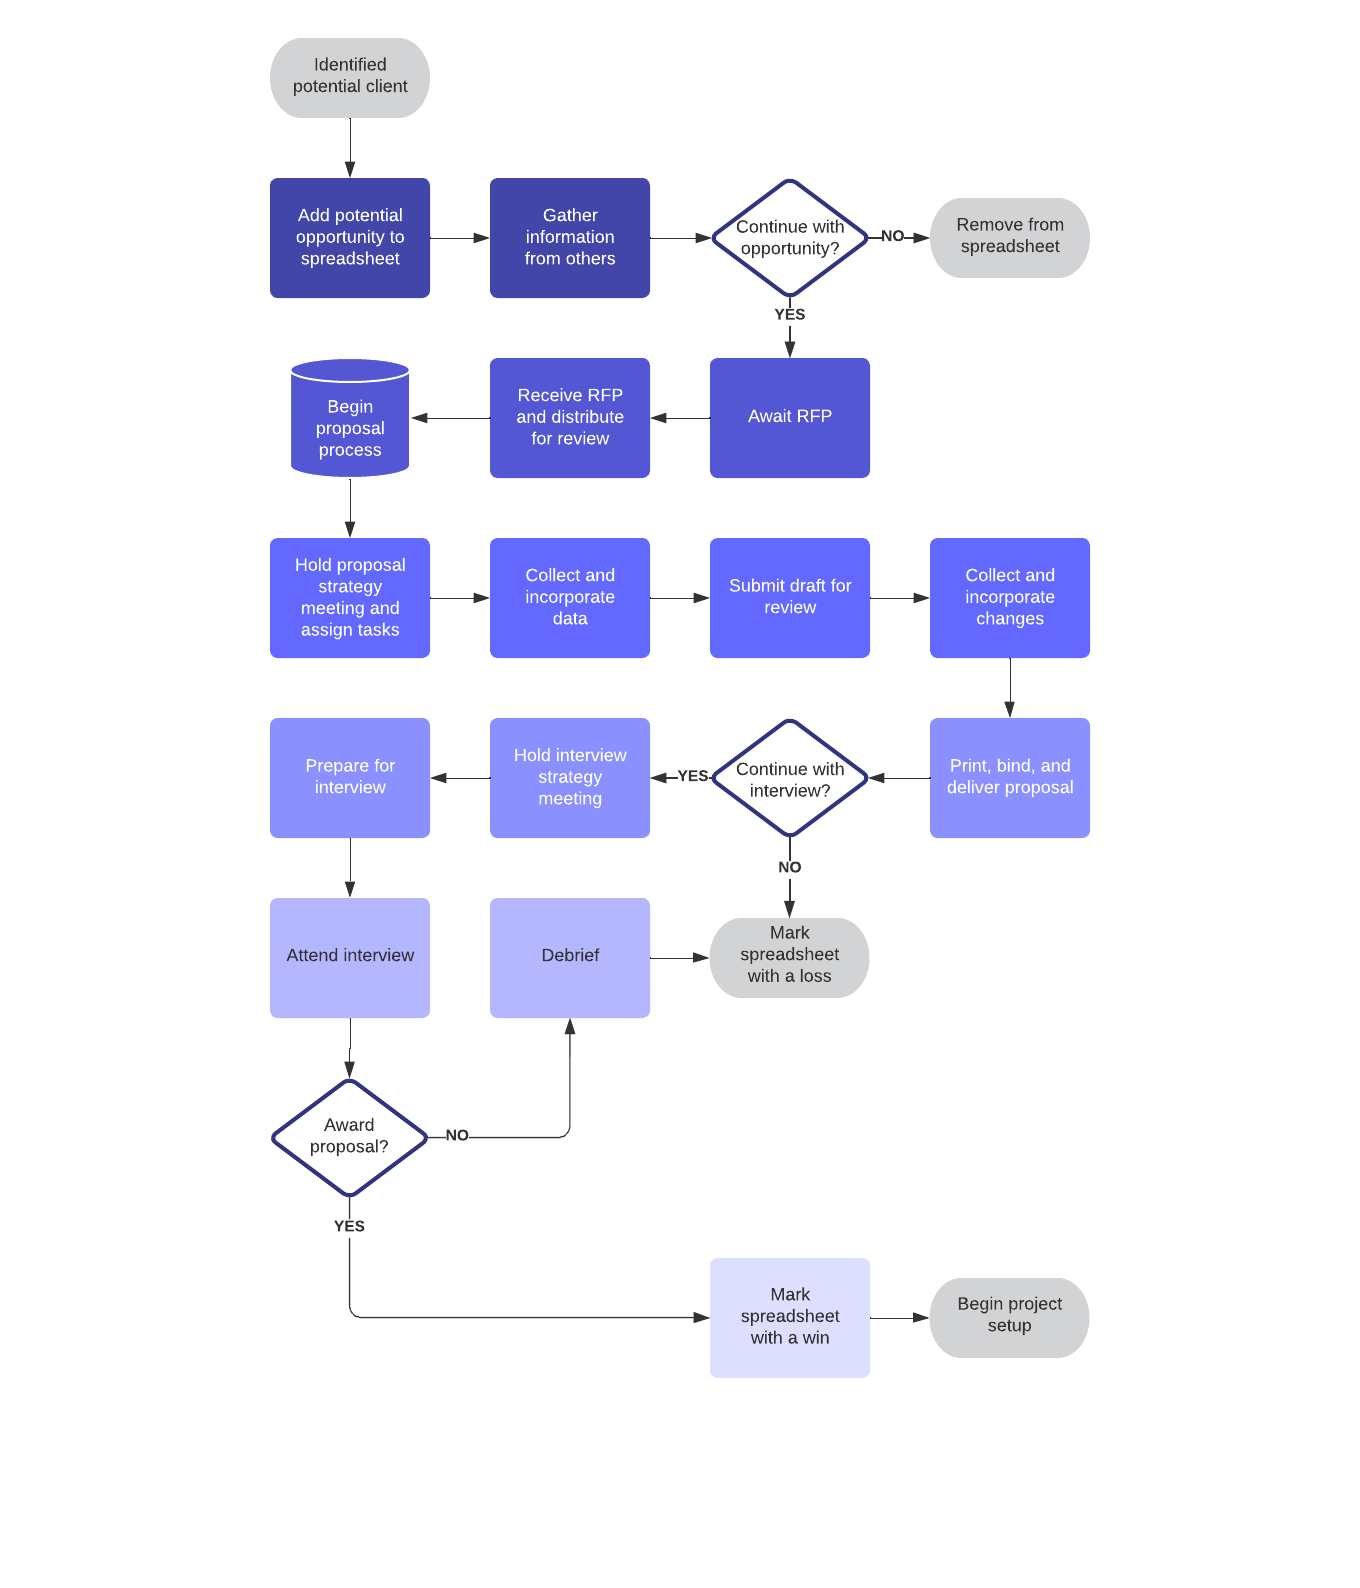
Map out projects and processes 

The first step is to map out your entire project and break it down into steps. As you map out your project and all its processes, you’ll begin to see how each step relates and uncover potential challenges and roadblocks within those processes.  

Here are a few visuals you can use to map out your project and uncover roadblocks: 

  • Risk breakdown structure

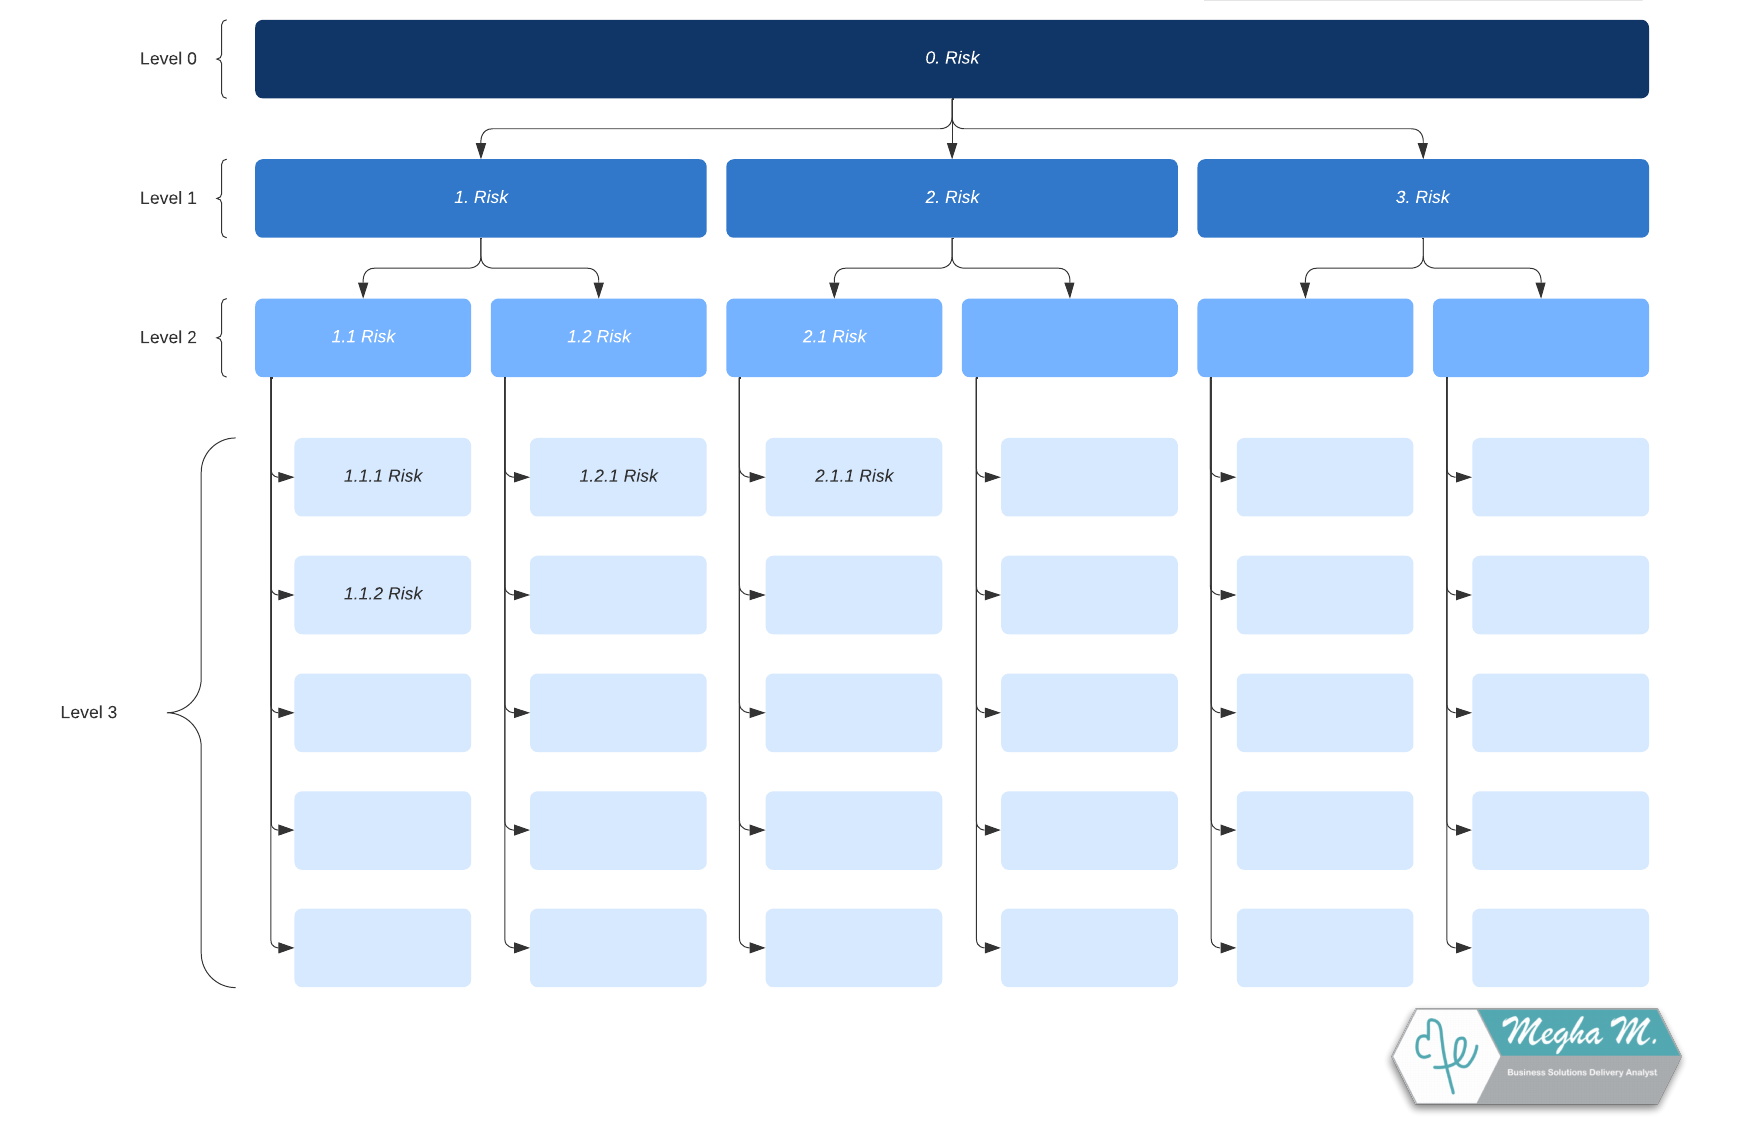
A risk breakdown structure lists out potential risks in a project and organizes them visually in a chart based on level of detail, starting with the high-level risks at the top and working down to more granular risks at the bottom. 

Sit down with your team to brainstorm potential risks that may arise and visualize them with a risk breakdown structure template. From there, you can add the risks to a project risk log to monitor and assess threats to your project.    

project roadblocks
Risk breakdown structure template (click on image to modify online)
  • Gantt chart

A Gantt chart is a bar chart that visualizes a project from start to finish. It maps out the project schedule on a timeline. This is a powerful tool because it can help project managers see how a project’s tasks relate to one another, identify potential gaps or roadblocks, and plan contingencies to address them. 

Gantt charts are especially useful for more complex projects that have multiple overlapping timelines and dependencies. By visualizing these relationships and accountabilities, project managers can better estimate timelines and corresponding budget needs—two of the most common roadblocks leaders face.

project roadblocks
Gantt chart example (click on image to modify online)
  • Process map

A process map diagrams the complex processes that make up each project deliverable. While the Gantt chart visualizes tasks and timelines on a macro level, a process map is where you can delve deeper into more granular workflows and thus uncover more potential roadblocks within your project. Meet with your team to discuss their responsibilities within the project and flesh out a detailed map of their tasks. 

project roadblocks
Business process map example (click on image to modify online)
  • Stakeholder map

Stakeholders can make or break a project, so it’s important to understand who your project stakeholders are, what level of impact and influence they have on the project, and the level of communication they will need. 

A stakeholder map can help you conduct a thorough stakeholder analysis and visualize these important dynamics. This will help you understand your stakeholder landscape and create a plan to manage them so you can avoid roadblocks down the line. 

project roadblocks
Stakeholder map example (click on image to modify online)

Visualizing your project at both a high level and a granular process level, can help you see the risks, gaps, and weaknesses in your project plans from start to finish. Use the visuals above to forecast roadblocks before they happen so you can address them upfront in your project plans and minimize disruption once the project is underway.   

Use visual collaboration software 

While you can map out your processes and visualize your plans by hand, that is time consuming, error-prone, and less convenient than collaboration software. 

Visual collaboration software makes communicating ideas visually second nature. With built-in features and templates, you’ll be able to easily map your projects, identify the roadblocks, share information with your team, and come up with solutions all in one place. 

The Lucid Visual Collaboration Suite 

Enable real-time collaboration through the Lucid Visual Collaboration Suite.  

Lucidchart’s intelligent diagramming solution helps you map out your projects and processes and collaborate on those maps in real time. With Lucidchart, your whole team can access a single source of truth so everyone is on the same page from the get-go.

Lucidchart makes it easy to uncover roadblocks and visualize solutions with its intuitive dashboard and easy-to-use drag and drop features. With more than 1,000 ready-made templates, you don’t have to map your project from scratch—simply plug in your data and start identifying your roadblocks right away. 

Once you have identified your project roadblocks and mapped your plans, use Lucidspark to brainstorm solutions. Lucidspark is a virtual whiteboard that gives teams the space to problem-solve and put their ideas into action. 

Identify your roadblocks with Lucidchart and visualize your solutions with Lucidspark for a seamless end-to-end collaboration process. 

Don’t let the future take you by surprise

The better you understand the potential roadblocks in your project, the better you can plan for and around them. Visualizing your roadblocks through project maps, stakeholder analysis, process workflows, and risk management plans can help you forecast potential risks and navigate roadblocks before they threaten your project. 

project roadblocks

Start visualizing your roadblocks with templates today.

Go to template gallery

About Lucidchart

Lucidchart, a cloud-based intelligent diagramming application, is a core component of Lucid Software's Visual Collaboration Suite. This intuitive, cloud-based solution empowers teams to collaborate in real-time to build flowcharts, mockups, UML diagrams, customer journey maps, and more. Lucidchart propels teams forward to build the future faster. Lucid is proud to serve top businesses around the world, including customers such as Google, GE, and NBC Universal, and 99% of the Fortune 500. Lucid partners with industry leaders, including Google, Atlassian, and Microsoft. Since its founding, Lucid has received numerous awards for its products, business, and workplace culture. For more information, visit lucidchart.com.

Bring your bright ideas to life.

Sign up free

or continue with

Sign in with GoogleSign inSign in with MicrosoftSign inSign in with SlackSign in

Get started

  • Pricing
  • Individual
  • Team
  • Enterprise
  • Contact sales
PrivacyLegal

© 2024 Lucid Software Inc.