what is a cluster diagram

The Zen of Cluster Diagrams

Reading time: about 2 min

Posted by: Shannon Williams

Stressed about all the facts you need to recall for an upcoming exam?

Having a hard time making sense of your brainstormed ideas after the fact?

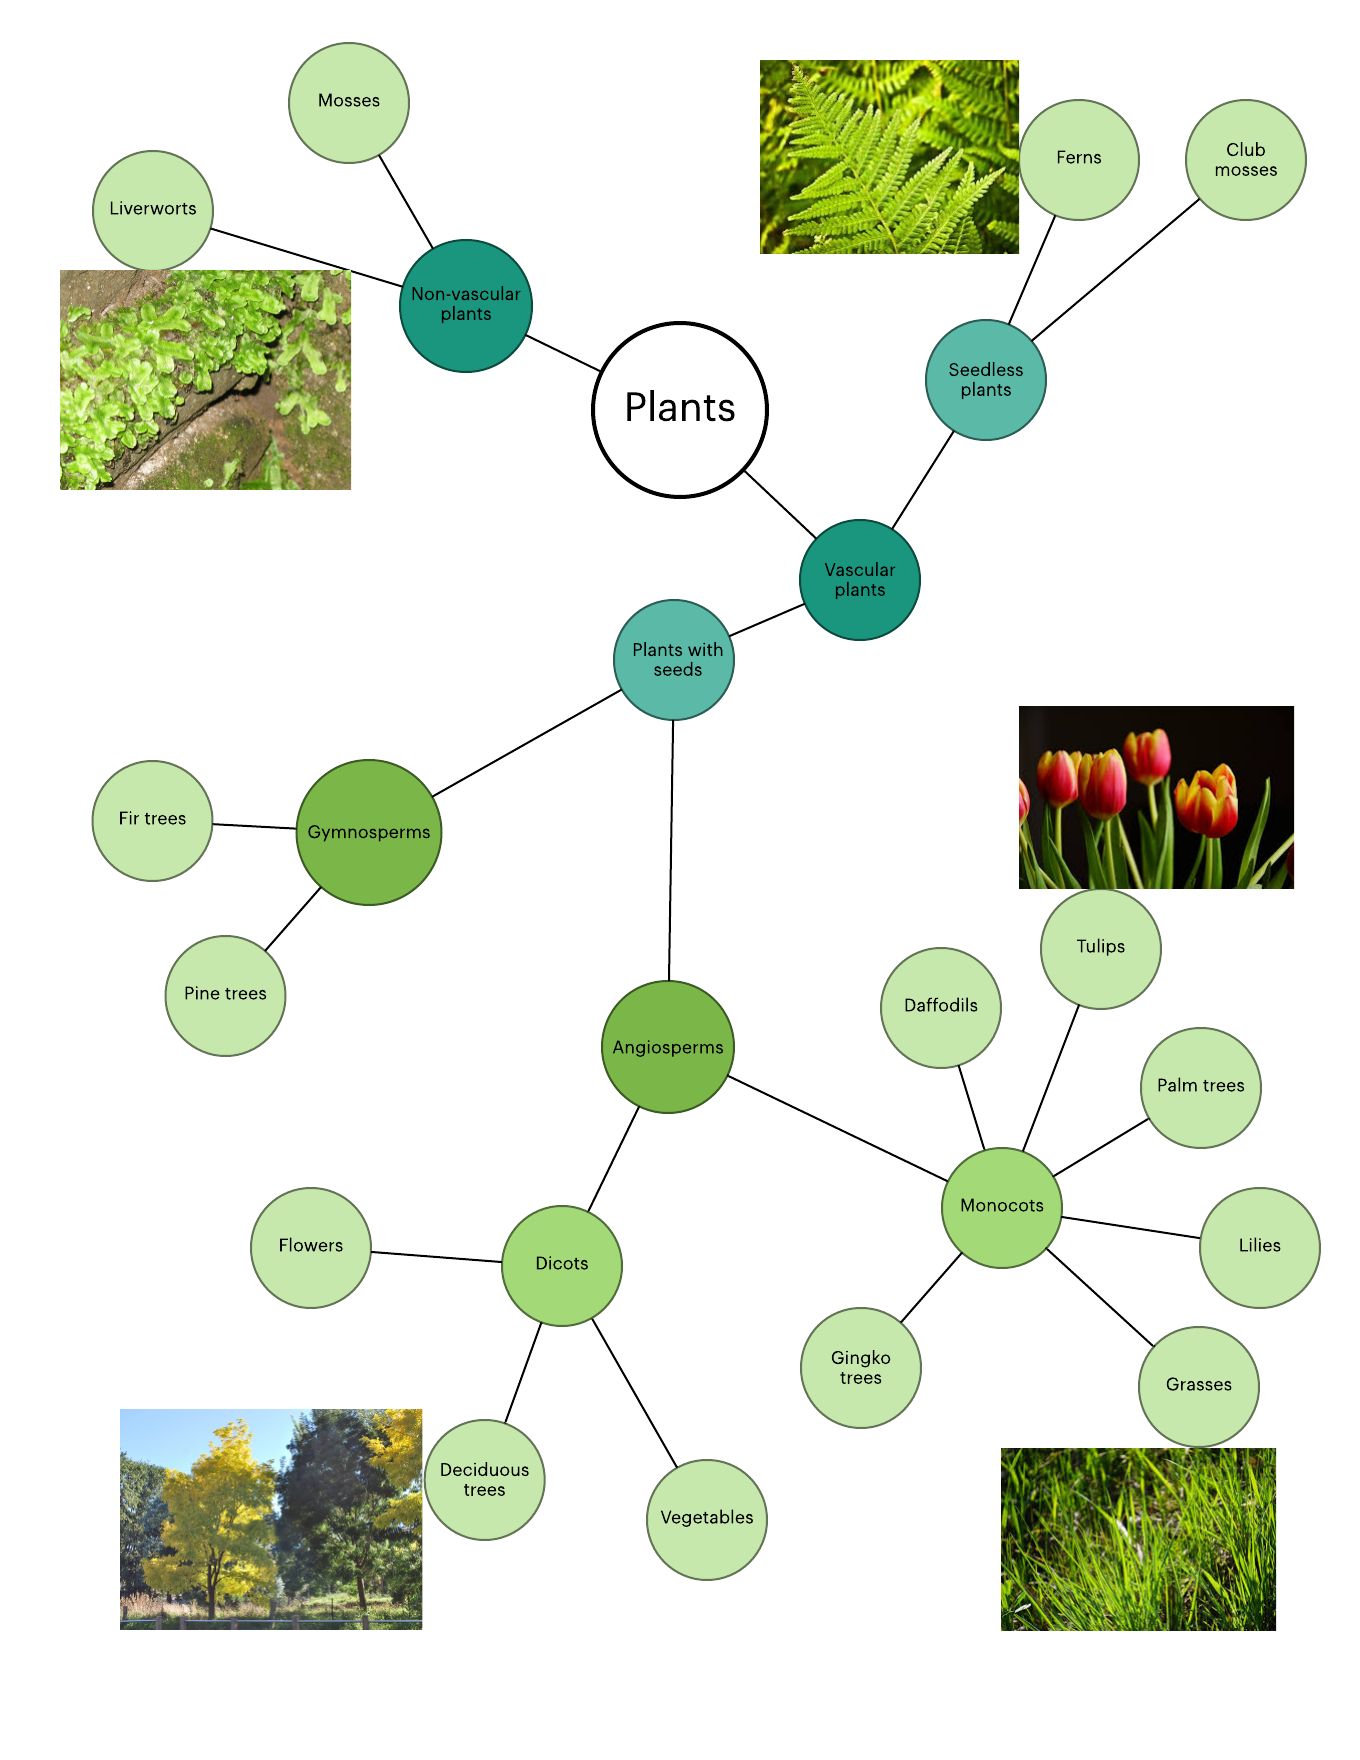
Cluster diagrams organize the information of your life. Learn how you create one, with or without our handy cluster diagram template.

blank cluster diagram template
Blank Cluster Diagram Template (Click on image to modify online)

What is a cluster diagram?

In a broader sense, a cluster diagram is exactly what you would expect from the name. This type of diagram represents some sort of cluster, ideas or objects that are positioned closely together.

For the purpose of this article, we’ll refer to the cluster diagrams used for brainstorming, also known as cloud diagrams. Similar to a mind map, a cluster diagram is a non-linear graphic organizer that begins with one central idea and branches out into more detail on that topic.

The term “cluster diagram” can also refer to these other types of visuals (that we won’t discuss at length in this article):

  • In astronomy, a diagram that shows the magnitude, luminosity, color, temperature, and other qualities of star clusters, galaxy clusters, or globular clusters
  • In computer science, complex diagrams that display computer networks, systems, and architecture (if you’re interested in this type, see our network diagram templates)
  • In architecture, a diagram that compares structures

How to create a cluster diagram

Add some power to your brainstorming session or organize the information you’ve been studying in school—with a cluster diagram, the possibilities are endless. Whether on paper or online, follow the steps below to create your own.

Remember that Lucidchart is the easiest way to build a cluster diagram online and share your thoughts with others! Sign up for your free account today—you can start with our free cluster diagram template, or it’s just as easy to drag and drop the shapes you need into the editor.

  1. Start with your main idea or topic in the middle.
  2. Add subtopics or categories branching off your main idea.
  3. Add ideas or information under each subtopic/category to form clusters. You can go as many levels deep as you need to. In our plant classification example below, we started with broad classifications of plants (vascular and non-vascular plants) and became more specific as we got deeper into the diagram.
  4. Color code your diagram. You can use colors to distinguish different branches or levels of your diagram. In the example below, we put specific examples of plants all in the same color.
plant classification cluster diagram
Plant Classification Cluster Diagram (Click on image to modify online)

Note: If you have a Lucidchart Pro, Team, or Enterprise account, you can speed up this process further by using the mind map shape library.

Get creative and see how you can use cluster diagrams to visualize ideas and information. Lucidchart allows you to customize your diagram to work for a variety of purposes.

Sign up for free!

About the author

Shannon Williams profile picture

Shannon Williams graduated from BYU in English and then turned to the world of marketing. She works as a content marketing specialist at Lucid Software. Instead of writing her novel (like she should be), Shannon spends her free time running, reading, obsessing about Oscar season, and watching Gilmore Girls on loop.

Start diagramming with Lucidchart today—try it for free!

Sign up free

Popular now

how to make a flowchart in google docsHow to make a flowchart in Google Docs

Sign up to get the latest Lucidchart updates and tips delivered to your inbox once a month.

Subscribe to our newsletter

About Lucidchart

Lucidchart is the intelligent diagramming application that empowers teams to clarify complexity, align their insights, and build the future—faster. With this intuitive, cloud-based solution, everyone can work visually and collaborate in real time while building flowcharts, mockups, UML diagrams, and more.

The most popular online Visio alternative, Lucidchart is utilized in over 180 countries by millions of users, from sales managers mapping out target organizations to IT directors visualizing their network infrastructure.

Related posts:

Mind map templates and examples

mind map templates

Mind Mapping as a Tool for the Writing Process

Mind Mapping for Writing

Get started

  • Pricing
  • Individual
  • Team
  • Enterprise
  • Contact sales
PrivacyLegalCookies

© 2023 Lucid Software Inc.