In the Unified Modeling Language (UML), deployment diagrams show how elements of software and hardware are connected to one another. Since they can describe hardware, deployment diagrams are unique in the UML world. Read this tutorial for a quick explanation of how to draw these diagrams and then start working in Lucidchart.
3 minute read
Do you want to create your own UML diagram? Try Lucidchart. It's fast, easy, and totally free.
How to create a deployment diagram in UML
If you haven’t already, we recommend that you review our deployment diagrams tutorial before you begin diagramming. Reviewing these items will make it easier for you to draw a deployment diagram of your own. After you understand how deployment diagrams work, continue on to make your own deployment diagram in UML.
Get started with Lucidchart
The first step to creating an incredible UML diagram is to sign up for Lucidchart. Lucidchart offers an intuitive interface, premade templates, and extensive shape libraries, so creating complex deployment diagrams won’t be an issue.
Once you have logged into Lucidchart, create a new blank document and enable the UML shape libraries. Click on "Shapes" in the upper-left corner of your screen and check “UML” in the menu that appears. Now all of Lucidchart’s UML shapes will be available to the left of the canvas.
Do you want to create your own UML diagram? Try Lucidchart. It's fast, easy, and totally free.
Create a UML DiagramIdentify components
Deployment diagrams can serve several purposes, all of which relate to hardware. Some of these functions include:
-
Capturing runtime processing for hardware elements.
-
Illustrating the general topology for a given hardware system.
-
Demonstrating how certain software components are deployed by specific hardware components.
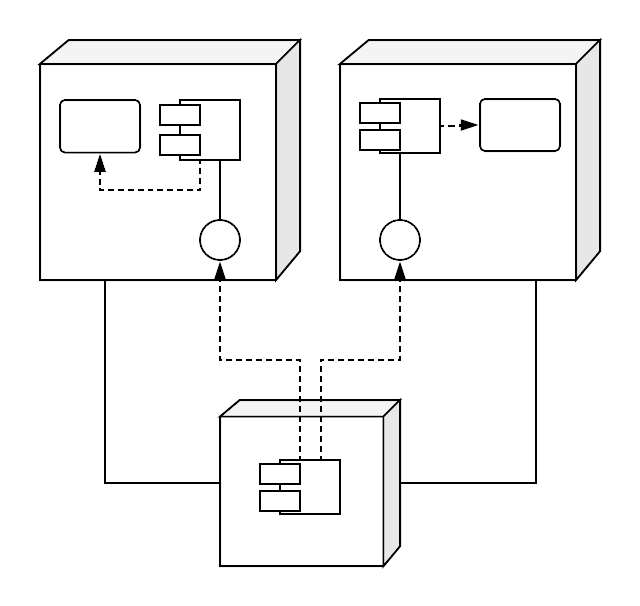
Once you’ve identified the purpose of your deployment diagram, you will need to determine the elements within. The principal elements of any deployment diagram are nodes. These large 3D boxes symbolize the elements that deploy objects. The objects contained in boxes—such as stereotypes, artifacts, and components (a component is illustrated in the example below)—are the objects that are being deployed.
Lines from node to node indicate either relationships between nodes or relationships between the messages they send out. Note that deployment diagrams can achieve a high level of complexity—for example, depending on the pattern of deployment you are trying to express, you might have one node contained in another node. It may be helpful to start with a list that clearly denotes the nodes you wish to display and their interrelationships.
Add shapes
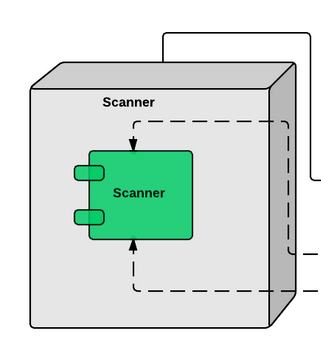
Turn on the UML shape libraries to begin drawing your diagram in Lucidchart. Within the UML deployment shape library, drag out your first symbol: a node. Label it and choose which shapes should be contained within the node. You could add an artifact, a component, an instance, or a basic object. The example to the right shows a component contained by the node. You can easily add, delete, or swap out elements in the node. To relabel any element with a different name, simply click and type.

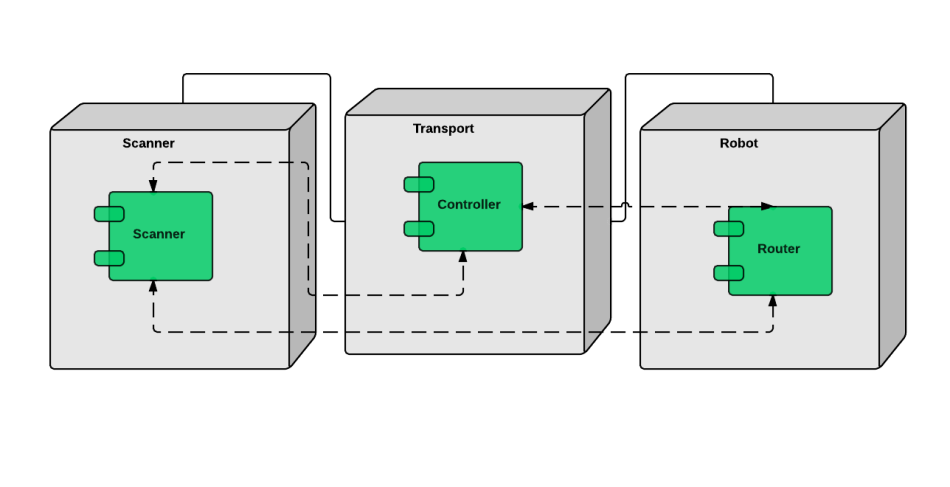
After adding your first node, add and label more nodes until you have completed the structure of your diagram. Then add the component shapes that will be deployed into the node boxes.
Connect nodes
After that, you’re ready to connect the two nodes. To add a line, drag your mouse from the red circle that appears when you hover over the shape and connect it to the appropriate shape.
Format arrows
When you draw relationships between elements inside the nodes, you will likely need to illustrate more complex connections. The Lucidchart editor allows you to change the style and arrows on each line to show a unique type of relationship. Just use the properties bar above the canvas.

Complete your diagram
Add lines and nodes until you have finished describing the system. Feel free to add different colors to your diagram to make the content more accessible.
Publish, implement, and share
Congratulations! You have now completed your deployment diagram. After you finish, you can publish and share your deployment diagram with the team to use as a quick reference or to speed up the onboarding process. To share your document with collaborators, either Lucidchart users or non-users, click the orange "Share" button in the top-right corner of your screen. From this same menu, you can easily post your diagram to social media.
To download your diagram, click on File > Download As and choose the file type that you want. By downloading your document, you can circulate the diagram without worrying that others will make unauthorized changes. Publishing and sharing your diagrams is incredibly easy with Lucidchart. See for yourself!