What is a UML component diagram?
The purpose of a component diagram is to show the relationship between different components in a system. For the purpose of UML 2.0, the term "component" refers to a module of classes that represent independent systems or subsystems with the ability to interface with the rest of the system.
There exists a whole development approach that revolves around components: component-based development (CBD). In this approach, component diagrams allow the planner to identify the different components so the whole system does what it's supposed to do.
More commonly, in an OO programming approach, the component diagram allows a senior developer to group classes together based on common purpose so that the developer and others can look at a software development project at a high level.
Master the basics of Lucidchart in 3 minutes
- Create your first diagram from a template or blank canvas or import a document.
- Add text, shapes, and lines to customize your diagram.
- Learn how to adjust styling and formatting.
- Locate what you need with Feature Find.
- Share your diagram with your team to start collaborating.
Benefits of component diagrams
Though component diagrams may seem complex at first glance, they are invaluable when it comes to building your system. Component diagrams can help your team:
-
Imagine the system’s physical structure.
-
Pay attention to the system’s components and how they relate.
-
Emphasize the service behavior as it relates to the interface.
How to use component diagrams
A component diagram in UML gives a bird’s-eye view of your software system. Understanding the exact service behavior that each piece of your software provides will make you a better developer. Component diagrams can describe software systems that are implemented in any programming language or style.
UML is a set of conventions for object-oriented diagrams that has a wide variety of applications. In component diagrams, the Unified Modeling Language dictates that components and packages are wired together with lines representing assembly connectors and delegation connectors. To learn more about UML and its uses, check out our guide, "What Is UML?"

Component diagram shapes and symbols
Component diagrams range from simple and high level to detailed and complex. Either way, you'll want to familiarize yourself with the appropriate UML symbols. The following are shape types that you will commonly encounter when reading and building component diagrams:
| Symbol | Name | Description |
|---|---|---|

| Component symbol |
An entity required to execute a stereotype function. A component provides and consumes behavior through interfaces, as well as through other components. Think of components as a type of class. In UML 1.0, a component is modeled as a rectangular block with two smaller rectangles protruding from the side. In UML 2.0, a component is modeled as a rectangular block with a small image of the old component diagram shape. |

| Node symbol |
Represents hardware or software objects, which are of a higher level than components. |

| Interface symbol |
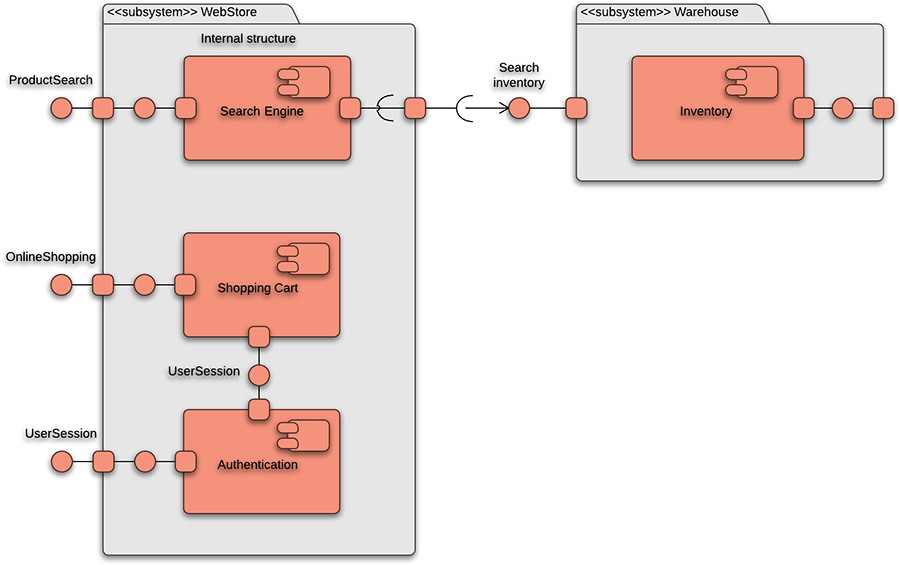
Shows input or materials that a component either receives or provides. Interfaces can be represented with textual notes or symbols, such as the lollipop, socket, and ball-and-socket shapes. |

| Port symbol |
Specifies a separate interaction point between the component and the environment. Ports are symbolized with a small square. |

| Package symbol |
Groups together multiple elements of the system and is represented by file folders in Lucidchart. Just as file folders group together multiple sheets, packages can be drawn around several components. |

| Note symbol |
Allows developers to affix a meta-analysis to the component diagram. |

| Dependency symbol |
Shows that one part of your system depends on another. Dependencies are represented by dashed lines linking one component (or element) to another. |
How to use component shapes and symbols
There are three popular ways to create a component's name compartment. You always need to include the component text inside the double angle brackets and/or the component logo. The distinction is important because a rectangle with just a name inside of it is reserved for classifiers (class elements).
As with the class notation, components also have an optional space to list interfaces, similar to the way you add attributes and methods to class notation. Interfaces represent the places where the groups of classes in the component communicate with other system components. An alternative way to represent interfaces is by extending symbols from the component box. Here is a quick rundown of the most commonly used symbols.
 |
Provided interfaces: A straight line from the component box with an attached circle. These symbols represent the interfaces where a component produces information used by the required interface of another component. |
 |
Required interfaces: A straight line from the component box with an attached half circle (also represented as a dashed arrow with an open arrow). These symbols represent the interfaces where a component requires information in order to perform its proper function. |
In UML, a component diagram visually represents how the components of a software system relate to one another. To build one, try using Lucidchart’s custom component diagram shape library. Component diagrams should communicate:
-
The scope of your system
-
The overall structure of your software system
-
Goals that the system helps human or non-human entities (known as actors) achieve
Component diagram examples
UML component diagrams bring simplicity to even the most complex processes. Take a look at the examples below to see how you can map the behaviors of specific processes with component diagrams in UML.
Component diagram for a library management system
Library systems were some of the first systems in the world to become widely run by computers. Today, many of these systems are managed in the cloud by third-party services, rather than internally. Though the term “library system” typically calls to mind a way to monitor printed books, library systems today organize all kinds of data checked in and checked out by users.
These transactions create a network of relationships between the components of the library system. To understand how these relationships work and how the system functions overall, examine the UML diagram below. You or your team can also use this diagram as a template.

Click here to use this template
Component diagram for an ATM system
A component diagram is similar to a class diagram in that it illustrates how items in a given system relate to each other, but component diagrams show more complex and varied connections that most class diagrams can.
In the diagram below, each component is enclosed in a small box. The dotted lines with arrows show how some components are dependent on others. For example, the card reader, web page, client desktop, and ATM system are all dependent on the bank database. The dotted lines with circles at the end, known as “lollipop” symbols, indicate a realization relationship.

How to create a component diagram in UML
Component diagrams can be complicated, so it's important to understand the basics of UML diagramming. If you haven’t already, review our component diagram tutorial, along with this guide on UML basics. After reviewing these pages, you'll have a firm grasp on the underlying principles of UML and component diagrams.
1. Get started with Lucidchart
To begin, register for a Lucidchart account and create a new document. You may need to enable the UML shape libraries in Lucidchart. To enable these shapes, click on the “Shapes” icon in the top-left section of the editor. Then, check the “UML” box to enable all UML shape libraries. These shapes will now appear to the left of the canvas.
2. Add shapes
Component diagrams center around the component shape, which is clearly labeled in the toolbox. Drag it onto the canvas, and then click and type to add a label. Lucidchart allows you to resize all of its shapes, as well as reformat shapes with different fonts and colors, from the dock on the right and the properties bar at the top.

Outline the structure of your system
Continue adding component shapes until each major functional unit in your system or application is fully represented. It's helpful to break down components into their most granular groupings, in order to easily rearrange, understand, and update the document at a later time. Since all component diagrams consist of larger and smaller groupings, it's fine to nest components inside a frame, package, or larger component shape.

Add interfaces
Add interfaces to each component, either with written notes or symbols. An interface models the what and how of input and output. For example, a component may receive information from another component or deliver services to an end user. Interfaces show how that process occurs; they can also help your team see any problems that were previously overlooked.
UML notation allows for two ways to list provided and required interfaces: through a secondary compartment in a component shape, or via lollipop and socket symbols that lead to and from the component. Lollipop shapes represent provided interfaces and socket symbols model required interfaces. If you opt to draw these symbols, you should use them in conjunction with dependency arrows (which are used in notation for many UML charts, like class and deployment diagrams.) To indicate dependencies—situations where one component or node is dependent on another—draw a dashed line that ends in an arrow.
Add ports
It may be necessary to supplement component with ports, which show a distinct interaction point between the component and its environment. Ports are represented as small squares on the side of a component shape. You can add labels to each port by dragging out a text shape and typing inside it. Components and ports—along with other elements in the diagram—may be connected with dependencies and a few more interface symbols, if needed.
Add nodes
Round out your chart by adding nodes that are present in the system or application being modeled. These look like three-dimensional boxes and are meant to represent computational resources—including PCs, printing devices, and servers—that execute commands from UML artifacts.
3. Publish, implement, and share
To download your diagram, simply click on File > Download As and select the file type that fits your needs. Distribute your component diagram without worrying that others will make unauthorized changes.
For a more dynamic experience, share your component diagram with collaborators so they can make the changes that they deem necessary. To share the document with either Lucidchart users or non-users, click on the orange "Share" button in the upper-right corner of your window. From this menu, you can adjust the editing permissions of each person, generate links to the document, and share on social media.
Component diagrams in Lucidchart
In Lucidchart, you can easily craft an intricate component diagram in UML from scratch. Just follow the steps below:
-
Open a blank document or start with a template.
-
Enable the UML shape library. Click "Shapes" on the left side of the editor, check "UML" in the Shape Library Manager, and click "Save."
-
Select the shape you want from the library you added, and drag the shape from the toolbox to the canvas.
-
Model the process flow by drawing lines between shapes.