
Value stream mapping can be incredibly useful in various industries. If you're a novice to using value stream mapping software like Lucidchart, you'll find that this guide covers all you need to know about the definition, history, and uses of value stream mapping, along with step-by-step instructions for conducting your own value stream analysis.
12 minute read
Want to make a Diagram of your own? Try Lucidchart. It's quick, easy, and completely free.
What is value stream mapping?
Value stream mapping is a flowchart method to illustrate, analyze and improve the steps required to deliver a product or service. A key part of lean methodology, VSM reviews the flow of process steps and information from origin to delivery to the customer. As with other types of flowcharts, it uses a system of symbols to depict various work activities and information flows. VSM is especially useful to find and eliminate waste. Items are mapped as adding value or not adding value from the customer’s standpoint, with the purpose of rooting out items that don’t add value.

It’s important to keep in mind that customers, whether external or internal, care about the value of the product or service to them, not the efforts it took to produce it, or the value that may flow to other customers. Value stream mapping maintains that focus. A typical process is to draw a current state VSM and then model a better way with a future state and/or ideal state VSM. You can start off sketching by hand and then move to VSM software for better communication, analysis and collaboration.
VSM purpose and benefits
Value stream mapping is a powerful method to ferret out waste in any process, not just manufacturing. That’s its core purpose. You detail each significant process step and evaluate how it’s adding value—or not adding value—from the customer’s standpoint. That focus on value keeps the analysis targeted to what really matters, allowing the company to compete most effectively in the market. Foreseeing or facing any competitive threat, lean practitioners can make good use of VSM to produce the most value for the customer in the most efficient way possible. It can and should be used on an ongoing basis for continuous improvement, bringing better and better process steps on line. VSM allows you to see not only the waste, but the source or cause of the waste.
Value stream mapping, as with other good visualizations, serves as an effective tool for communication, collaboration and even culture change. Decision makers can clearly visualize the current state of the process and where waste is occurring. They can see problems like process delays, excessive downtime, constraints and inventory issues. And with the Future State and/or Ideal State VSM, they can see precisely how to improve.
Although its typical purpose is eliminating waste, VSM can also be seen from the perspective of adding value. After all, that’s what the customer cares about. Eliminating waste is the means to an end of creating value, such as a lower price and/or better-quality product or service. Value is something a customer is willing to pay for.
VSM caveats
While Value Stream Mapping is core to lean methods, it often requires a substantial investment of people and time to do it, and if not applied wisely, it can be wasteful in itself. You of course want profitable applications of value stream mapping.
It requires team members skilled in carrying out advanced VSM, and it may take days, weeks or even months to carry out some involved mapping projects. Think of it as a powerful tool central to lean methods, but not every circumstance lends itself to value stream mapping. You need to balance potential value with the work necessary to conduct the VSM.
You might choose to start small, with a limited focus and a limited budget, get the win and then move on to something more complex and potentially rewarding. Oftentimes, senior leaders may try to bite off something too large initially, and the effort may struggle due to its complexity and possible inexperience of the team.
Potential uses of more extensive VSM include:
- Cases involving multiple functional areas or departments.
- When a less detailed process map isn’t likely to uncover information you can act on.
- To make the case for a large investment that will result in much larger savings.
Remember, an improvement in one process step or in one part of production won’t always translate to a bottom line improvement. Often, a fuller look will be required.
However, keeping those caveats in mind, an individual could try VSM on a budget for a simple review that might produce results or at least help you to better understand VSM. After reading up on the basics (and you’re off to a good start with this article), you might just grab a pencil and legal-size pad, and armed with the step-by-step instructions listed later in this article, start mapping. You’ll map out the process steps, data for each step (such as cycle time), improvements you think you could make for an “ideal state,” and a summary showing how your improvements help each data point and overall value. Just keep in mind that this would be a tiny taste of what expert value stream mapping can accomplish.
Diagramming is quick and easy with Lucidchart. Start a free trial today to start creating and collaborating.
Make a diagramHow VSM is used in different fields
In manufacturing
: To find waste in the production process by analyzing each step of material handling and information flow. This is where lean methodology got its start in the 1950s at Toyota, and lean methods and value stream mapping remain key to manufacturing throughout the world. Of course, they have since spread to other fields and have become intertwined with Six Sigma methods and Lean Six Sigma.Supply chain and logistics
: To root out waste and costly delays at the various points on the supply chain leading to finished product.Software engineering/development
: To find inefficiencies in software development, from idea to implementation, including feedback loops and rework. Although some critics question the value of VSM in an agile development environment, others find it useful to gain efficiencies, such as reducing wait time between steps or reducing the need for rework.Service industries
: To improve the value and find waste in the activities required to carry out any service for external customers.Healthcare
: To improve the steps required to treat patients in the most effective, timely, cost-efficient, high-quality way possible.Office and administrative
: To find wasteful steps and improve the service provided within a business to internal customers.In value stream mapping, the process items that flow through the value stream are determined by the field. For example:
- In manufacturing industry, materials are your items.
- In the design and development field, designs are your items.
- In service field, external customer needs are your items.
- In the administration field, internal customer needs are your items.
VSM Symbols and Descriptions
VSM symbols vary in different places, but they fall into these four categories: process, material, information and general. The symbols can be complicated, although some simply imply their meaning in a layman's sense, such as a truck icon for external shipments and eyeglasses for something to go see. Here are some widely used symbols.
VSM process symbols/icons
| Symbol | Name | Description |
|---|---|---|
 | Customer/Supplier | Represents customer in upper right or supplier in upper left. |
 | Dedicated Process Flow | A fixed activity flow within a department. |
 | Shared Process | A process shared by other parts of the value stream. |
 | Data Box | Data about the process step, such as cycle time, change over time and uptime. |
 | Workcell | Indicates that multiple processes are being integrated in a manufacturing workcell. |
VSM material symbols
| Symbol | Name | Description |
|---|---|---|
 | Inventory | Inventory between two processes. |
 | Shipments | Movement of the raw materials from suppliers to the factory and then to customers. |
| Push Arrow | Pushing material from one process to the next. | |
 | Supermarket | An inventory “supermarket” (also called a kanban stockpoint). |
 | Material Pull | Removal of materials in a supermarket to downstream processes. |
 | FIFO Lane | First-In-First-Out inventory. |
 | Safety Stock | Inventory “hedge” against production problems. |
 | External Shipment | Shipments from suppliers or to the customers. |
VSM information symbols
| Symbol | Name | Description |
|---|---|---|
 | Production Control | A central production scheduling or control operation, department or person |
 | Manual Info | Shows the general flow of info from memos or conversation. |
 | Electronic Info | Such as EDI (electronic data interchange), the internet, WANs (wide area network), LANs (local area network) or intranets. |
 | Production Kanban | Triggers the production of a predetermined number of parts. This signals a supplying process to provide the parts to another downstream process. |
 | Withdrawal Kanban | A device or card that informs a material handler to transfer parts from a supermarket to the receiving process. |
 | Signal Kanban | Used when inventory levels between two processes drop to a minimum point. |
 | Kanban Post | A location where Kanban signals reside for pickup. |
 | Sequenced Pull | Gives orders to subassembly processes to produce a product without using a supermarket. |
 | Load Leveling | A tool that batches Kanbans in order to level production volume. |
 | MRP/ERP | Scheduling using ERP (Enterprise Resource Planning), MRP (Material Requirements Planning) or other centralized system. |
 | Go See | Gathering of information by observing. |
 | Verbal Information | Verbal information or information deemed personal. |
VSM general symbols
| Symbol | Name | Description |
|---|---|---|
 | Kaizen Burst | Attention-getting symbol highlights improvement needs to achieve the future state Value Stream Map. |
 | Operator | Number of operators required to process the VSM family for a particular workstation. |
 | Other | Other useful information. |
 | Timeline | Shows cycle times and wait/down times. Used for calculating Lead Time and Total Cycle Time. |
Along with the timeline symbol, there’s also the lean concept of takt time, the rate at which a finished product needs to be completed to meet customer demand. (Takt is a German word for an orchestra conductor’s baton.)
Need more detail? See this in-depth article on VSM symbols and how to use them.
How to create a value stream map
1. Determine the scope of your value stream map.
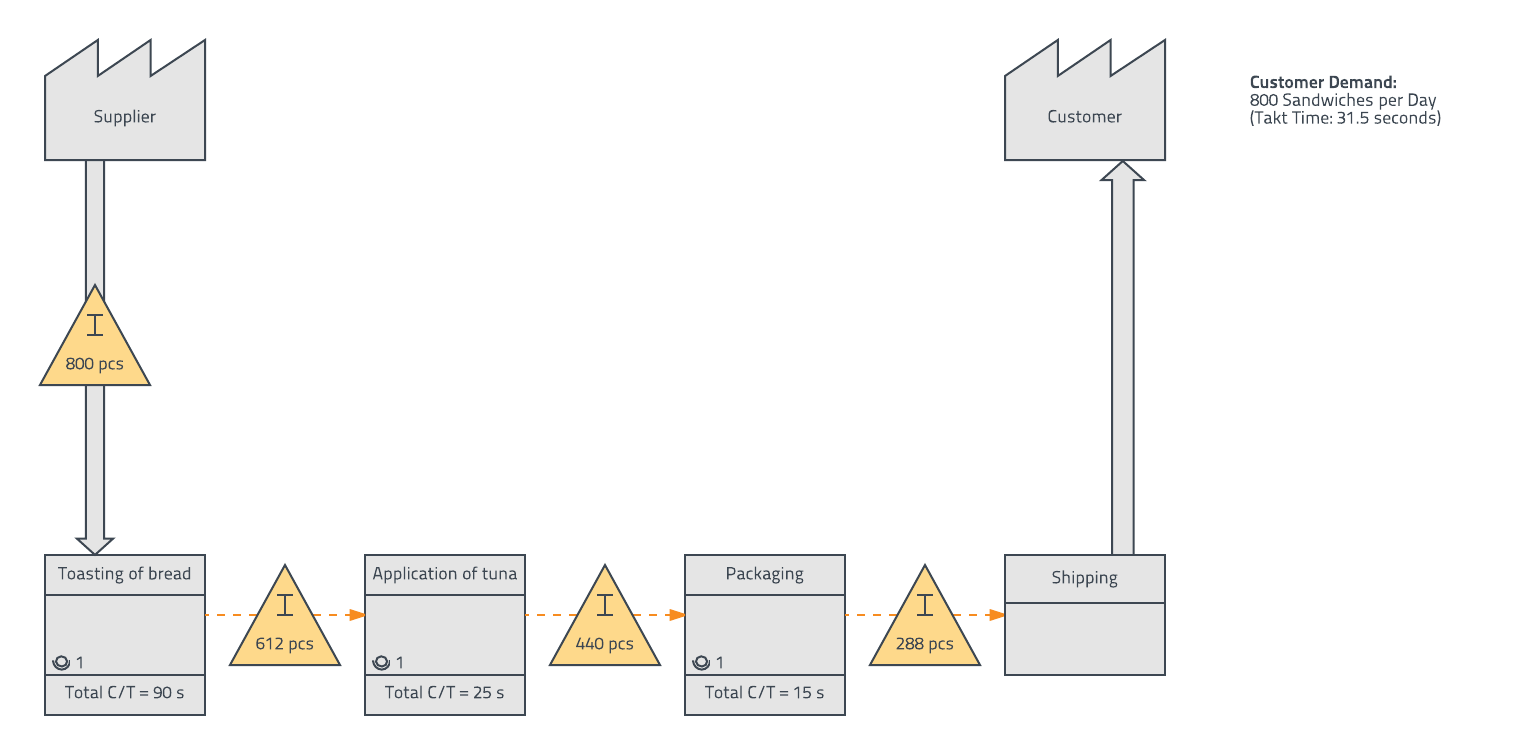
Create your start and end points first, and place them in the top left and right corners of your document. If you cover the entire supply chain, you will likely start with the supplier/raw materials and end with the customer. Use the pointed shape (found on Lucidchart in our Processes library) to represent these points.
Next to the customer, you’ll record your takt time, or the maximum amount of time you can spend while still satisfying customer demand. To calculate this number, take the available minutes for production and divide it by the required units of production.

2. Map the steps of your process.
Add process boxes (using the Dedicated Process shape under “Processes” in Lucidchart) to show all the steps involved. In the corner of each process box, a small circle indicates how many operators complete this step in the process. The example below shows only one person toasting bread, one person applying tuna, and one person packaging the sandwich.
Below each process box, include a data box for your analysis (using the Other Information shape under “Information” in Lucidchart). These boxes can include, but are certainly not limited to, the following data:
- C/T or cycle time: the time to complete one part
- C/O or changeover time: the time to switch product type
- Uptime: the percentage of time that the machine is up and running
- Yield: the percentage of parts that pass inspection

3. Add inventory and wait times.
Now connect your start/end points and process boxes with arrows to show the entire process flow. In Lucidchart, the “Arrows” shape library contains all the types you need. The thick solid lines represent shipments; in this case, the supplier ships raw materials to the factory and then the factory ships the finished sandwiches out to customers. The dotted arrows, also called push arrows, represent material pushed from one process to the next.
In between each stage, use an inventory triangle (found under “Materials” in Lucidchart) to mark the number of parts you have in WIP (work in progress) at the end of each step. On the shipment arrows, you can also add truck symbols, airplane symbols, or other equipment symbols to show the method of transportation.
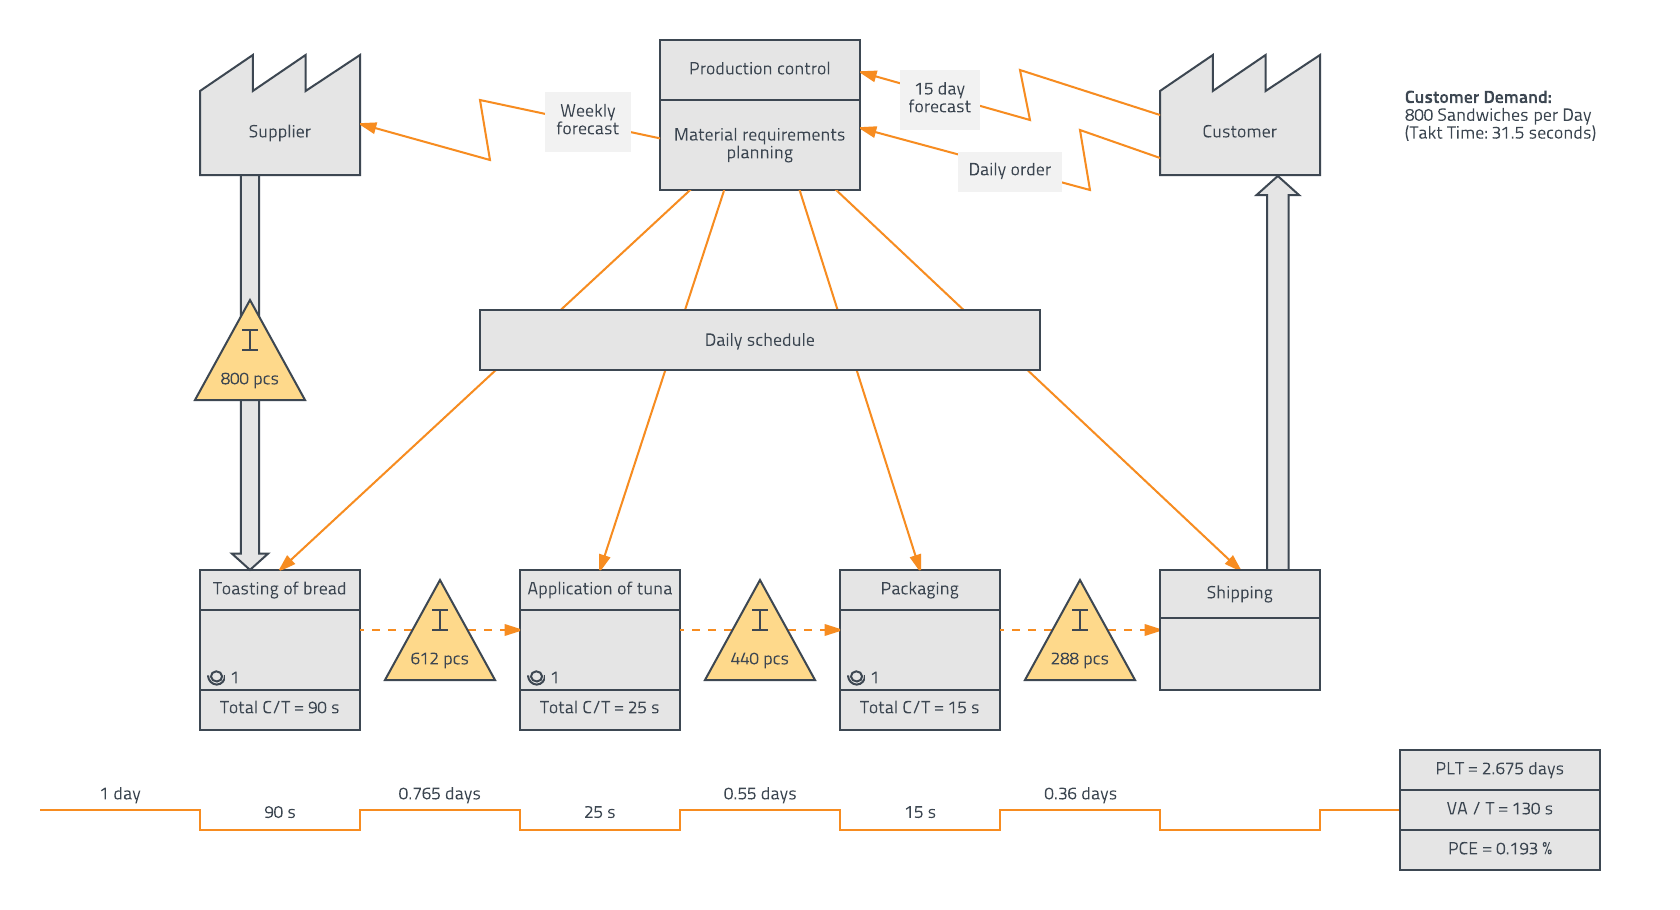
4. Draw information flow.
Value stream maps not only show the production process, but they also display the flow of information throughout that process. Add a production control box to represent the people scheduling and controlling production. You can find this shape under “Information” in Lucidchart, and most people place it between the start and end points. In the second half of that box, you can add this group’s responsibilities.
Then place lines of communication. Jagged lines show electronic communication, such as email, phone, or fax. You can add notes about the type of data exchanged, the frequency of this exchange, or the media used. Straight lines show manual communication, such as memos, printed reports, or in-person conversations.
In this example, production control receives orders from the customer and sends weekly forecasts to the supplier electronically, but they give daily schedules to the production staff in person.

5. Create timeline.
Finally, you should create a timeline at the bottom of your value stream map. Because value stream maps aim to detect waste in a process, the timeline is perhaps the most essential piece.
The timeline (which you can find under the “Value Stream Map” library in Lucidchart and extend as long as you need to) has two levels. On the bottom, you’ll write down the times for value-added processes, taken from the data boxes above. On top, you’ll write down the times for non-value-added processes. In our example, we calculated the non-value-added times by the inventory we recorded to account for overproduction. Because the customer demands 800 sandwiches per day, 800 pieces counts as 1 day of non-value-added time.
The timeline also includes a data box to the right that combines all this information. It commonly houses the following information:
- PLT or production lead time: the total non-value-added time from the top of the timeline
- VA / T or value-added time: the total value-added time from the bottom of the timeline
- PCE or process cycle efficiency: the percentage of value-added time out of the PLT
Value Stream Map Templates and Examples
Simple Value Stream Map
A value stream map provides a useful overview of how and where value is added throughout the process of producing and distributing goods to customers—but it can be tricky to start from scratch.

Lean Value Stream Map
A lean value stream map indicates how much value is added throughout a process, and how quickly, in order to motivate improvements that minimize downtime and maximize value added.

Inventory Value Stream Map
A value stream map shows how materials and information flow as goods are produced at a particular company in response to market demand. By identifying where inventory sits idle and for how long, a value stream can help companies know how to reallocate resources for maximum efficiency.
