
Mapping out your network and all the elements it interacts with can be done using a quality network diagram software like Lucidchart. Here's an in-depth look at network diagrams and network topology, including definitions, tutorials, uses, symbols, and more.
11 minute read
Want to make a Diagram of your own? Try Lucidchart. It's quick, easy, and completely free.
What is a network diagram?
A network diagram is a visual representation of a computer or telecommunications network. It shows the components that make up a network and how they interact, including routers, devices, hubs, firewalls, etc. This network diagram shows a local area network (LAN):

Depending on its scope and purpose, a network diagram may contain lots of detail or just provide a broad overview. For instance, a diagram of a LAN might could show the IP addresses of individual computers, while the diagram of a MAN (metropolitan area network) could represent buildings or areas with a single node.
A network diagram can be either physical or logical.
Logical network diagrams
A logical network diagram describes the way information flows through a network. Therefore, logical network diagrams typically show subnets (including VLAN IDs, masks, and addresses), network devices like routers and firewalls, and routing protocols.

In the Open Systems Interconnection (OSI) model, logical network diagrams correlate with the information contained in layer 3 (L3). Also known as the “network layer,” L3 is an abstraction layer that deals with packet forwarding through intermediate routers. Level 2 shows the data links between adjacent nodes, while level 1 shows the purely physical layout.
Physical network diagrams
A physical network diagram shows the actual physical arrangement of the components that make up the network, including cables and hardware. Typically, the diagram gives a bird’s eye view of the network in its physical space, like a floorplan.
How are network diagrams used?
With their capacity for showing how network components interact, network diagrams can serve a variety of purposes, including:
- Planning the structure of a home or professional network
- Coordinating updates to an existing network
- Reporting and troubleshooting network problems
- To comply with PCI or other requirements
- As documentation for external communication, onboarding, etc.
- To keep track of components
- Sending relevant information to a vendor for an RFP (request for proposal) without disclosing confidential information
- Selling a network proposal to financial stakeholders
- Proposing high-level, syslog infrastructure changes
What is network topology?
Network topology refers to the arrangement of elements within a network. Like network diagrams, network topologies can describe either the physical or logical aspects of a network. Logical topology is also known as signal topology.
Different topologies are best for certain situations, since they can affect performance, stability, and other outcomes.
Bus topology
Also known as the backbone, linear, or ethernet topology, this type of network is distinguished for having all of the nodes connected by a central medium (the “bus”) which has exactly two endpoints.

Bus topologies are easy to configure and require less cable length than some other topologies. However, if the central bus breaks down, so does the whole network, and it can be difficult to isolate the problem.
Ring topology
Nodes are connected in a circular pattern, and packets of information are sent through the ring until they reach their destination.

Ring networks can outperform those based on the bus topology, and they can be easily reconfigured to add or remove devices. However, they are still relatively vulnerable, since the whole network fails if a single node fails. Also, bandwidth must be shared across all the devices and connections.
Star topology
One of the most common topologies, the star topology consists of a central hub or switch, through which all of the data passes, along with all of the peripheral nodes connected to that central node.

Star topologies tend to be reliable because individual machines may crash without affecting the rest of the network. But if the central hub or switch fails, none of the connected nodes will be able to access it. Cable costs also tend to be higher for star networks.
Mesh topology
There are two types of mesh topology. In the first, which is called full mesh topology, each node is directly connected to every other node.

In a partial mesh topology, nodes are only connected to the nodes they interact with most.

Most networks employ some combination of topologies to yield what’s called a hybrid topology. For instance, the tree topology combines the bus and mesh topologies.
The logical and physical topology of a particular network may resemble one another, or they may be entirely different. For example, a twisted pair Ethernet network exists as a star topology physically but follows the bus topology logically.
Network diagram examples
Network diagrams can be used to represent virtually any network, which means that there’s a lot of variety. Network diagrams vary in two important ways: by the type of network they represent and by network topology, or the arrangement of components. Below are a few examples, and you can always visit our network diagram example library for more.
Virtual private network
: allows users to access a private network over a public network as if they were directly connected to that private network
Server rack
: shows the layout of a rack system
Enterprise private network
: connects diverse elements within a business, such as multiple sites
DSL network connectivity
: shows how information is relayed over telephone lines
Diagramming is quick and easy with Lucidchart. Start a free trial today to start creating and collaborating.
Make a diagramNetwork diagram symbols and icons
Switches and bridges
For network diagrams, switch symbols represent multiple Ethernet ports that enable the connection of multiple devices. Switch symbols are also useful for representing the transfer of data over telecommunication networks.
Bridge symbols connect two Ethernet networks into one larger, extended Ethernet network. Bridge symbols are especially important when diagramming networks that are separated by geography. Since bridge shapes predate switch shapes, they are hardly seen unless they refer to wireless bridges.

Routers
As perhaps the most popular network diagram symbols, router symbols manage traffic between devices or networks. Routers have the added functionality of facilitating a wireless access point or broadband modem, making them more useful than switches in many cases.

Databases
Databases are useful for organizing extensive collections of data, and can be symbolized in AWS and Cisco standard networks with the following shapes. Assess your network and determine which database will be the most useful. Database shapes can be chosen depending on your needs, including operational, specific, external, or hypermedia database shapes. You can also choose your database shape depending on other factors, such as the kind of machine that supports the database (e.g., server cluster) or the query languages used to access it (e.g., SQL).

Connectors and devices
To show the path that data travels within your network diagram, use connector shapes. The connection symbol that you use depends on the type of traffic that is being routed. Feel free to use a variety of devices such as PCs and telephones to model the medium of communication of your network. Many more network diagram shapes can be found in Lucidchart’s network diagram shape libraries.

How to create a network diagram
Just like networks, a network diagram can have a lot of elements depending on the complexity. It’s helpful to draw a network diagram on paper first. Start by listing all the components (cloud, servers, clients, mainframes, peripherals, hubs, routers, etc.) that will be part of the diagram. Next, draw lines between the elements to see how they will connect to each other. It’s best not to let the lines cross each other, that way you can clearly see the connection points.
Once you have a general layout, it’s time to use network diagram software to map it out. Before trying to create the diagram manually using a basic tool, look for a network diagram template that can provide a general starting point. The tool you use to create it should have images readily available to represent all the parts of your network. You’ll also want an option with a grid background so you can easily align and position items on the diagram.
As the diagram starts to materialize, start customizing it. Start by naming all the elements on the diagram and then change the font and size of text when naming peripherals versus backend components. Try using different colors for the lines that symbolize connections. Adding these elements will provide more texture to the diagram. When the network diagram is complete, you should be able to save and print it. If you used an online tool, you’ll also be able to share it via a link (or other format) and even invite others to work on it as well.
Now that you have a sketch of your network diagram, use Lucidchart’s intuitive online tool to make a digital version. You’ll want to use the network diagram template to get started since it includes all the icons and images you’ll need to represent the various network elements. Don’t worry if the template looks nothing like your design, you can easily delete the elements that are already on the diagram. Login to your account (if you don’t have one, sign up for a free Lucidchart trial) and follow the steps below.
1. Select a network diagram template
In the Documents section, click on the orange +Document button and double-click on the Network Diagram template.
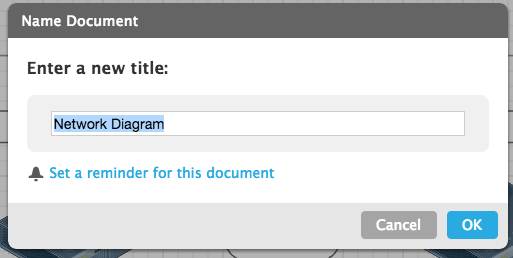
2. Name the network diagram
Click on the Network Diagram header in the top left corner of the screen. A pop-up screen opens, type the name of your diagram in the text box and click OK. The name of your network diagram appears in the top left corner of the screen.
3. Remove existing elements that you don’t need on your diagram
A template is just a starting point, but if there are any elements on the network diagram template that you won’t be using, remove them now. Click on the item and then right-click on the mouse. Menu options will appear on the screen, select Delete.
Tip
: You can also hit the Delete button on your keyboard.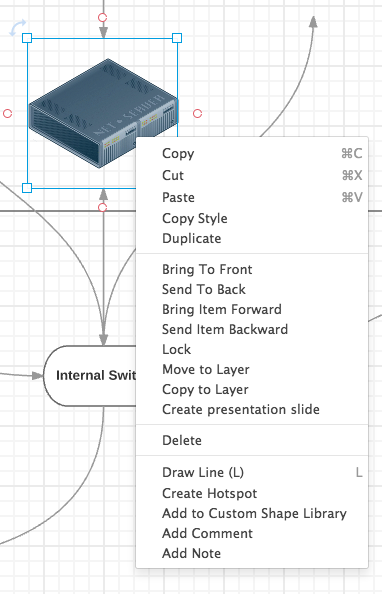
4. Add network components to the diagram
In the left column of the screen, you’ll notice a plethora of computer-related icons. You can choose from our options, standard icons, Cisco (basic and extended), network, electronics, audio equipment, and Bing images. There are a lot of options, so you may want to enter the name of the network device you’re looking for in the search box at the top of the left column. You can also scroll through the images/icons. When you see one you like, click on it and drag it to the screen.
(Note: We’ve used a variety of icons/images to demonstrate all the options available. For consistency, you may want to use icons from the same set.)

5. Name the items in your network diagram
Before you start drawing network connections, let’s name the items added to the diagram. As you can see, you can group entities by drawing squares around them. Here’s how to add text and draw squares.
Add text
: To add text to the diagram, scroll through the left column and look for the heading Standard (you’ll see a T, a square, arrow, note, and a colored box). Click on the T and drag it to the place on the diagram where you want to add text. Type in the text and use the menu options for color, font, size, bold, etc. to customize it.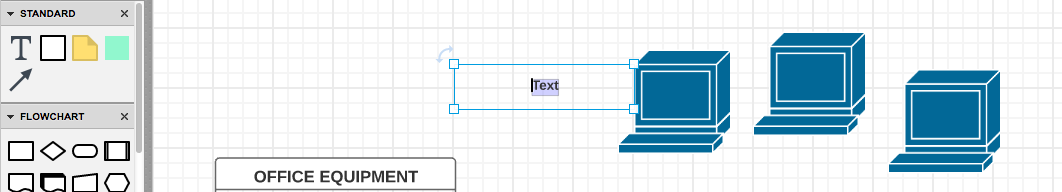
Group items using containers
: In the left column, scroll to Containers. Choose the shape you want to draw around a group of items on the diagram, click on it and drag it to where you want it placed on the diagram. Click it to see the squares in the corners signaling that you can resize the box. Click a corner and drag it to make the container bigger or smaller. Use the background grid as a guide for alignment and sizing.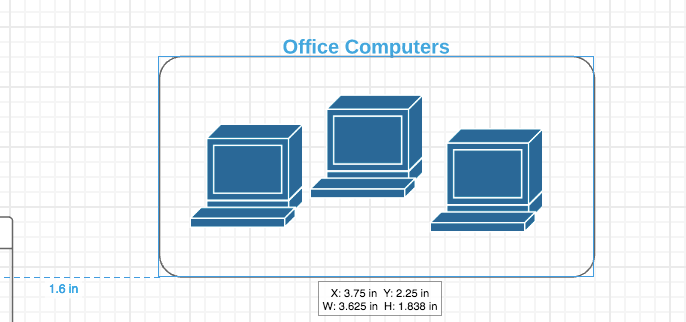
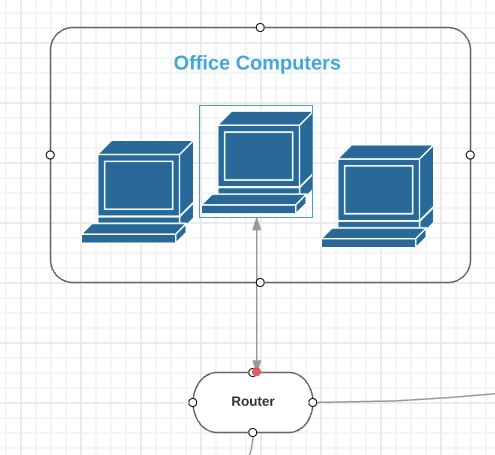
6. Draw connections between components
Double-click on any component and then click and hold one of the orange circles, and drag the line to the appropriate symbol. Continue to draw all the connections on the network diagram.
Tip:
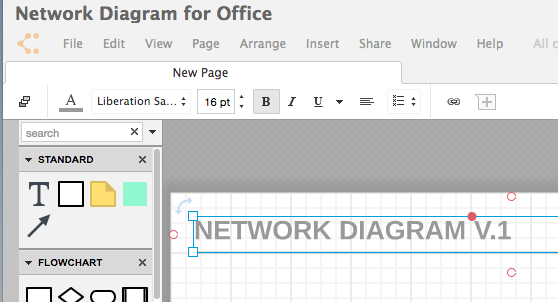
You can adjust the arrow style by clicking on it. Next, click the arrow icon in the menu bar and choose one of the two other styles. To change the style of all the arrows, choose Select All from the Edit menu and then click on the style you prefer.7. Add a title and share your network diagram
The title at the top of your network diagram grid is the same as what you named the file. If you want to change the name on the actual diagram, double-click the diagram title and type in a new name. If you’d like to adjust the font and type size, use the shortcut keys in the menu bar at the top of the screen.
You can easily share your network diagram with others either via email, web link, social media (Facebook, Twitter, Google+, and LinkedIn), or embed it on a website. Click the blue Share button in the top right corner of the screen and a pop-up will appear. Choose how you’d like to share your diagram and enter the appropriate information.
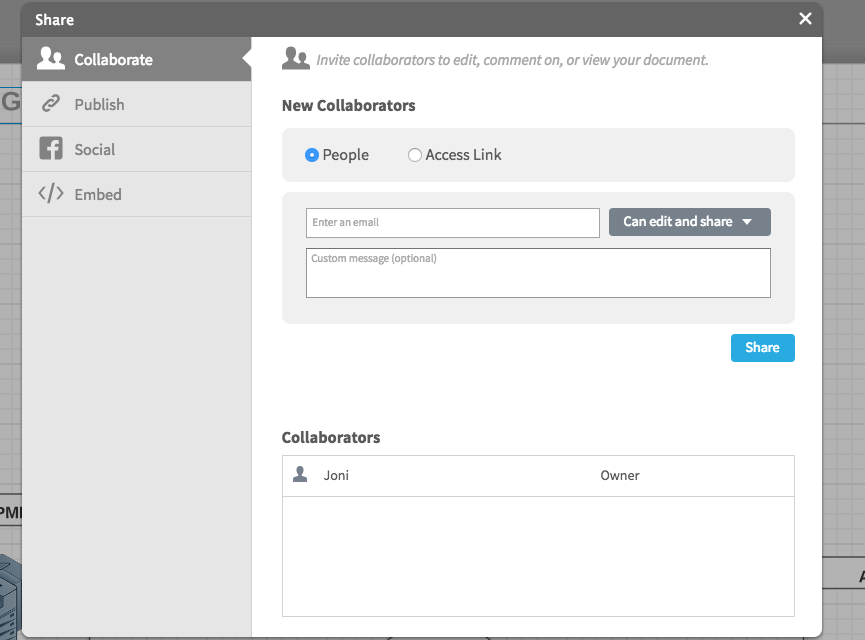
When you add collaborators, you can give them permission to work on the diagram and have discussions with them using the chat feature (the yellow quote icon in the top right corner of the screen).
Network Diagram Templates
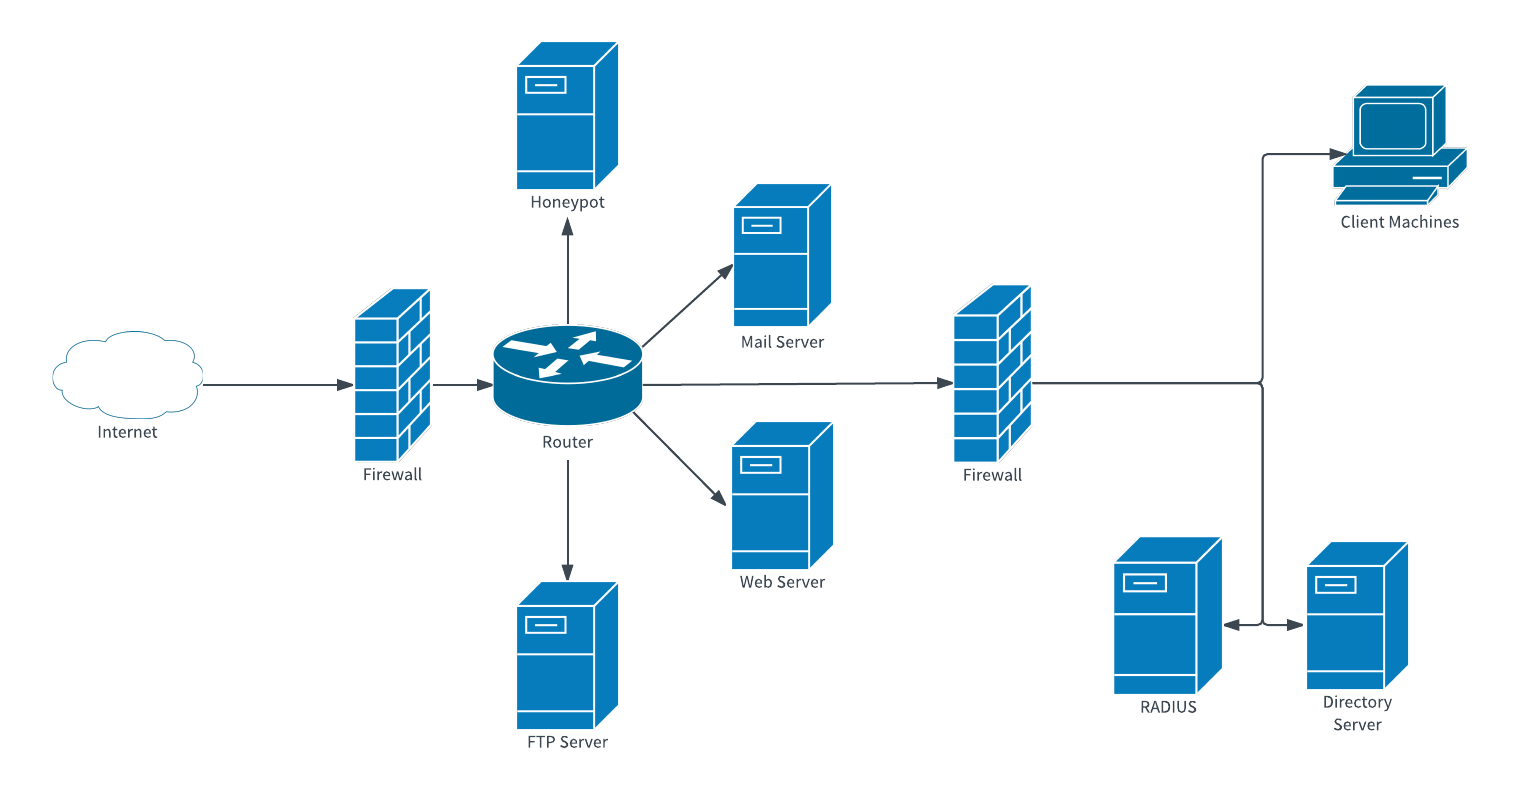
Network Security Diagram Template
A network security diagram maps out the security methods implemented to protect an organization's assets. It helps to ensure the protection of valuable information as it is stored and transmitted. Make sure your data is safe by using this network security diagram template for your organization.
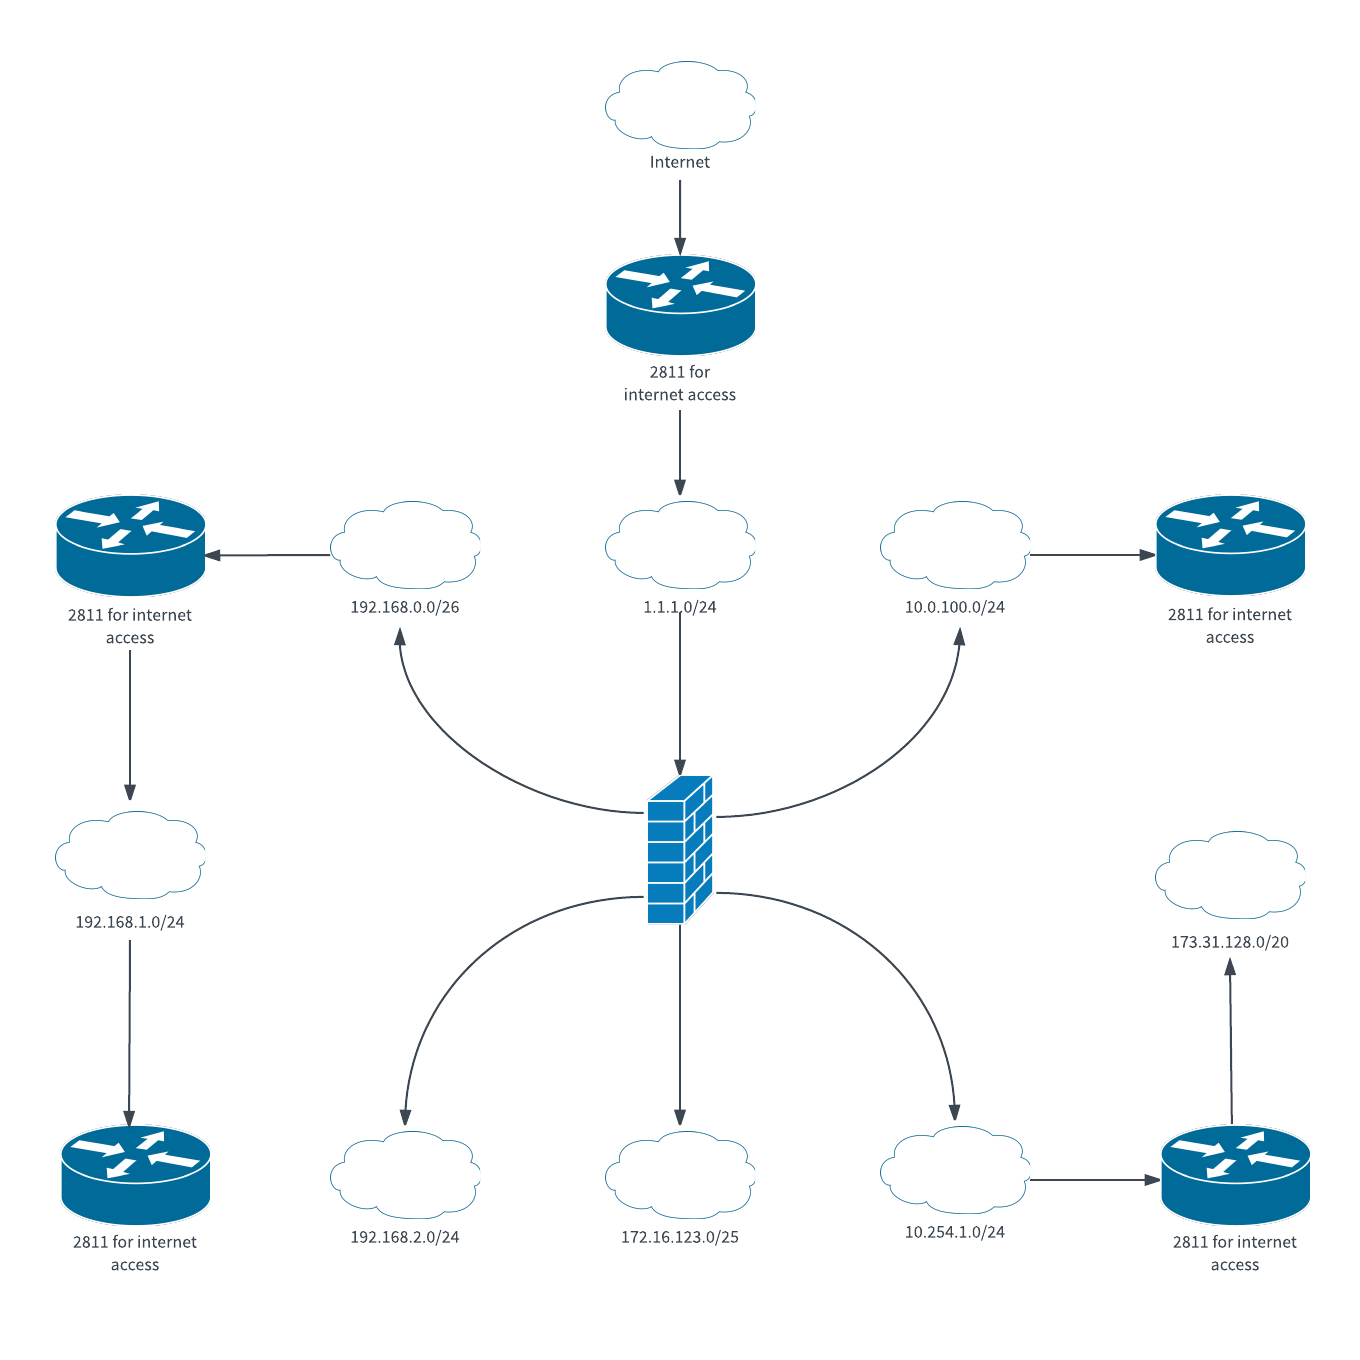
Logical Network Diagram Template
A logical network diagram displays how information flows through a network, allowing you to see subnets, network devices, and routing protocols. This visual representation helps to keep your network optimized.
Office Network Diagram Template
An office network diagram maps out the relationships between the technological components of your company's network. It allows you to see how the different devices interact to pinpoint trouble areas, ensure optimum performance and facilitate upgrades and additions.
