In the modern workplace, continual improvement is crucial to your bottom line. That means tracking data and goals is vital to understanding how your business is performing and how changes affect your progress. Many frameworks exist to gauge the health and effectiveness of your organization. One of these is DevOps Research and Assessment, or DORA.
What are DORA metrics?
The DORA framework consists of four key metrics created to promote continuous improvement. They accomplish this by assisting in goal-setting based on performance and then measuring the progress of those goals.
The DORA metrics were identified as having the most significant impact on software development and delivery based on survey responses from more than 30,000 professionals over more than five years.
Who uses DORA metrics?
DORA metrics are specifically for DevOps teams and engineers, though any team in any industry can learn from and apply its framework.
What is the purpose of DORA metrics?
DORA metrics can help DevOps and engineering teams in many ways. Here are some of them:
-
They offer realistic response times.
-
They help teams identify opportunities to improve.
-
They empower teams to build a consensus on worthwhile investments.
-
They enhance project planning.
DORA KPIs provide a benchmark so teams can better analyze their performance and compare it against the industry standard. This makes it easier to identify actionable opportunities for improvement in development speed and quality, deliveries, planning, and investments.
What are the four DORA key metrics?
Here are the four metrics that DORA prioritizes:
Deployment frequency
New features should be consistently delivered to maximize user retention and maintain a competitive advantage. Deployment frequency, or DF, refers to the average number of finished code deployments to a given environment in one day. It’s seen as a key indicator of efficiency and automation. The highest-performing teams may deploy several times daily, while others may deploy once weekly.
DORA DevOps metrics have found that the most successful teams tend to prioritize deployment frequency over deployment size. This means that teams should consider smaller deployments more often rather than large deployments infrequently.
Why it matters
This metric describes more than just how fast your team can work. It indicates your organizational agility and whether or not your team can quickly respond to market changes, close feedback loops, and identify problems quickly.
Pro tip
Don’t focus on the specific deployment number you’d like to hit. Instead, start by analyzing where your team currently is and focusing on modest but valuable improvements.
Lead time to changes
Lead time for changes, or LT, is sometimes also known as mean lead time to changes. This refers to the time it takes for a team to implement a change from when they commit to making it, like a restaurant tracking the time it takes a customer to receive an order after placing it with their waiter. On average, teams take about a week to implement changes, but top performers could execute in as little as a day.
It also indicates a team’s capacity, which is essential for leaders to understand so they have realistic expectations of their development process. To improve this metric, they could focus on smaller deployments, enhance the efficiency of their processes, or automate testing.
Why it matters
This metric uncovers the efficiency of your team as a whole. A competitive lead time to changes rate means you’re consistently delivering on your commitments and you’re promoting brand trust while you do it.
Pro tip
Once you discover this metric, it’s easy to feel overwhelmed and identify which element of the process is slowing you down. Rather than making too many changes at once, try to locate your biggest bottleneck and start there.
Mean time to recovery
Mean time to recovery, or MTTR, refers to how long it takes a team to restore a system after a failure. It is important because it indicates both how long it takes a team to identify problems and how quickly they can resolve them. Essentially, it measures how fast a pit crew can get a racecar back on the track.
In this metric, quicker is always better, and there is always room for improvement. The most efficient teams may resolve problems within an hour or two.
If teams want to improve their mean time to recovery, they should focus on developing incident management processes that are easy for the team to understand and act on. That way, everyone is aligned on the next steps as soon as a failure is identified.
Why it matters
This metric highlights how resilient your company is. Things inevitably break down and fail, and a low mean time to recovery rate means you get back on your feet quickly. This not only saves you hassle and money, but it also protects brand reputation and your user base.
Pro tip
Your average MTTR is helpful, but it can also be useful to examine outliers. Analyzing incident reports and retrospective data can uncover situations where your time to recovery was significantly shorter or longer than your average. Try to discover why this was the case, and see if your findings can be applied to other incidents.
Change failure rate
The last DORA metric is the change failure rate or CFR. This quantifies how many deployments cause a failure. It’s calculated by dividing the number of incidents by the number of deployments. A high change failure rate means that defects are going undetected, and product quality is suffering. The average change failure rate is 0-15%.
Change failure rate is the only DORA metric that doesn’t focus on the speed of deployment and changes. It proves that deployments aren’t only quick, but they’re high-quality. Like the other metrics, automation and smaller deployments are ways to improve a struggling CFR rate.
Why it matters
Speed is important, but not if you make significant mistakes along the way. You could consider the change failure rate as the most important metric because it balances the others by discovering how reliable your company is. Reliability improves employee morale and user trust.
Pro tip
Don’t assume that a 0% CFR is the best—it can also indicate that your team is too risk-averse. When you’re trying new things, some failure is inevitable. If your team prioritizes innovation, your CFR likely won’t stay at 0%, and that’s okay.
How do you implement DORA metrics?
Analyze the four DORA metrics together to get a complete picture of business efficiency and value. For example, if your lead time to change is competitive, you may feel like changes aren’t necessary. But combined with a high change failure rate, the metric becomes less impressive and suggests that slightly slower, more accurate deployments could be helpful.
To begin implementing DORA DevOps metrics, you must create a pipeline separating data sources into changes, incidents, and deployments. Extract the data, sort it, and then calculate each metric based on performance.
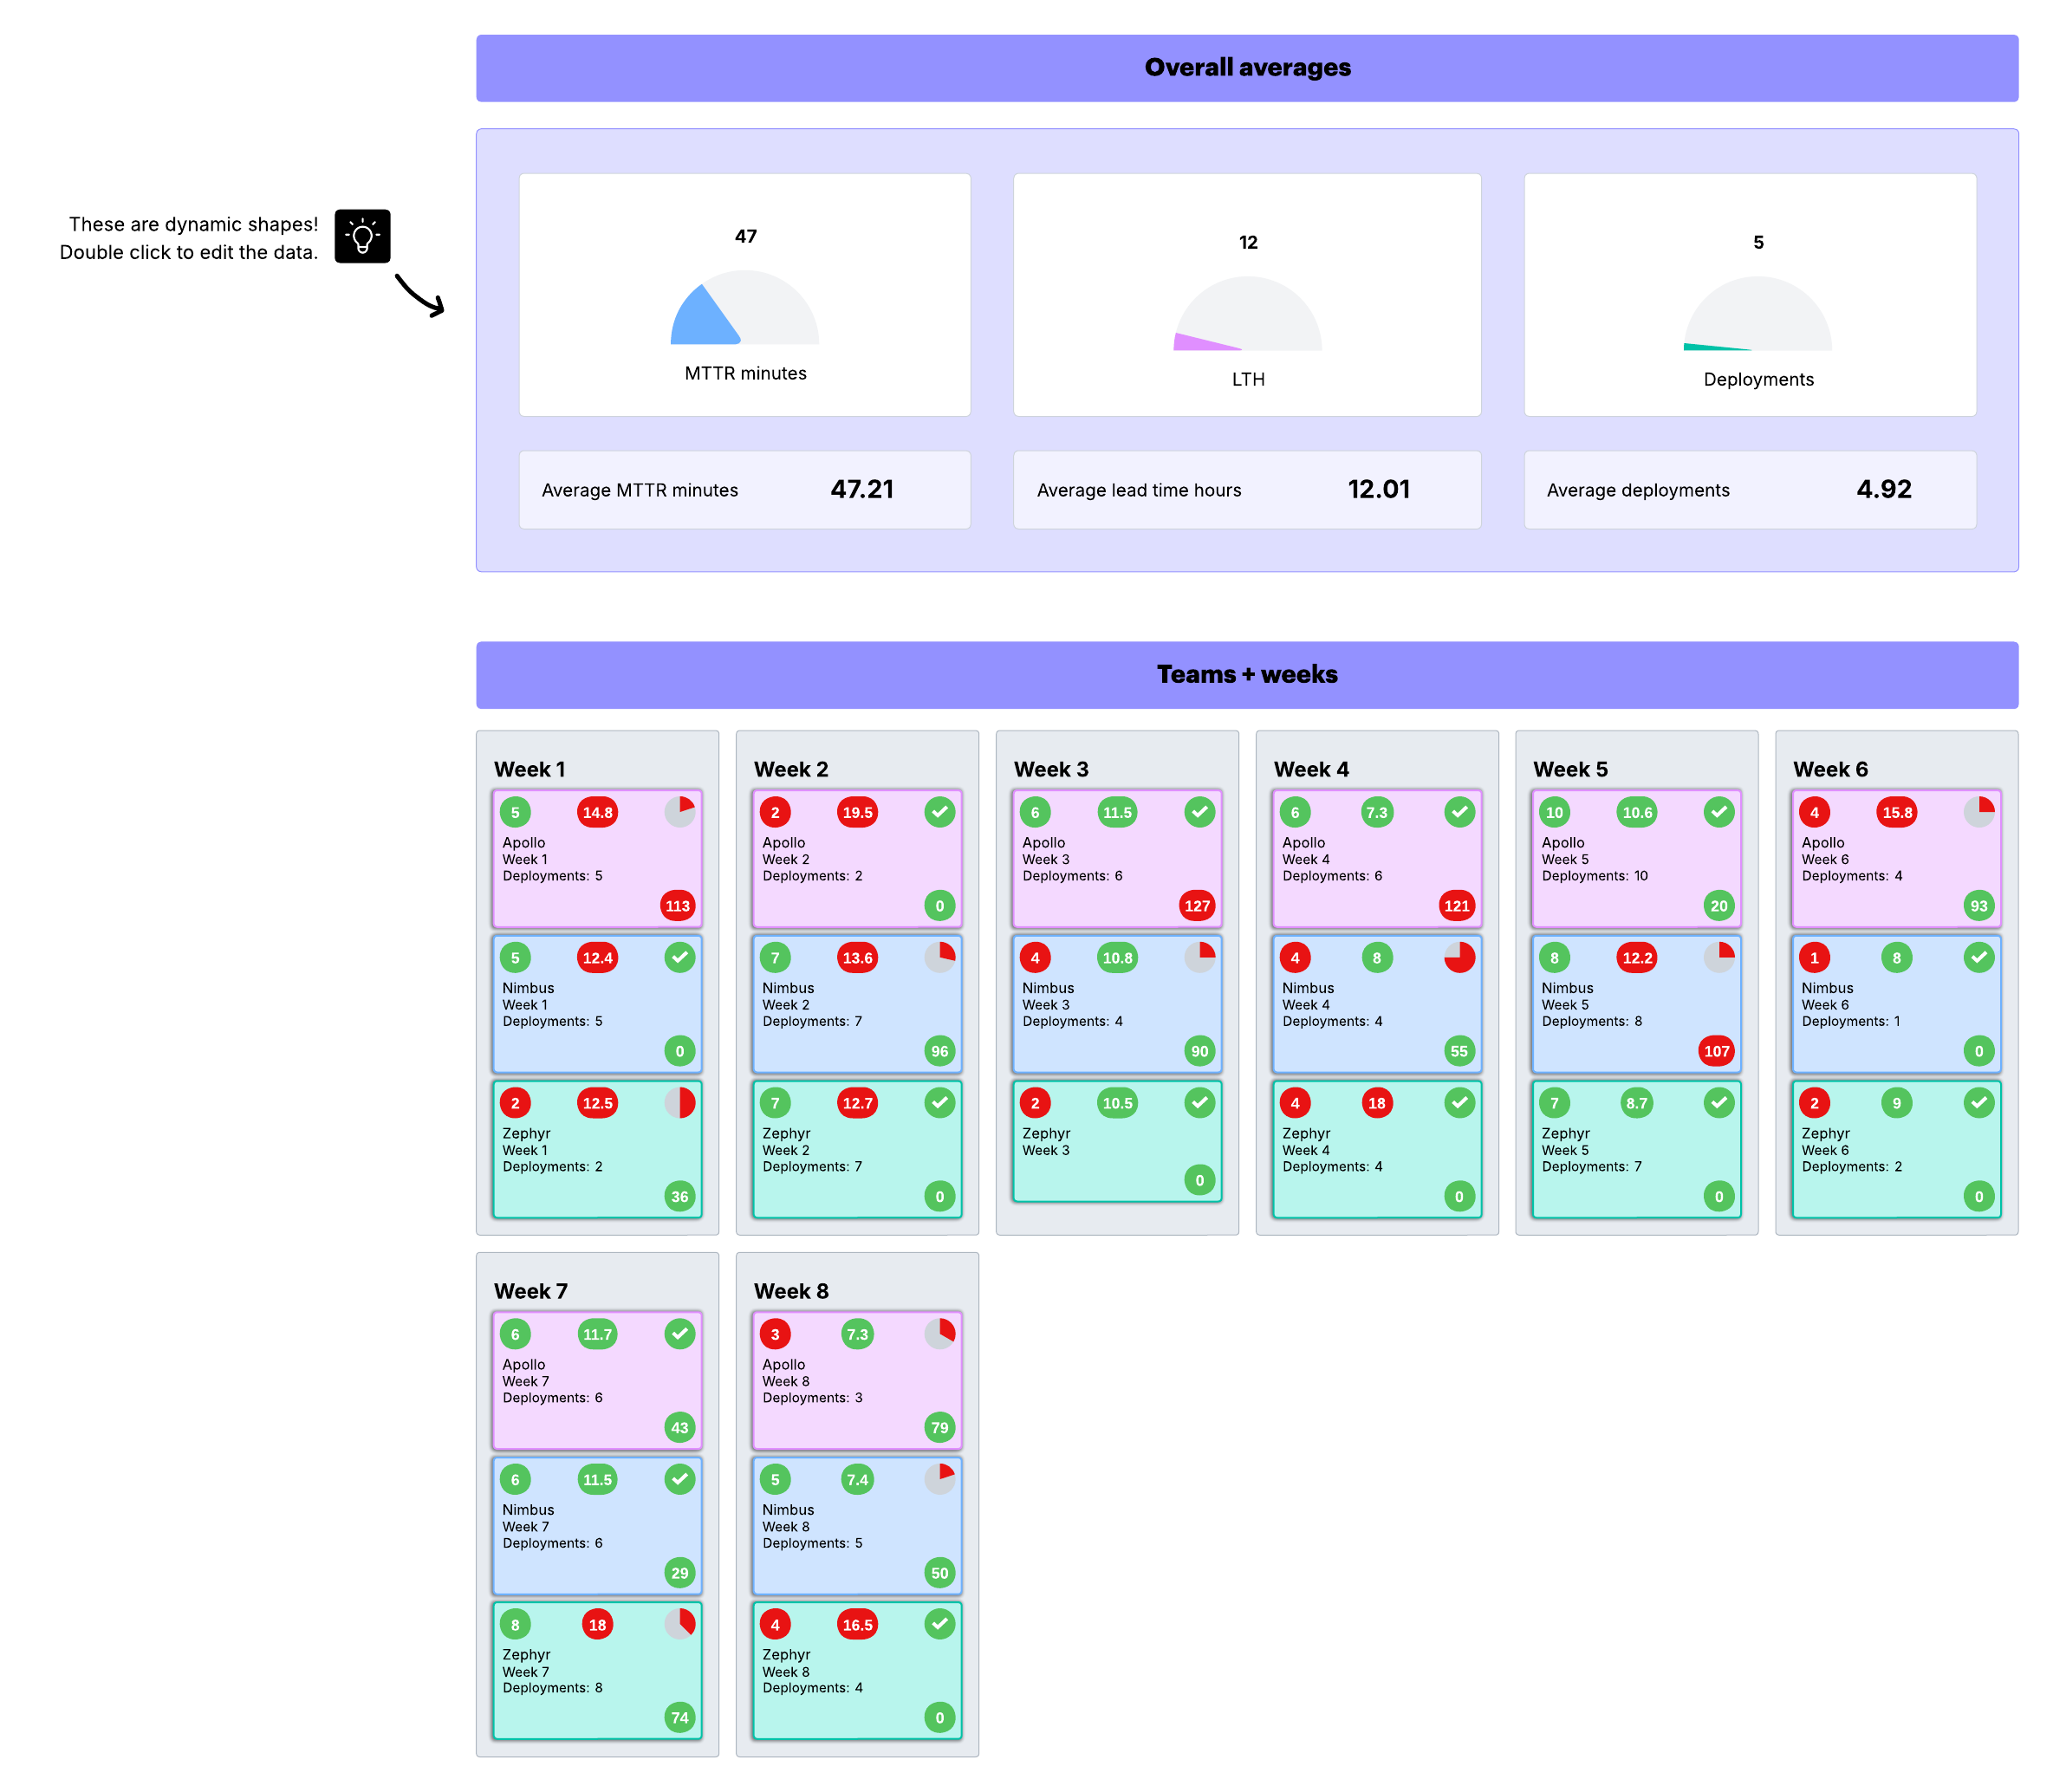
A DORA metrics dashboard is perfect for analyzing and maintaining these metrics to compare them for an accurate measurement. Powerful data-linking capabilities update diagrams automatically, saving valuable time and effort in your day.