Webinar Recap: How to Apply Performance Metrics to Business Processes
Polly Phillips
Reading time: about 8 min
Topics:
Recently, we were honored to have Jogee Varughese, a business process consultant for Austin Energy, join us for a webinar on how you can measure continuous improvement work at your company. He reminded listeners to “set them or forget them”—if you don’t set performance metrics, you won’t know whether the processes you have improved and implemented actually help you accomplish your business objectives.
Jogee’s advice was so beneficial that we wanted to review his points and show you some ways you can apply these suggestions with Lucidchart. If you weren’t able to attend the webinar, or if you couldn’t take down notes fast enough, take a look at our recap.
What is a process?
First, Jogee reminded us of the goals of business processes. Juran, a pioneer for quality management, described a business process as “a logical organization of people, materials, energy, equipment, and information into work activities designed to produce required results.”
In other words, business processes are designed to fulfill a business need. It’s about bringing everyone together to deliver the right results for the organization.
However, you won’t know whether you have met your business objectives—which is the entire purpose of a business process—if you don’t measure performance. Jogee referenced this credo from the Six Sigma methodology:
“We don’t know what we don’t know.
We can’t act on what we don’t know.
We won’t know until we search.
We won’t search for what we don’t question.
We don’t question what we don’t measure.”
In order to act on your business objectives, you have to implement your process, track performance metrics, and iterate until the process meets your goals. Once Jogee established why professionals need to measure process performance, he discussed how.
Approaching a specific process or task
First, Jogee shared an example of implementing and tracking a specific process. In this example, a healthcare institution made up of 19 hospitals wanted to reduce (or completely avoid) needlestick injuries, which happened three to five times a month.
If you want to implement and track a specific process, you can follow these same general steps and bring your entire organization together to meet business objectives.
1. Establish the process owner
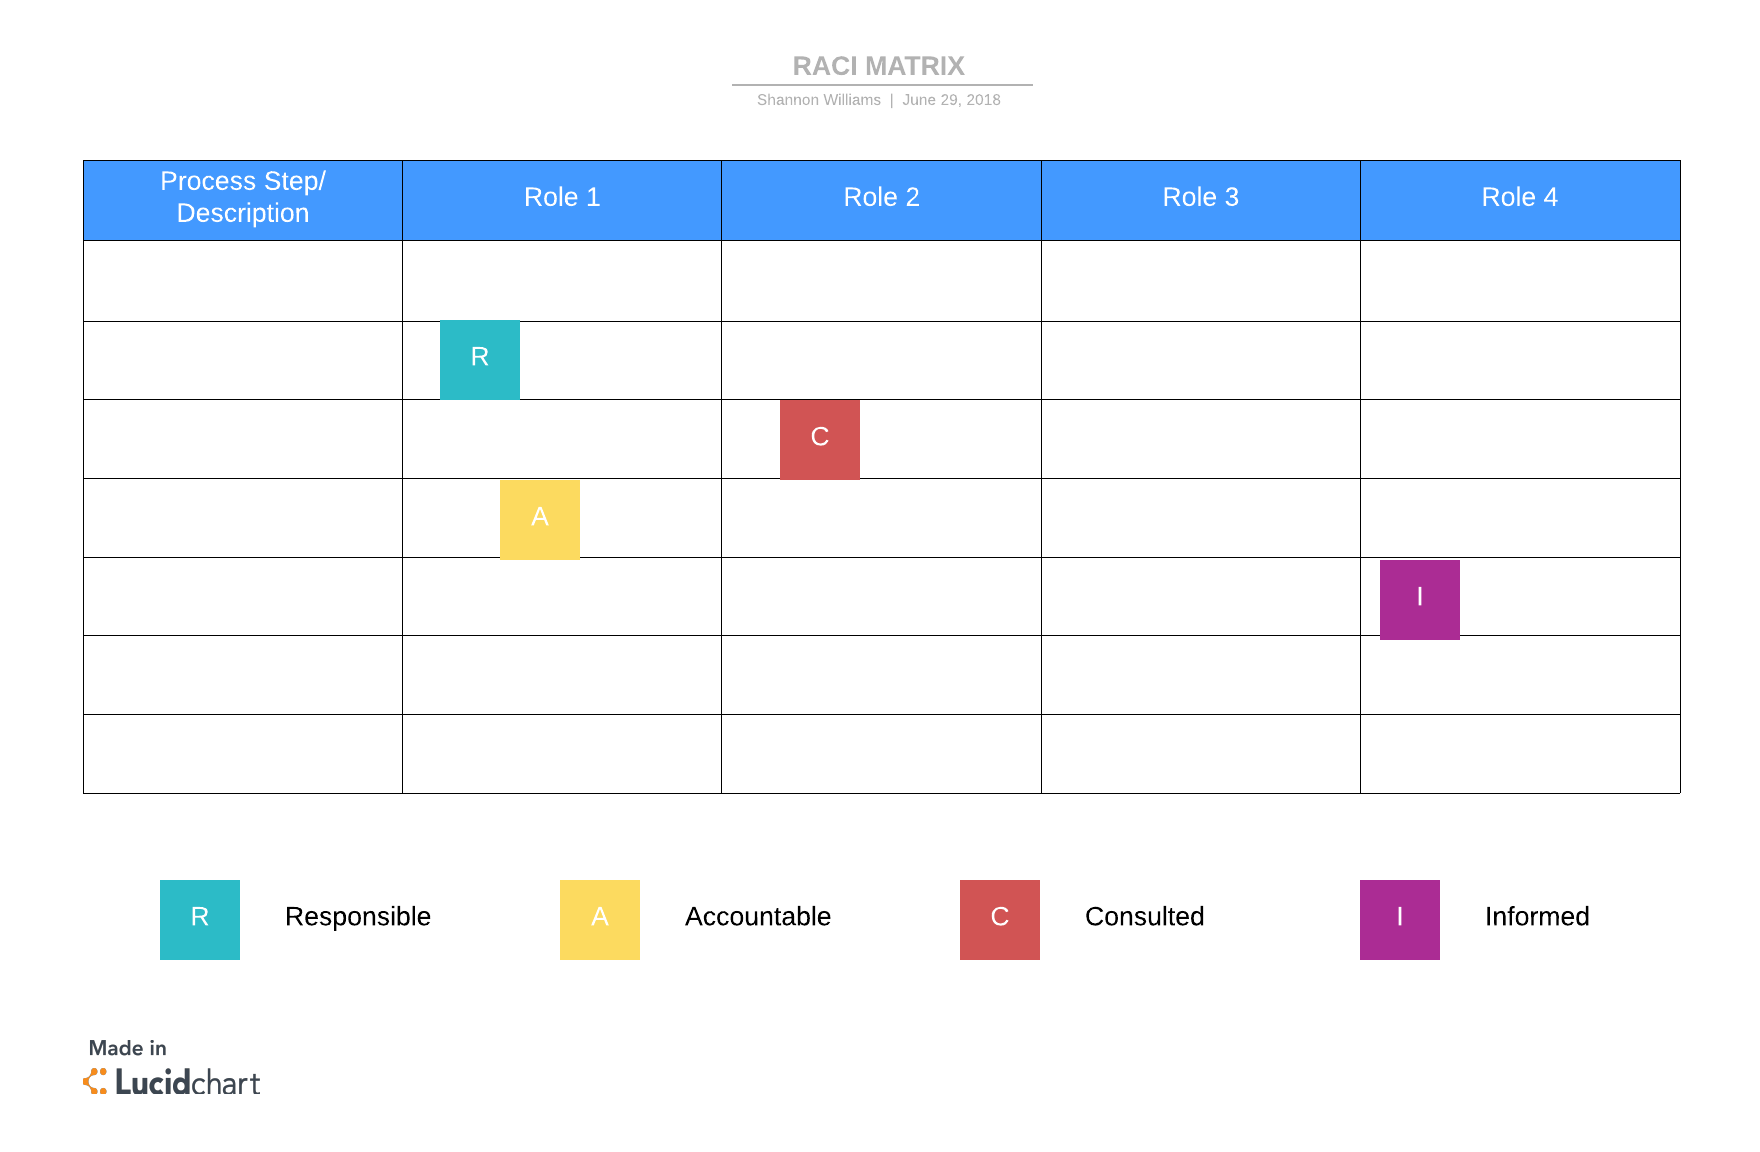
Establish clear ownership at every level. You can use process maps or a RACI (Responsible, Accountable, Consulted, Informed) matrix to determine who is accountable for or involved in every step of the process.

In the example, the healthcare institution decided that the policymakers would ensure that the safety equipment for handling clinical waste arrives on time, and the hospitals would ensure that the clinical waste bins were transported safely away from the hospital.
2. Identify performance measures
Next you should determine how you will measure success, including leading measures (input) and lagging measures (output). Using data analytics, you should determine what organizations have been impacted the most by the business problem so you can monitor them more closely once you implement the new process. Visual dashboards can help you track these performance metrics and share them with others.
As part of this step, you need to show employees the importance of tracking data, especially if you don’t have an automated process for collecting data, and make it as easy as possible for them to gather data. People tend to take the route of least resistance, but data will help you know how to iterate the process and helps others see how the process really is making a difference.
In the example, the institution wanted all employees to be trained on safety procedures (leading measure) and 0 needlestick injuries by the end of the year (lagging measures).
3. Understand the purpose of the process
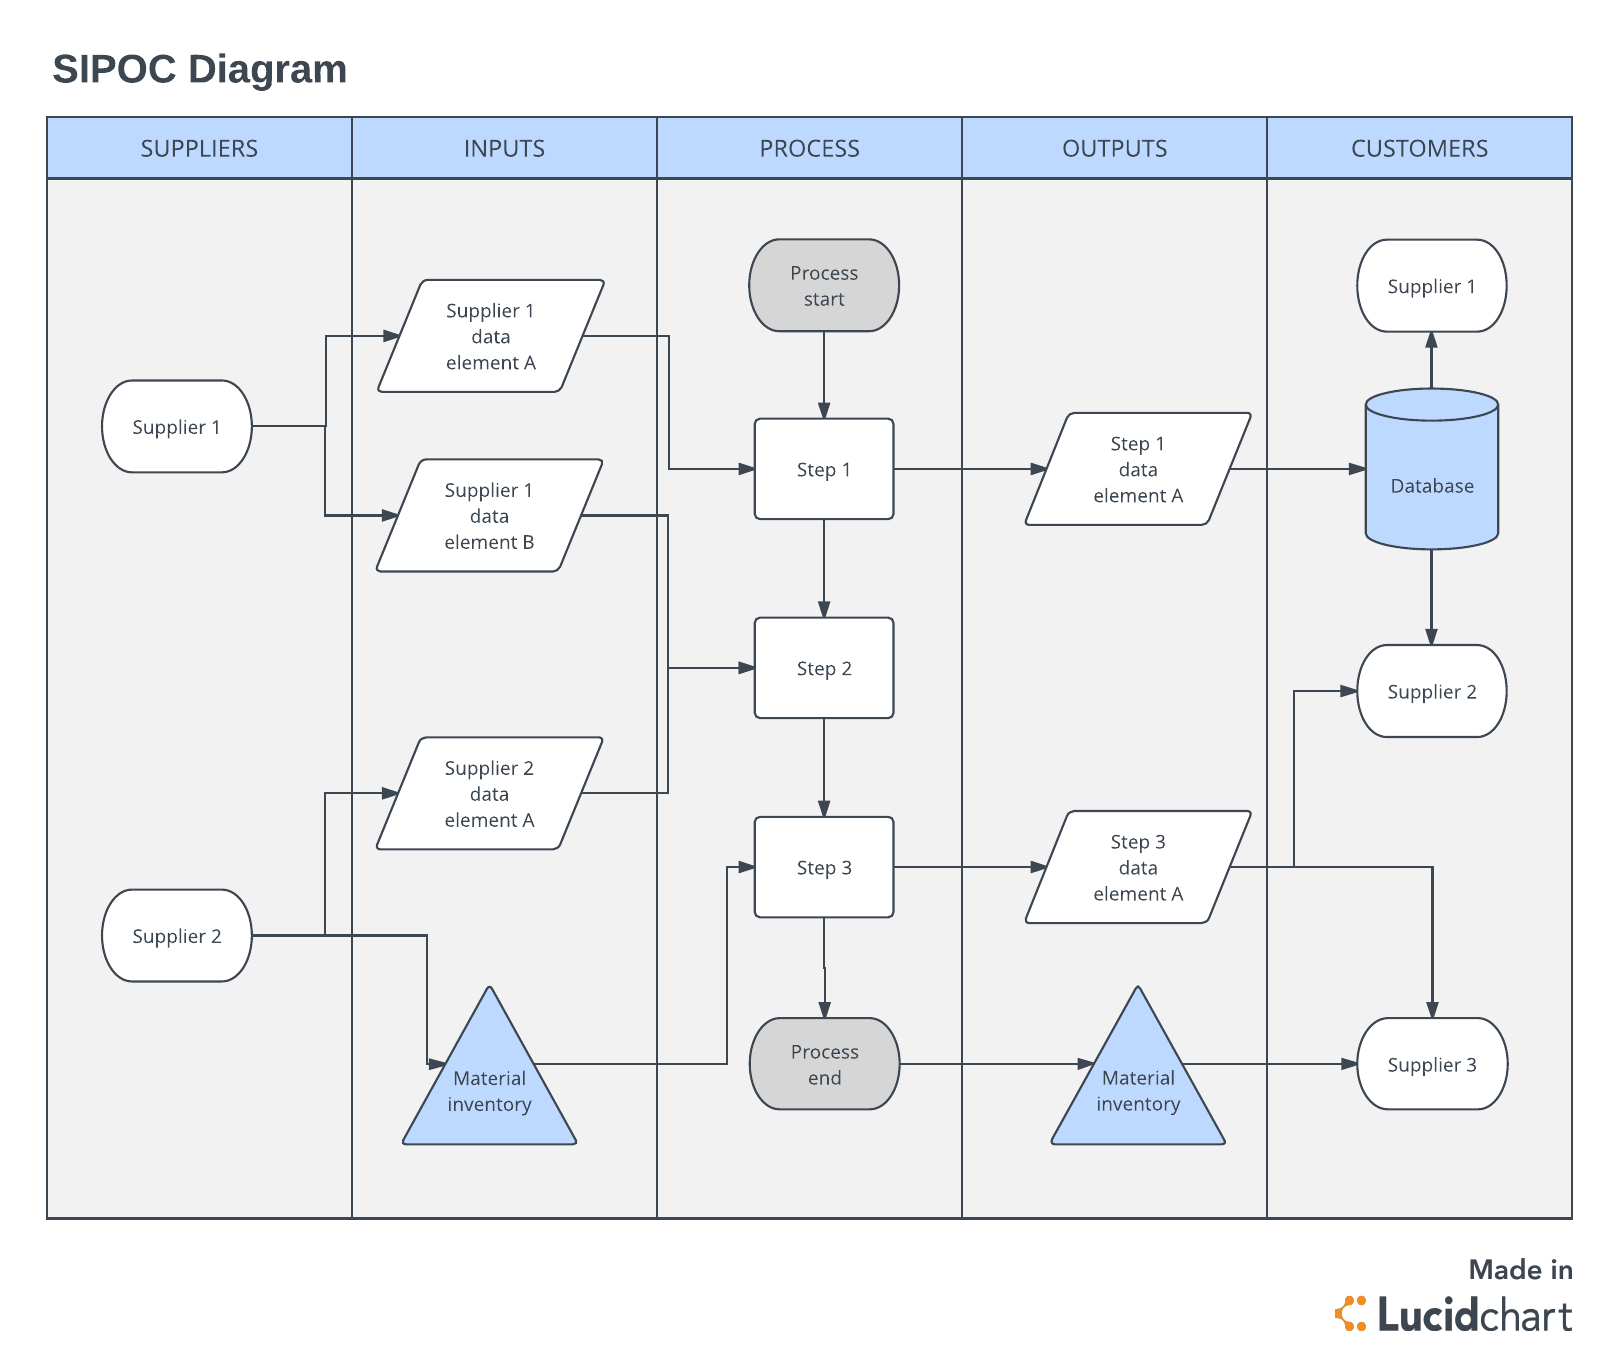
Create a SIPOC (Suppliers, Inputs, Process, Outputs, Customers) diagram using a diagram maker to help gather information. It will help you look at the entire process, especially customer needs, and determine what the process is attempting to solve.

In the example, the customers were the hospital administrators and employees. The process should be creating a safe environment for them. The hospital administration gave Jogee regulations about where and how many times a day they could collect clinical waste, and he would need to build those regulations into the process.
4. Train employees
Training goes beyond sitting employees down in a room and asking them to listen to you for an hour. Employees should be fully engaged and understand that they are part of the change process. Along with role-appropriate and on-the-job training, the trainer should encourage reporting so you gather the appropriate metrics in the process.
Just as you monitor the effectiveness of your process, you should also monitor the effectiveness of your training and make adjustments as necessary.
5. Monitor progress
Closely monitor the process during the early stages of implementation. Using your data analysis from earlier, you should perform targeted monitoring on the organizations that were most impacted by the business problem.
In the example, Jogee would call twice daily for the first two weeks and once daily for the second two weeks to see if the process made any difference. Jogee and his team would also do “spot checks” and monitor progress through site visits.
The results speak for themselves: the institution brought needlestick injuries down from three to five a month to one or two annually.
Approaching process at an organizational level
The previous example showed one specific process that needed to be fixed, but often, businesses won’t be able to achieve perfect quality by fixing a single process. Quality is not a destination—it’s a journey. Jogee moved on to a second example about a large organization with 5,000+ employees that wasn’t hitting its numbers. The company needed to switch its culture from a function-led organization to a more cross-functional, process-led organization.
Again, the following steps can help you as you try to create a culture of processes and continuous improvement throughout your company.
1. Design
First, design your continuous improvement program. You need to set up:
- An industry-specific process framework or hierarchy (you can choose from many options or contact a consultant to help you get started)
- A support structure for process improvement (localized support for each team)
- Process owners within the hierarchy
- A reporting cadence
- A process council where leadership can come together, discuss the challenges they face, and make decisions
When you start this journey, you will absolutely need support from leadership. If you have trouble getting support, explain how leadership will be involved in the process and how this program will impact ROI and bottom-line results.
2. Ownership
Once you have defined process owners in the previous steps, train these individuals so they understand the role and responsibilities of a process owner and the resources required. Part of these responsibilities should involve a process walkaround—the process owner should walk through the program once a month to learn the problems each individual faces to deliver the work they’re supposed to.
3. Performance measure
Set up leading and lagging measures for each level of process. This next bit of advice is essential: Your lagging measures must be aligned to business and customer requirements—don’t set up lagging measures just to set up lagging measures.
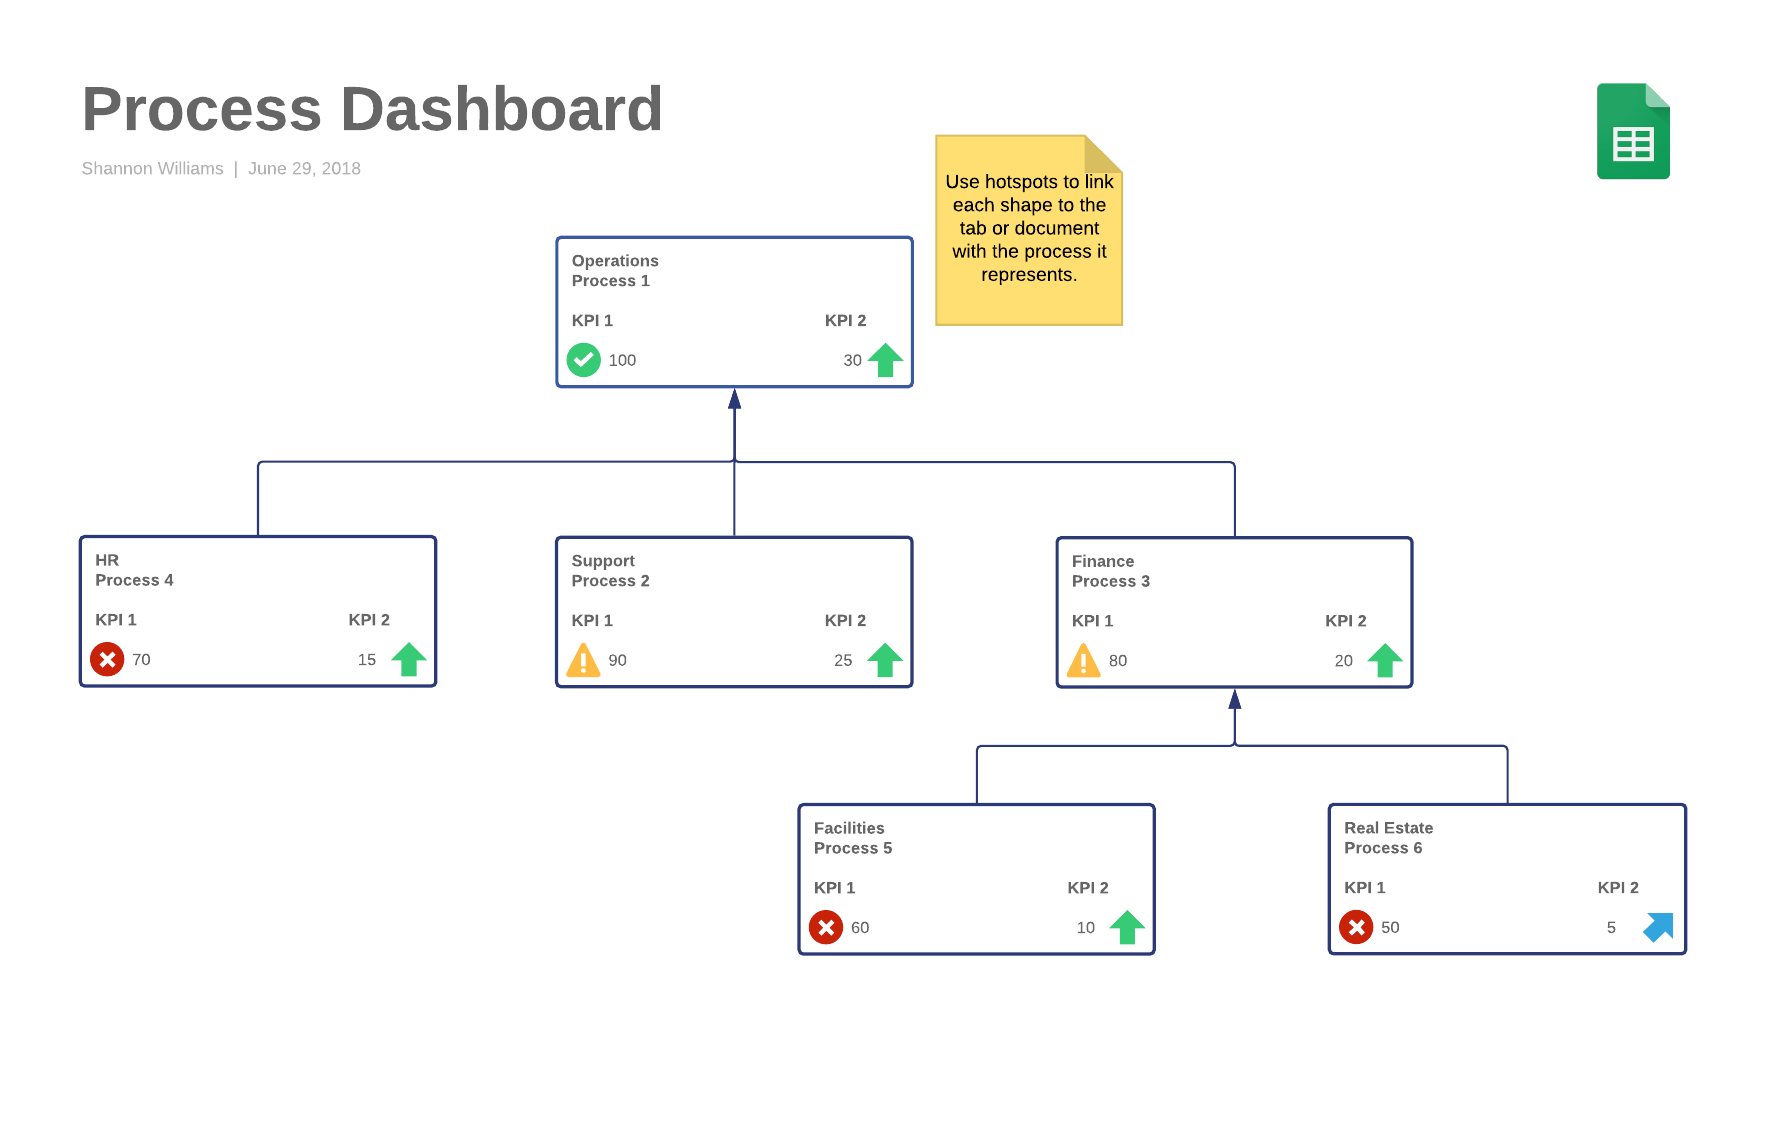
In Lucidchart, you can create visual dashboards that help you track your process performance. The template below shows the relationship of different processes along with KPIs for each process. You can link this document to a spreadsheet to pull in data, and conditional formatting will indicate any issues you should address. Click the template to try it out for yourself!

4. Process review
You have designed the process, assigned process owners, measured the process—and now it’s time to review the process and its effectiveness. This stage should include reviews with both internal and cross-functional teams. Be transparent about reviewing the process, and remember to document and share your findings.
5. Process improvement
Once you have reviewed the process, you should be able to identify process waste and opportunity for improvement. You can use a cost-and-effect matrix, prioritization matrix, or other visuals to align potential opportunities with the goals you want to achieve and prioritize.
As you decide on a process improvement methodology to use, remember that methodologies are not one-size-fits-all. Choose the methodology that works best for your company, even if you simply use basic process maps.
You should also empower your employees to identify and document improvement opportunities. Review these opportunities with internal and cross-functional teams, and give these teams the opportunity to contribute ideas on ways to improve.
6. Reward and recognition
If you think back to Jogee’s example, a switch to continuous improvement and a process-driven organization will require a change in culture. Employees need to start thinking proactively instead of reactively. Reinforce positive behaviors and recognize individuals and teams so they feel part of the organization.
For additional insights and a full Q&A session with Jogee Varughese, you can watch this webinar on demand.
As you seek to implement a specific process or change company culture, visuals can help you clearly explain your ideas and processes and bring the entire company on board. Try Lucidchart and see how working visually simplifies process improvement.
About the author

Polly Phillips is a product marketer who helps users get the most value out of Lucidchart. During her time in FP&A, she specialized in increasing the efficiency of her own processes, as well as cross-functional processes. Now, as a product marketing manager for Lucidchart, she's sympathetic to the pain points of our operations users and works to make Lucidchart ease those pains related to creating and optimizing processes. Polly is also a crazy dog mom who has a painting of her dog's head on Frida Kahlo's body (because Frida is her spirit human).
About Lucidchart
Lucidchart, a cloud-based intelligent diagramming application, is a core component of Lucid Software's Visual Collaboration Suite. This intuitive, cloud-based solution empowers teams to collaborate in real-time to build flowcharts, mockups, UML diagrams, customer journey maps, and more. Lucidchart propels teams forward to build the future faster. Lucid is proud to serve top businesses around the world, including customers such as Google, GE, and NBC Universal, and 99% of the Fortune 500. Lucid partners with industry leaders, including Google, Atlassian, and Microsoft. Since its founding, Lucid has received numerous awards for its products, business, and workplace culture. For more information, visit lucidchart.com.
Related articles
Six Sigma process mapping: Why it matters and how to get started
Learn everything you need to know about Six Sigma process mapping, including benefits, step-by-step instructions, and different types of process maps you can use.
Webinar recap: Critical elements for better decision-making
You make hundreds of decisions about your business—it's time to develop a framework to make better ones. We hosted a webinar with business analyst Steven Hodnett to cover critical elements for better decision-making. Read the recap!
Bring your bright ideas to life.
By registering, you agree to our Terms of Service and you acknowledge that you have read and understand our Privacy Policy.