
How to estimate sprint velocity for better Agile planning
Reading time: about 7 min
Topics:
Working in Agile development cycles helps your team improve processes, increase productivity, and add product value while releasing updates and new features that your customers need as quickly as possible.
To reach your goals and release quality products at a fast pace, you need to know how much work your team can complete in a sprint. This helps you to estimate how much time you need before the project is completed. Knowing this type of information makes it easier to get the right people assigned to the right tasks and ensure that you have the resources the team needs to get the job done.
Let's review how you can determine your team’s sprint velocity and how to use it to accurately estimate the amount of work that your team can complete in each sprint.
What is sprint velocity?
By looking at the amount of work your team completed in previous sprints, you should be able to estimate how much work they can do in future sprints. In Agile development, this estimate is known as sprint velocity.
With this knowledge in-hand, you can plan projects and predict how much work can be completed in the next sprint. You should also have a better idea of the resources you will need and the effort it will take to complete the project. In addition, your sprint velocity estimate gives senior management and other stakeholders a better idea of when to expect delivery of the product.
How to estimate sprint velocity
In order to estimate what work can be completed in the future, you need to measure the work that has previously been done. To get a good average measurement of work that has been done, plan to review the previous three sprints.
In the following example, we will use story points to measure the amount of work completed in each sprint. A story point is a measurement used by Agile development teams to estimate how much effort and time it will take to complete a user story.
Step 1: Count how many user story points are completed in each sprint
At the end of a sprint, add up how many story points the team completed.
For example, assume that in sprint one:
- The team committed to completing five user stories.
- Each user story had eight story points for a total of 40 story points.
- The team completed three of the five user stories.
In sprint two:
- The team committed to seven user stories (including the two that were not completed in sprint 1).
- Each user story had eight story points for a total of 56 story points.
- The team completed four of the seven user stories.
In sprint three:
- The team committed to nine user stories.
- Each user story had eight story points for a total of 72 story points.
- The team completed five of the nine user stories.
Step 2: Calculate the average of completed story points
Simply add up the total of story points completed from each sprint, then divide by the number of sprints.
Sprint one: 3 user stories x 8 story points = 24
Sprint two: 4 user stories x 8 story points = 32
Sprint three: 5 user stories x 8 story points = 40
Total = 96
So, your average sprint velocity is 96 ÷ 3 = 32.
You can now base the amount of work to be done in future sprints on an average of 32 story points. If you have 160 story points remaining to be completed in the project, you can assume that your team will need another five sprints to complete the project.
However, this is just an estimate and is accurate only if variables such as team size and project complexity, and scope remain constant. Your teams will experience fluctuations from sprint to sprint. But the sprint velocity estimation is a good starting point to help you determine how much work your team can do.
If your team is new to Agile development, you won’t have any previous sprints to look at. As part of your sprint velocity estimation to-do list, you’ll have to complete a couple of sprints while tracking how many story points are completed in each. Then you will have some useful data that will help calculate an average.
Track progress with visuals
Agile has several tools, such as velocity charts, burndown charts, and Kanban boards, that you can use to track your team’s progress. Ideally, these tools are cloud-based, so anybody who needs to look at them can access them.
Velocity chart
This is a simple visual representation of your project’s progress. Its purpose is to help project managers estimate team performance. The chart lets you visualize the overall status of a project, and how much work your Agile team can complete in future sprints.
A velocity chart is a graph that lets you easily see estimated story points against completed story points. Story points are measured on the vertical axis, and completed sprints are displayed on the horizontal axis.
Velocity burndown chart
A burndown chart is a graphical “information radiator” that shows the work that is planned to be completed in a sprint. Burndown charts let teams see how much work has been done, how much work is left to do, and how much time remains to complete the work. As tasks are completed, the graph “burns down” to zero on or before the last day of the time period.
In other words, a burndown chart is a visual representation of the work that is planned to be finished during a sprint or set time frame. This chart helps teams see how much work has been finished, the remaining amount of work, and how long it takes to complete that work. The burn rate estimates the amount of work that is done and the required rate of work based on the set time frame.
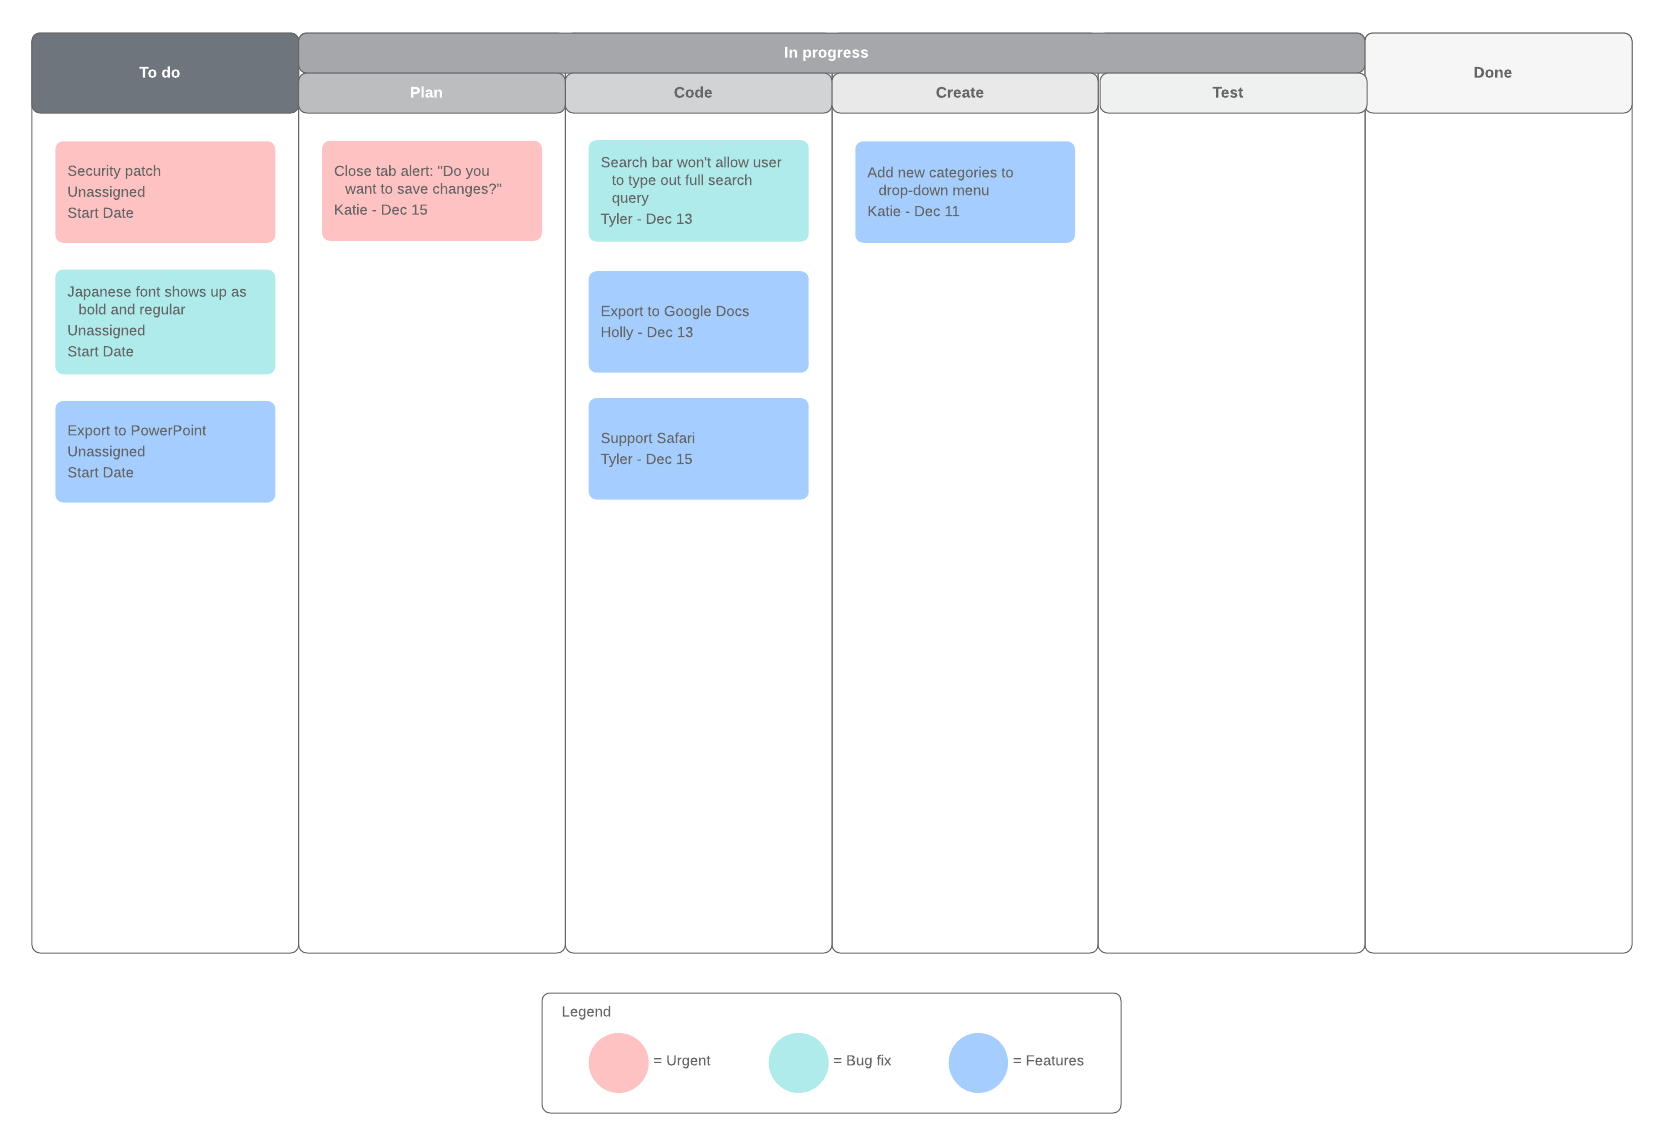
Kanban board
A Kanban board lists tasks in columns in the form of sticky notes or cards to help you visualize and track work. The simplest Kanban board configuration displays at least three columns representing various states of work progress, such as “To Do,” “In Process,” and “Done.”
How to stabilize and improve velocity in Agile
Remember that velocity is an estimation and it should not be considered the single source of truth for what the team will deliver. The number of completed story points will vary from the estimated number. You may need to add what the Scaled Agile Framework (SAFe) calls “stabilization sprints.”
A stabilization sprint is added to the end of your normal development cycle before the product is shipped. Stabilization sprints are used to take care of technical debt, clean up code, fix bugs, perform testing against code fixes, and so on. You typically don’t track velocity in stabilization sprints because you are not adding any new stories or story points.
As you work more with velocity in scrum, you will get better at estimating the work that can actually be completed.
When working to stabilize and improve velocity, consider the following:
- Write user stories that are clear, simple to read, and easy to understand.
- Keep team membership and size as consistent as possible.
- Use your sprint retrospectives to explore ways to stabilize velocity. For example, find ways to improve communication and coordinate the work to complete tasks on time.
- Eliminate dependencies that can delay work that the team has committed to complete.
- Develop a better definition of done. Look at the tasks that are completed during a stabilization sprint and ask how you could have completed the task during the normal sprint.
- Focus on quality instead of speed. Don’t rush through work to meet an estimate. The sprint velocity should not be the team’s goal. Taking time to develop quality products that are thoroughly tested will give you a better velocity estimate going forward.
- Make sure there is enough time for proper testing to ensure that you are delivering quality products. Also, make sure you are not spending time on unnecessary tests. For example, if code hasn’t changed and has been stable for several sprints, don’t waste time testing it again.
- Get help when needed. If your team is short on the skills needed to complete certain tasks, recruit inside or outside help.
- Make sure everybody is trained. As new technologies are added to your products, some team members may fall behind. Help team members stay up to speed by offering training to improve skill sets.
Sprint velocity is not static, but reviewing past sprints to see what was accomplished can go a long way toward accurately predicting what your team can deliver in future sprints.

Learn how to create an Agile release plan to build new features and products faster.
Read moreAbout Lucidchart
Lucidchart, a cloud-based intelligent diagramming application, is a core component of Lucid Software's Visual Collaboration Suite. This intuitive, cloud-based solution empowers teams to collaborate in real-time to build flowcharts, mockups, UML diagrams, customer journey maps, and more. Lucidchart propels teams forward to build the future faster. Lucid is proud to serve top businesses around the world, including customers such as Google, GE, and NBC Universal, and 99% of the Fortune 500. Lucid partners with industry leaders, including Google, Atlassian, and Microsoft. Since its founding, Lucid has received numerous awards for its products, business, and workplace culture. For more information, visit lucidchart.com.
Related articles
How to nail your Agile communication plan
We’ll cover what makes Agile communication plans different and what best practices you can follow for creating an Agile communication plan that works for your team.
How to estimate story points for improved Agile planning
There’s a better way to estimate the time it takes for Agile planning: story points. Here, walk you through the best practices for successful story point estimation.
Bring your bright ideas to life.


By registering, you agree to our Terms of Service and you acknowledge that you have read and understand our Privacy Policy.