What is PERT in project management?
PERT stands for Program Evaluation and Review Technique. A PERT chart is a visual tool used for determining the length of time each step in a project should take, as well as dependencies for those steps. It’s especially useful for determining the duration of riskier projects, as it accounts for milestones (also known as events or steps) taking more time in a worst-case scenario.
Since the United States Navy uses PERT, it should stand to reason that every organization would do well to emulate their technique. However, that may not be the case for your company: You may find, for instance, that a PERT chart is overkill, and basic project management software is enough to keep your team on task. On the other hand, you may have such complicated projects to deploy that PERT chart software could very well be the magic bullet for meeting every deadline.
Advantages of PERT
- Shows dependencies between each step in the work breakdown structure
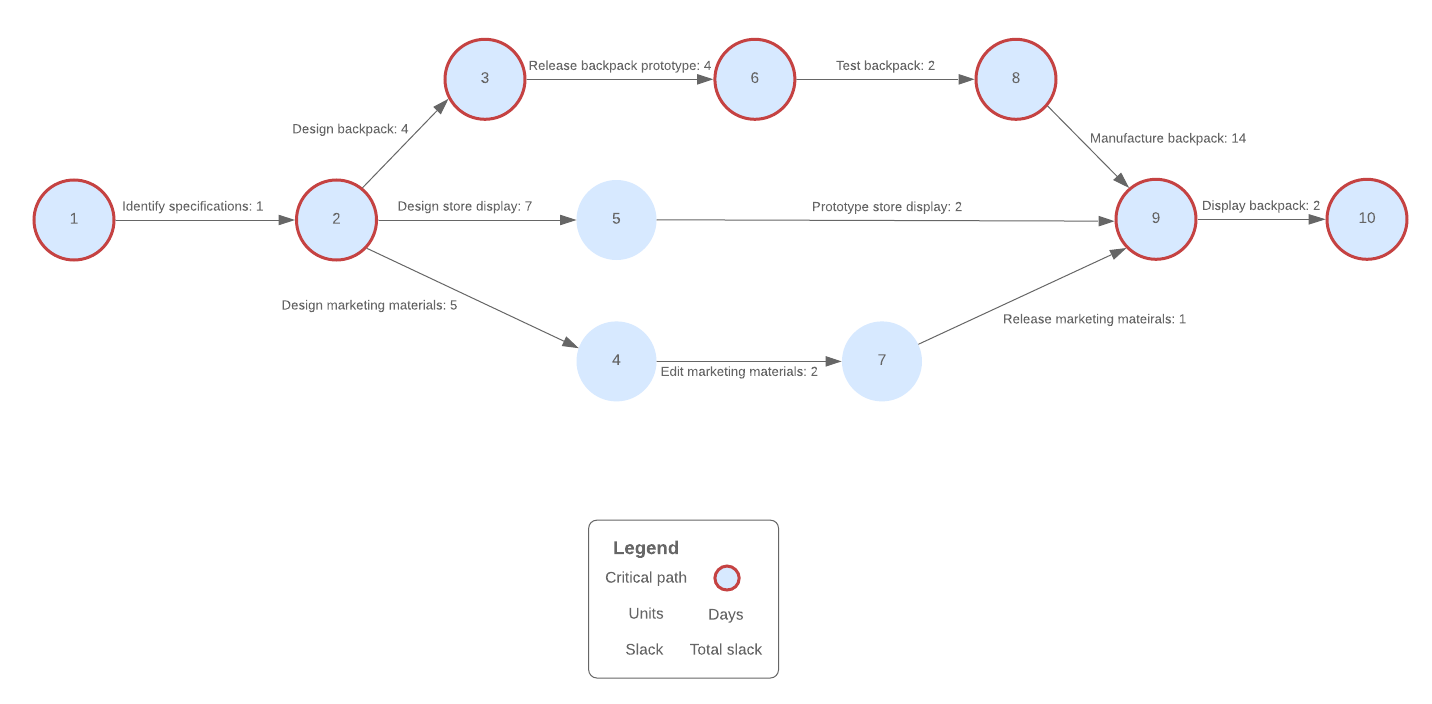
- Can help you find the longest path (also known as the “critical path”) to a project’s completion
- Identifies different time completions for each step
- Potentially speeds up a project’s completion by allowing for overlapping tasks to be identified and initiated
- Allows you to easily visualize and organize a complex project
Disadvantages of PERT
- Could become too convoluted to understand as an exceptionally complex project could contain hundreds of dependencies and steps
- Requires a lot of effort—not ideal for smaller projects
- Is difficult to immediately visualize the timeline and a solid deadline for the project due to variable time estimates for each step
How to create a PERT chart
If you think the PERT method may be ideal for your organization’s project, you’ll need to commit to building a diagram by hand or using diagramming software (do yourself a favor and go with the diagramming software: there aren’t enough erasers in the universe to keep up with having to draw this stuff out manually).
1. Know your tasks
Don’t attempt to build a PERT chart without knowing exactly which steps your project requires and in which order those steps go. You’ll need to have a basic understanding of which tasks are critical and which are not. You’ll also want to consider using the PERT method near the end of your project planning, not at the beginning, because you’ll need the project to be fully scoped.
If you haven’t yet, consider creating a project scope statement or work breakdown structure.
2. Calculate time
PERT’s real innovation is accounting for variables in completion, and those variables are reflected in each step.
In the PERT method, there are three times displayed for each step of the project:
- Optimistic (o): The optimistic time is the bare minimum of time needed to complete an activity in the case that everything goes right.
- Pessimistic (p): The pessimistic time calculates for the time a task will take if everything goes wrong.
- Most likely (m): The most likely time is the best estimate of the time required if everything goes normally.
Once you have numbers for each task, you can calculate the estimated duration for each step. Each number (o, p, and m) holds a weighted average of 16.66 percent each. The formula for finding the estimated duration of each task is:
Estimated duration = ((Optimistic + Pessimistic + (4 x Most likely))/6
This formula looks more complicated than it really is. For example, say you estimate a step to take about 12 hours of work. If everything goes right, the step could be completed in 8 hours. If you run into multiple delays, it could take 28 hours. Plug those figures into the chart:
Estimated duration = 8 + 28 + (4*12)/6 = 14
So now you know that your step is likely to take about 14 hours to complete.
You don’t necessarily need to follow the formula for each step of your PERT chart, but you may do so if you wish. Or you may only follow the formula for steps that carry the most risk. If you’re completely unsure about how long a project should take or you’re embarking on a totally new project with unfamiliar steps, it may be worth it to calculate the expected duration for each step.
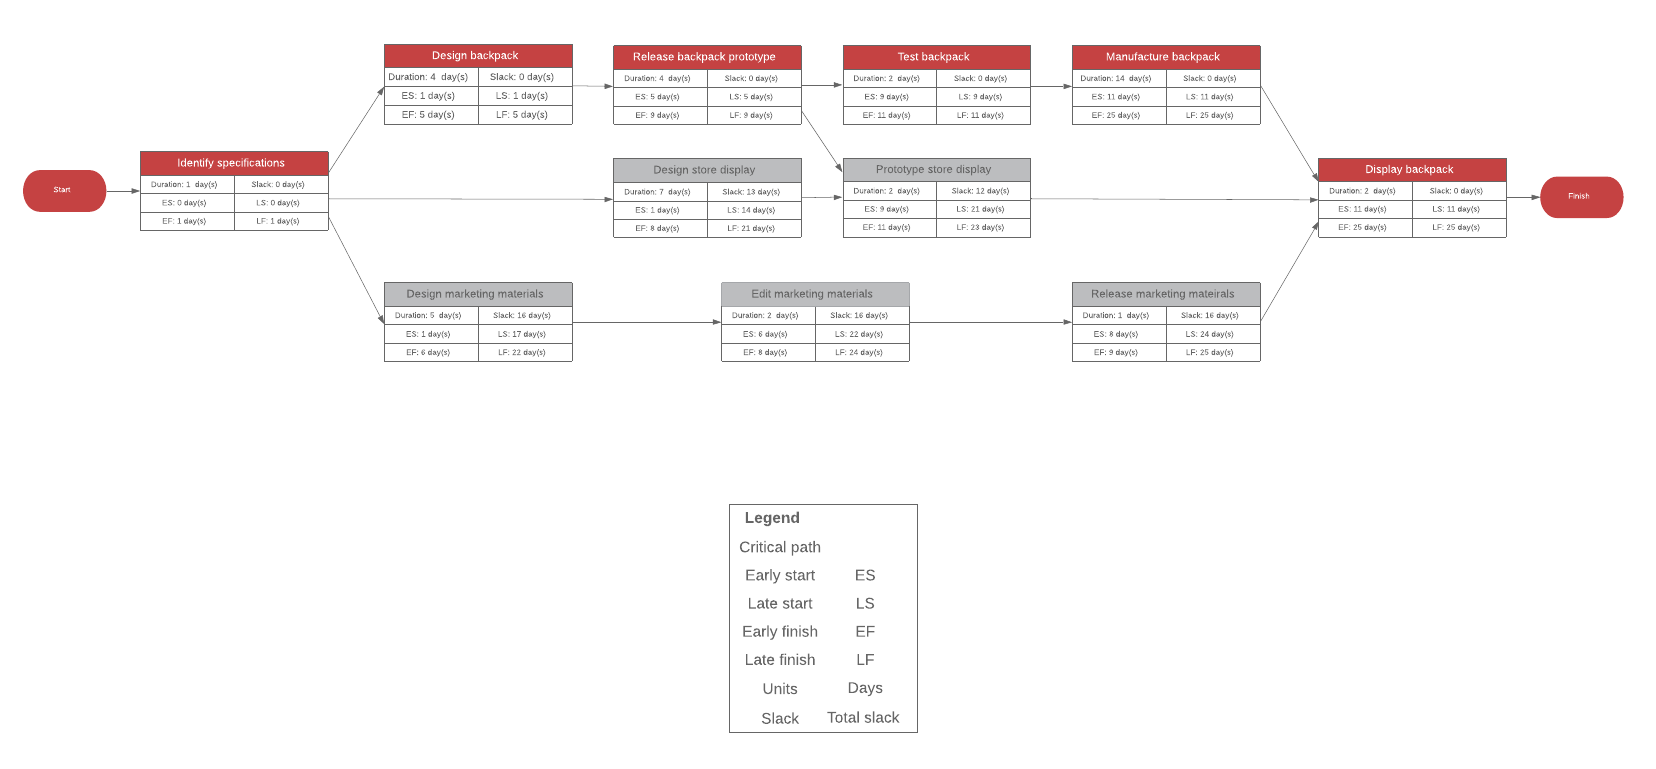
Either way, you do need to display optimistic, pessimistic, and normal times for each step. You’ll also need to display a description of each step.
Once you’ve plugged in each step into your chart in order, you’ll have a visual layout of the project’s steps to completion with accompanying time estimate. You can then determine which is the critical path by identifying which steps and their dependencies will take the longest to complete.
Get started with one of the templates below.